")
Back to Journals » Drug Design, Development and Therapy » Volume 8
Pharmacokinetics and bioavailability of oxycodone and acetaminophen following single-dose administration of MNK-795, a dual-layer biphasic IR/ER combination formulation, under fed and fasted conditions
Authors Devarakonda K, Morton T, Margulis R, Giuliani MJ, Barrett T
Received 18 March 2014
Accepted for publication 17 April 2014
Published 19 August 2014 Volume 2014:8 Pages 1125—1134
DOI https://doi.org/10.2147/DDDT.S64261
Checked for plagiarism Yes
Review by Single anonymous peer review
Peer reviewer comments 4
Krishna Devarakonda,1 Terri Morton,1 Rachel Margulis,2 Michael Giuliani,3 Thomas Barrett4
1Clinical Pharmacology and Pharmacokinetics, 2Clinical Operations, 3Research and Development, 4Clinical Affairs, Mallinckrodt Inc., Hazelwood, MO, USA
Background: XARTEMIS™ XR (formerly MNK-795) is a combination oxycodone (OC) and acetaminophen (APAP) analgesic with both immediate-release and extended-release (ER) components (ER OC/APAP). The tablets are designed with gastric-retentive ER oral delivery technology that releases the ER component at a controlled rate in the upper gastrointestinal tract. Because consumption of food has demonstrated an impact on the pharmacokinetics (PK) of some marketed products using gastric-retentive ER oral delivery technology, a characterization of the effects of fed (high- and low-fat diets) versus fasted conditions on the PK of ER OC/APAP was performed.
Methods: This Phase I study used an open-label randomized single-dose three-period six-sequence crossover single-center design. Healthy adult participants (n=48) were randomized to receive two tablets of ER OC/APAP under three conditions: following a high-fat meal; following a low-fat meal; and fasted. Plasma concentration versus time data from predose throughout designated times up to 48 hours postdose was used to estimate the PK parameters of oxycodone and APAP.
Results: Thirty-one participants completed all three treatment periods. Both oxycodone and APAP were rapidly absorbed under fasted conditions. Total oxycodone and APAP exposures (area under the plasma drug concentration-time curve [AUC]) from ER OC/APAP were not significantly affected by food, and minimal changes to maximum observed plasma concentration for oxycodone and APAP were also noted. However, food marginally delayed the time to maximum observed plasma concentration of oxycodone and APAP. There was no indication that tolerability was affected by food.
Conclusion: The findings from this study suggest that ER OC/APAP can be administered with or without food.
Keywords: extended release, acute pain, fed conditions, opioid fixed dose combination
Background
Treatment of acute pain is an integral part of patient care in postoperative, postpartum, and emergency settings, as well as in the management of musculoskeletal diseases and medical illnesses, including cancer.1 It is well documented that analgesics containing a combination of opioid and nonopioid agents can provide effective pain relief. Combination opioid/nonopioid therapy with oxycodone (OC) and acetaminophen (APAP), for example, has been shown to provide effective analgesia in the treatment of low back pain,2–4 arthritis,2,5–8 cancer,2,9 and postoperative pain.2,10–13 In addition, combining analgesic agents with different mechanisms of action is intended to be additive or synergistic, such that lower doses of each agent may theoretically be used.2,14–17
Acetaminophen is a nonopioid analgesic that is often used in combined formulations with opioids.14,17–23 In recent years, concerns have been raised about possible drug-induced liver damage, prompting the US Food and Drug Administration (FDA) to limit the amount of APAP allowed in combination products to 325 mg per tablet.24 Immediate-release (IR) OC/APAP (Percocet®; Endo, Dublin, Ireland) was introduced in 1976 and is still widely used for pain management. This fixed-dose IR combination of OC/APAP (available in doses of 2.5/325 mg, 5/325 mg, 7.5/325 mg, and 10/325 mg) has a well-documented postapproval efficacy and adverse event (AE) profile2 supported by many years of clinical experience and an extensive literature. The usual dosing interval for treatment of pain with this IR OC/APAP formulation in adults is one tablet as needed every 4–6 hours.19,25
Extended-release (ER) opioid combined formulations are designed to provide longer-lasting analgesia without the need for frequent dosing. At present, however, there are no other opioid/nonopioid analgesic combination drugs in an ER formulation approved by the FDA with a 12-hour dosing regimen. XARTEMIS XR (formerly MNK-795; ER OC/APAP; Mallinckrodt Brand Pharmaceuticals, Inc., Dublin, Ireland) is a bilayer IR and ER combination analgesic that is indicated for the management of acute pain severe enough to require opioid treatment and for which alternative treatment options are inadequate.26 Each tablet contains 7.5 mg OC/325 mg APAP, and the formulation provides rapid release, followed by sustained absorption of OC and APAP during the 12-hour dosing regimen. In single- and multiple-dose pharmacokinetic (PK) studies, the authors found no lag in the time to the first measurable concentration of OC or APAP after ingestion of a two-tablet dose of ER OC/APAP (15 mg OC/650 mg APAP); peak OC plasma concentrations for this dose occurred at 3 hours and were sustained over the 12-hour dosing period; peak APAP plasma concentrations occurred within 30–60 minutes postdose and tapered off before the subsequent dose.27,28 ER OC/APAP tablets employ a dual-layer biphasic delivery mechanism that, when administered as a single dose (ie, two tablets), is designed so that the IR component delivers 3.75 mg OC/325 mg APAP and the ER component delivers 11.25 mg OC/325 mg APAP. The tablets incorporate Acuform® technology (Depomed, Inc., Newark, CA, USA), which is designed to use release-controlling polymers that allow the tablet to remain in the stomach for several hours.29 This technology provides release of medication in the upper gastrointestinal tract at a controlled rate for an extended period of time.29–31 Each ER OC/APAP tablet contains high molecular-weight polyethylene oxide (Polyox®; Dow Chemical Company, Midland, MI, USA) as a swellable release-controlling polymer, which imparts gastric-retentive properties to the dosage form. The gastric-retentive delivery system also conveys physicochemical properties to the product that may reduce abuse liability. A battery of in vitro evaluations of ER OC/APAP and an IR OC/APAP comparator demonstrated that the functional polymer, Polyox, creates obstacles to tampering techniques commonly used to facilitate abuse. Further evaluation of abuse-deterrent properties is in progress.
Intake of food before administration has been shown to impact the PK profile of products using gastric-retentive ER oral delivery technology. In fact, both calorie and fat content have been shown to affect the PK of drug products using the same Acuform® technology (eg, Gralise®; Depomed, Inc.).31 Given the possibility of a food-related PK effect with this formulation of OC/APAP, assessing the effect of food intake on ER OC/APAP was warranted. Effects of a standardized high-fat meal (>50%) were assessed, as recommended by the FDA for use in bioavailability studies, although effects of a low-fat breakfast (<30% fat), consistent with American Heart Association recommendations, were also explored.32 The primary objective of the present study was to determine the effect of fed conditions (both high- and low-fat meals) versus fasted conditions on the PK profile and bioavailability of OC and APAP from two tablets of ER OC/APAP. The secondary objective was to examine the safety and tolerability of ER OC/APAP under fed and fasted conditions.
Materials and methods
Participants
The study population included 48 healthy male and female participants between the ages of 18 and 55 years.
Inclusion and exclusion criteria
Eligibility criteria for the study included a body mass index between 19 and 30 kg/m2, with a minimum weight of 130 lb (59 kg). Female participants were required to be nonpregnant and nonlactating; if capable of pregnancy, they were required to use two methods of birth control. Participants were also required to be able and willing to follow all protocol requirements and study restrictions, including consumption of the entire standardized FDA high-fat or low-fat meal in 30 minutes or less before study medication dosing.
Exclusion criteria included: a history of drug abuse or treatment for abuse; positive urine test results for drugs of abuse, alcohol, and/or cotinine (for tobacco use); smoking or use of nicotine-containing products within 6 months before the onset of the study; any medication allergy, hypersensitivity, or intolerance, including reactions to OC, APAP, or any opioid analgesic; any condition that might have interfered with absorption, distribution, metabolism, or excretion of the study medication; or previous gastric bypass or gastric band surgery. Other reasons for exclusion included use of prescription drugs or over-the-counter medications, including nutritional supplements, during the study or within 14 days before study initiation, and categorization as a subject from a vulnerable population, as defined by the Code of Federal Regulations Title 45.
Study design
This was an open-label single-center randomized single-dose three-period, six-sequence crossover Phase I trial of 13 weeks’ duration. The overall study design is depicted in Figure 1. There was a screening visit up to 45 days prior to period 1. Each crossover period required confinement at the study site (clinic) of approximately 60 hours, and each dose was separated by a minimum 7-day washout period. For participants with ongoing AEs, there was a follow-up visit at least 7 days after the conclusion of the study.
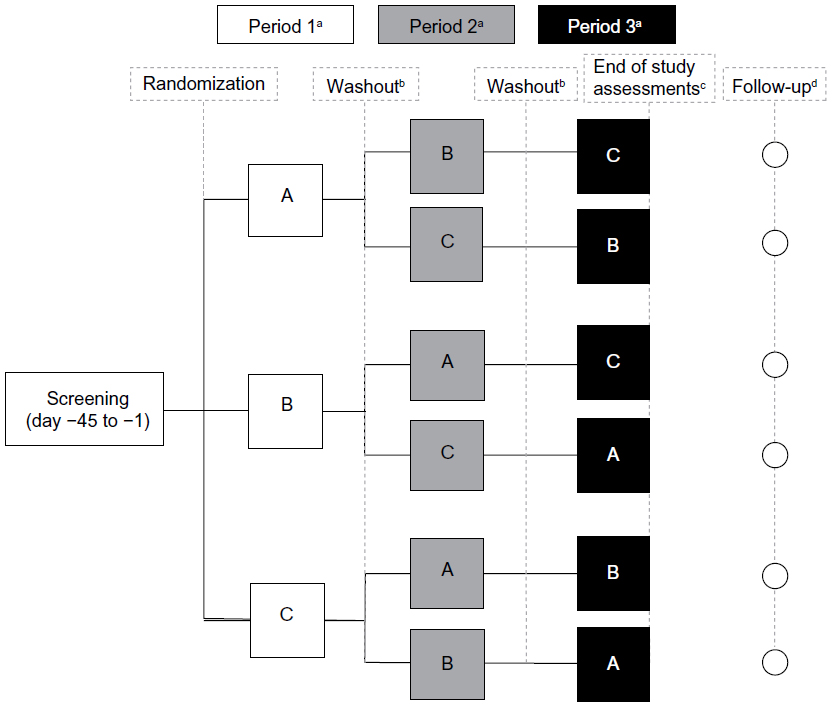 | Figure 1 Study design. |
Ethics
All participants read and signed a study-specific informed consent form before participation in any study procedures. The study protocol, investigators, study site, informed consent, and recruiting materials were reviewed and approved by the registered ethical review board IntegReview (Austin, TX, USA), which operated in accordance with the US 21 Code of Federal Regulations and International Conference on Harmonisation guidelines for Good Clinical Practices (E6). All research in this study was carried out in accordance with the International Conference on Harmonisation Good Clinical Practice, ethical principles that have their origin in the Declaration of Helsinki, and US clinical research regulations and guidelines. Print media and phone calls were used for recruiting.
Treatment conditions
Eligible participants were randomized into one of six treatment sequences based on a computer-generated randomization schedule and received two tablets of ER OC/APAP under fed or fasted conditions. There were three treatment groups for each period: two that received ER OC/APAP after breakfast (high-fat or low-fat meal – see “Meals” below) and one group that received ER OC/APAP without consuming a meal (fasted state). In the fed treatment groups, study medication was administered within 30 minutes of the start of a high- or low-fat meal. In treatment condition A, ER OC/APAP was administered in the fed state following a standard high-fat breakfast. In treatment condition B, ER OC/APAP was administered in the fed state following a low-fat breakfast.
In both treatment conditions A and B, participants were required to consume the meals within 30 minutes. In treatment condition C, ER OC/APAP was administered in the fasted state. All study participants fasted for at least 10 hours (overnight) prior to the beginning of each treatment period. During the overnight fast, participants were allowed to consume water, although no fluids were allowed for 1 hour prior to study medication dosing (except those provided with breakfast for treatment conditions A and B) and for the first hour after dosing. Subjects had no access to outside food or beverages and remained in-house the entire length of each period to maintain compliance with fasting and standardized meal conditions and fluid consumption. During the study confinement, fluid intake was restricted to water and to fluids provided with meals. No other food was allowed for the first 4 hours after dosing for all treatment conditions. After 4 hours, all participants were allowed to consume standardized meals that were served at appropriate times.
Meals
The standardized high-fat meal (treatment A; approximately 1,000±100 kcal; >50% fat, 13% protein, and 28% carbohydrates) consisted of eggs fried in butter, bacon, white toast with butter, hash brown potatoes fried in butter, and whole milk.33 The low-fat breakfast consisted of orange juice, whole-grain oat cereal, a hard-boiled egg, bagel with cream cheese, blueberry muffin, and 2%-fat milk (approximately 800±80 kcal; <30% fat, 14% protein, and 56% carbohydrates). Low-fat breakfasts and standardized meal contents were designed by a registered dietician and prepared at the clinical site (PPD, Austin, TX, USA).
Blood collection and sample preparation
Blood samples were collected for PK analysis of OC and APAP plasma concentrations prior to dosing and at 15, 30, and 45 minutes and 1, 2, 3, 4, 5, 6, 7, 8, 9, 10, 12, 16, 18, 20, 24, 36, and 48 hours after dosing. At each time point, researchers collected 6 mL samples of whole blood from each participant in prechilled vacuum blood collection tubes containing the anticoagulant K2EDTA. Plasma samples were kept cool while processing and were frozen within 1 hour of collection at −70°C or below.
Drug concentration measurements
Plasma samples were analyzed for OC and APAP using a validated liquid chromatography (1,100 LC binary pump; Agilent Technologies, Santa Clara, CA, USA)/tandem mass spectrometry (LC-MS/MS, API3000; Thermo Fisher Scientific, Waltham, MA, USA) method. The method used was developed by PPD (Middleton, WI, USA) and validated over a calibration range of 0.100 to 100 ng/mL for OC and 100 to 50,000 ng/mL for APAP using 0.100 mL of plasma containing K2EDTA. It was validated for linearity, precision, accuracy, ruggedness, recovery, and specificity. The calibration curves used for each analyte contained eight points (excluding 0). In addition, stability studies were carried out under short- and long-term conditions in which plasma samples were exposed to five freeze/thaw cycles.
Plasma was fortified with a combined OC-d6 (Cerilliant Corp, Round Rock, TX, USA)/APAP-d4 (C/D/N Isotopes Inc., Point-Claire, Quebec, Canada) internal standard working solution. Analytes were isolated through liquid–liquid extraction with a methyl tert-butyl ether: dichloromethane: hexane mixture, the organic supernatant was evaporated under a nitrogen stream, and the remaining residue was reconstituted with mobile phase.
The reconstituted solution was injected into the liquid chromatography–tandem mass spectrometry system. Chromatographic separation was performed using a Zorbax SB-Aq column (3.5 μm, 3×100 mm; Agilent Technologies) and the column temperature was maintained at 55°C. All separations were achieved at a flow rate of 0.500 mL per minute.
Each calibration curve was generated using a linear-weighted least squares (LS) regression algorithm for OC (1/concentration) and APAP (1/concentration2). Calibration curves were plotted as the ratio of the peak area of the analyte to the internal standard versus concentration. Linearity was indicated by correlation coefficients greater than 0.990 for each standard curve.
Determination of PK parameters and statistical analysis
No formal power calculations were performed; however, in order to explore PK differences between the groups, a total of 48 participants were targeted for enrollment to attain a sample size of ≥20 participants who completed all three treatment conditions.
Plasma concentration versus time data were used to estimate the PK parameters of OC and APAP by standard noncompartmental methods using Phoenix® WinNonlin® Version 6.1 (Certara, LP, St Louis, MO, USA). Actual sampling times were used to calculate PK parameters. The SAS® mixed-effect linear model procedure (SAS Institute, Inc., Cary, NC) was used to perform an analysis of variance to compare data from treatment conditions A, B, and C using the following natural log-transformed PK parameters: AUC from time 0 to the last quantifiable data point (AUC0–t); AUC from time 0 to infinity (AUC0–inf); and the maximum observed plasma concentration (Cmax). AUC0–inf, AUC0–t, and Cmax were dependent variables, with sequence, treatment, and period as fixed effects, and subject nested within sequence as a random effect. A 90% confidence interval (CI) of the geometric LS mean ratio contained within 80%–125% led to the conclusion that there was no difference between treatment conditions. P-values for testing the fixed effects of sequence, period, and treatment were provided.
The Wilcoxon signed-rank test was utilized to compare untransformed time to Cmax (tmax) and time prior to the first measurable concentration (tlag). A P-value ≤0.05 was considered a significant difference between treatment conditions.
SAS mixed-effect linear model procedure was also used to perform analysis of variance on the untransformed PK parameters for apparent first-order terminal elimination rate constant and apparent plasma terminal elimination half-life. A 90% CI of the difference that contains 0 was used to conclude that there was no difference between treatment conditions (α=0.1). LS means and difference of LS means as well as P-values for testing the fixed effects were calculated.
Safety and tolerability
Safety evaluations included AE monitoring, laboratory assessments, vital signs, pulse oximetry, physical examination, and electrocardiograms (ECGs). Vital signs and pulse oximetry were assessed approximately 90 minutes prior to dosing and at specified time points up to 48 hours postdose. Clinical laboratory tests (hematology, chemistry, and urinalysis), physical examinations, and ECGs were performed at screening and at the end of the final treatment period or early termination. Reports of AEs were collected and monitored throughout the study. Treatment-emergent AEs were defined as events that emerged during treatment or that had worsened relative to the pretreatment state. AEs were summarized with descriptive statistics; statistical comparisons were not made for AEs.
Results
Participant disposition and baseline characteristics
Forty-eight participants enrolled, received study medication, and were included in the safety analysis (safety population). Of these participants, 31 (65%) completed all three periods/conditions of the study (completers) and were included in the PK analysis (PK population). Baseline demographics were comparable between the enrolled participants and completers with the exception of a higher percentage of male participants among the completers (21 of 31 participants [68%]; Table 1).
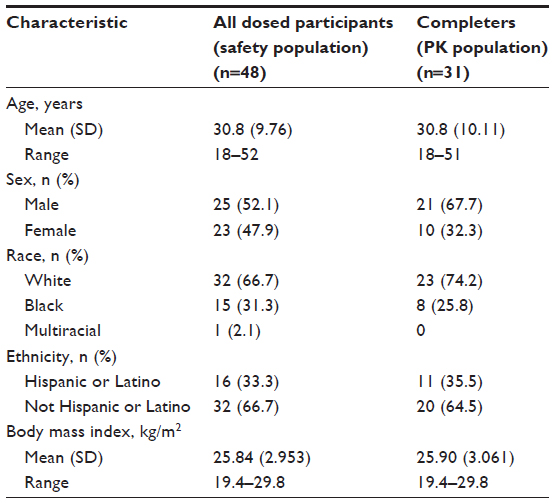 | Table 1 Participant demographics |
Of the 17 participants (35%) who discontinued early from the study, 14 withdrew because of vomiting (withdrawn per protocol): five participants during treatment condition A; five during treatment condition B; and four during treatment condition C. Another three participants met other withdrawal criteria: one participant did not consume 100% of the standard breakfast in period 2; one participant tested positive for cocaine and cotinine (a metabolite of nicotine) at the check-in for period 3; and one participant tested positive for cotinine at the check-in for period 2.
PK analysis: oxycodone
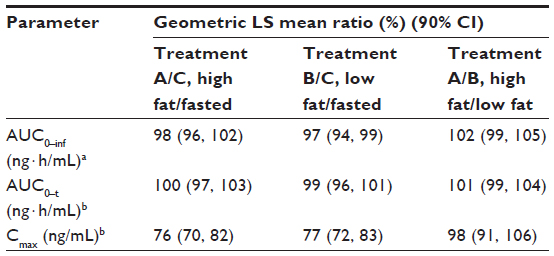
Mean plasma concentration-time curves for OC by treatment condition are shown in Figure 2, and PK parameters are shown in Table 2. The mean total exposure (AUC0–t and AUC0–inf) of OC was similar under both high- and low-fat states and similar to that during the fasted condition; the 90% CIs of the geometric LS mean ratio were entirely contained in the no-effect (80%–125%) range (Table 3). The mean Cmax of OC increased 25% under the low-fat fed condition versus fasted condition. The 90% CI of the geometric LS mean ratio for Cmax was entirely contained within the no-effect range for the high-fat state and was partially contained within the no-effect range for the low-fat state compared with the fasted state (Table 3).
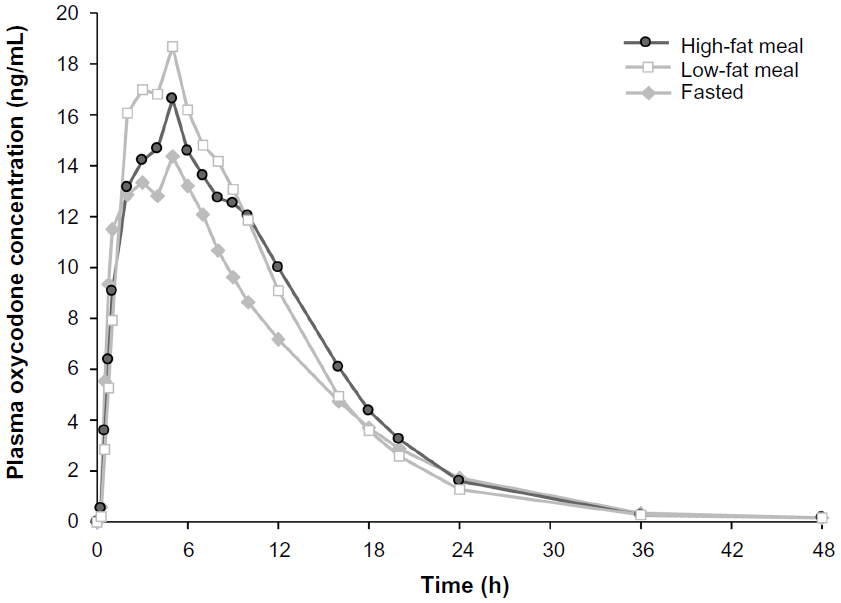 | Figure 2 Mean plasma concentration of oxycodone versus time by treatment condition. |
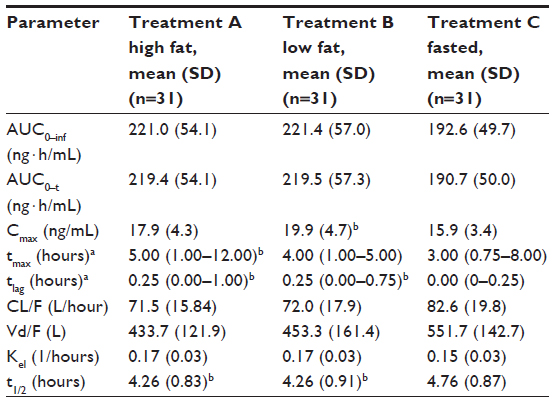 | Table 2 Pharmacokinetic parameters for oxycodone following administration of ER OC/APAP (two tablets, 15 mg OC/650 mg APAP) under fed and fasted conditions |
 | Table 3 Oxycodone geometric LS mean ratios and 90% CIs for comparison of ER OC/APAP (two tablets, 15 mg OC/650 mg APAP) under fed and fasted conditions |
Under the fasted condition, OC was rapidly absorbed, with no lag in appearance in plasma (Table 2). Administration of ER OC/APAP with food (high-fat and low-fat meal) resulted in a slight but statistically significant increase in median lag time (tlag) for OC compared with values observed for the fasted state (15 minutes, P<0.02) The median tmax of OC was statistically significantly delayed (2 hours) under high-fat fed versus fasted conditions (P<0.02). There was no statistically significant difference in tmax under low-fat fed conditions versus fasted conditions. Administration of ER OC/APAP with food resulted in a modest but statistically significant decrease in t1/2 of OC (P<0.01) compared with values for participants under fasted conditions.
PK analysis: acetaminophen
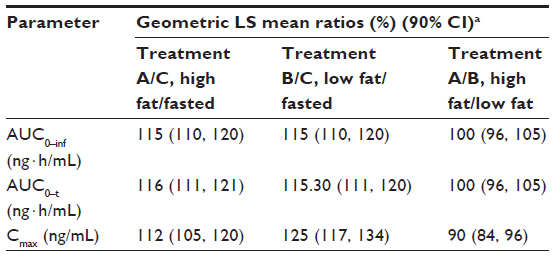
Plasma concentration-time curves for APAP by treatment condition are shown in Figure 3, and PK parameters are shown in Table 4. Mean total exposure (AUC0–t and AUC0–inf) of APAP was similar under both high- and low-fat conditions and both were similar to the fasted state, as the 90% CIs of the ratios of geometric LS mean were fully contained within the no-effect range (Table 4). The mean Cmax for APAP decreased by 23% to 24% under high- and low-fat fed conditions versus the fasted condition. Accordingly, the 90% CIs for Cmax of APAP were partially contained in the no-effect range (80%–125%) for both high- and low-fat conditions compared with fasted conditions (Table 5).
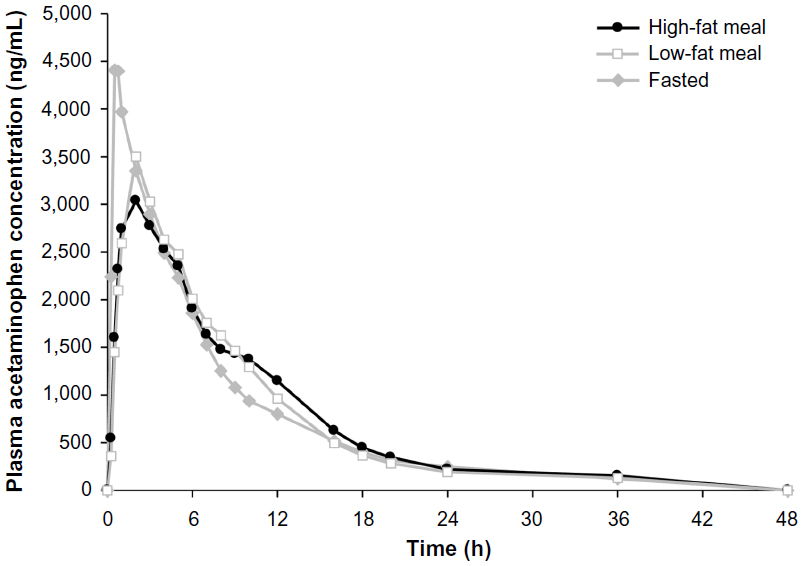 | Figure 3 Mean plasma concentration of acetaminophen versus time by treatment condition. |
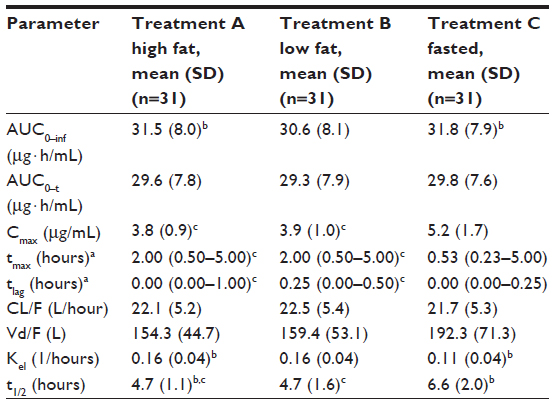 | Table 4 Pharmacokinetic parameters for APAP following administration of ER OC/APAP (two tablets, 15 mg OC/650 mg APAP) under fed and fasted conditions |
 | Table 5 APAP geometric LS mean ratios and 90% CIs for comparison of ER OC/APAP (two tablets, 15 mg OC/650 mg APAP) under fed and fasted conditions |
Similar to OC, APAP was rapidly absorbed under the fasted condition, with no lag in time to measurable plasma concentration (Table 4). Administration of ER OC/APAP with a low-fat meal resulted in a slight but statistically significant median tlag of 15 minutes for APAP compared with fasted conditions (P<0.001). The median tmax of APAP was statistically significantly delayed by 1.5 hours with meals versus times measured for the fasted state (P<0.001 for both fed conditions). Similar to what was observed with OC, a modest but statistically significant decrease was observed with the t1/2 of APAP under both fed conditions compared with the fasted condition (P<0.001).
Safety and tolerability
Of the 48 participants evaluated in the safety analysis, 33 (68.8%) reported one or more AEs (Table 6). The most frequently reported AEs were nausea (21 participants; 43.8%), vomiting (15 participants; 31.3%), and dizziness (ten participants; 20.8%). Although no statistical comparisons were performed, there were no notable differences between treatment conditions regarding these events. Seventeen (35.4%) participants experienced AEs rated by the investigators as mild, and 16 (33.3%) experienced AEs rated as moderate in intensity. There were no severe AEs, serious AEs, or deaths. All AEs resolved after discontinuation of treatment.
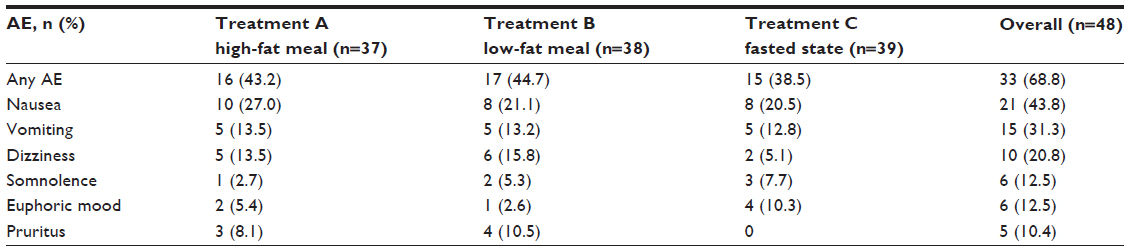 | Table 6 Treatment-emergent AEs in all participants receiving one or more doses (two tablets, 15 mg OC/650 mg APAP) of ER OC/APAP |
Most of the individual hematology and serum chemistry values were within the normal range, and no clinically significant trends in changes were apparent. One participant had an abnormal urine analysis (elevated white blood cells) during the third period (high-fat fed condition) that was considered by the investigator to be mild and unlikely related to study medication. There were no clinically significant trends or changes in mean values for vital signs, pulse oximetry, or ECGs over the assessment period.
Discussion
Results from this study illustrate that the total OC and APAP exposures (AUC) from ER OC/APAP were not significantly affected by food. AUC0–inf and AUC0–t were nearly identical under both the high- and low-fat fed conditions. For all AUC comparisons, the 90% CIs of LS mean ratios were contained completely within the predefined no-effect ranges, indicating no statistical differences in total OC or APAP exposure between fed and fasted states.
Small changes were observed in OC PK measures of Cmax, tmax, and tlag when ER OC/APAP was administered with food. The peak exposures to OC reported under fed high- and low-fat conditions were slightly greater than those reported under fasted conditions (12% and 25%, respectively), although, under high-fat conditions, Cmax was not statistically different from the Cmax in the fasted state. There was a small increase (15 minutes) in lag for absorption of OC in the fed states that reached statistical significance, and the median tmax was delayed by 1 hour in the low-fat fed state and by 2 hours in the high-fat fed state. However, these changes were small and only reached significance for the high-fat condition. Similar to extended-release OC,34 the overall exposure to OC was not considered to be affected in a clinically relevant manner when ER OC/APAP was administered with food.
Small changes in Cmax and tmax of APAP were also observed when ER OC/APAP was administered with food. Cmax decreased by approximately 24% under fed high- and low-fat conditions compared with values for the fasted state, and median tmax was statistically significantly delayed by 1.5 hours under both fed conditions. In addition, median tlag was minimally but statistically significantly increased (at 15 minutes) under low-fat fed conditions. This indicates that the presence of food may slightly decrease and prolong the time to peak exposure of APAP with ER OC/APAP, which is consistent with what has been observed with other APAP formulations.35,36 However, the total systemic exposure to APAP was not affected by food, as AUC0–inf and AUC0–t were comparable between the fed and fasted states, and all three treatments were equivalent according to the predetermined no-effect range.
Although other studies have demonstrated no significant effect of food intake on the PK variables of other ER oral opioid formulations,37,38 as mentioned earlier, fed status and increased fat content of food have been shown to significantly affect the absorption of a formulation of gabapentin (up to twofold increase in AUC0–inf following a high-fat meal) utilizing an ER delivery technology similar to that of ER OC/APAP.31 Acuform® gastric-retentive ER oral delivery technology has been shown to promote gastric retention and control drug delivery. The gabapentin tablet formulation swells up to three to four times in gastric juices, with a diameter larger than that of the pylorus, enabling gastric retention for about 8–9 hours in the fed state.31 Therefore, a comprehensive examination of the effect of food on the PK profile of ER OC/APAP was undertaken to determine if the current study medication might be affected in the same manner. This PK study of ER OC/APAP found that total OC and APAP exposures (AUC) did not significantly differ when ER OC/APAP was administered with or without food, and AUC and Cmax for both OC and APAP were equivalent under high- and low-fat meal states.
Conclusion
Small changes in Cmax were observed for both OC and APAP in fed versus fasted conditions; however, these differences are not expected to be clinically meaningful. ER OC/APAP was generally well tolerated and there was no indication that safety was affected by food. The modest effects on Cmax and the lack of effect of food on overall systemic exposure to OC and APAP, coupled with no changes in safety when administered in a fasted or fed state in this study, support the administration of ER OC/APAP with or without food.
Author contributions
All authors participated in the design of the study and protocol creation, undertook the statistical analysis, contributed to all drafts, and approved the final manuscript for submission.
Acknowledgment
Technical editorial and medical writing support for the development of this manuscript was provided by Lisa Bergstrom, PhD, James Bergstrom, PhD, Traci Stuve, MA (Synchrony Medical Communications, LLC, West Chester, PA), and Robert Gatley, MD, of C4 MedSolutions, LLC, A CHC Group Company, Yardley, PA. Funding for this support was provided by Mallinckrodt Inc., Hazelwood, MO.
Disclosure
Dr Krishna Devarakonda is an employee and stockholder of Mallinckrodt Inc. Ms Rachel Margulis and Drs Terri Morton, Michael Giuliani, and Thomas Barrett are employees of Mallinckrodt Inc., Hazelwood, MO. The authors report no other conflicts of interest in this work.
References
McQuay H, Moore A, Justins D. Treating acute pain in hospital. BMJ. 1997;314(7093):1531–1535. | |
Gatti A, Sabato E, Di Paolo AR, Mammucari M, Sabato AF. Oxycodone/paracetamol: a low-dose synergic combination useful in different types of pain. Clin Drug Investig. 2010;30 Suppl 2:3–14. | |
Gammaitoni AR, Galer BS, Lacouture P, Domingos J, Schlagheck T. Effectiveness and safety of new oxycodone/acetaminophen formulations with reduced acetaminophen for the treatment of low back pain. Pain Med. 2013;4:21–30. | |
Palangio M, Morris E, Doyle RT Jr, Dornseif BE, Valente TJ. Combination hydrocodone and ibuprofen versus combination oxycodone and acetaminophen in the treatment of moderate or severe acute low back pain. Clin Ther. 2002;24(1):87–99. | |
Caldwell JR, Hale ME, Boyd RE, et al. Treatment of osteoarthritis pain with controlled release oxycodone or fixed combination oxycodone plus acetaminophen added to nonsteroidal antiinflammatory drugs: a double blind, randomized, multicenter, placebo controlled trial. J Rheumatol. 1999;26(4):862–869. | |
Corsinovi L, Martinelli E, Fonte G, et al. Efficacy of oxycodone/acetaminophen and codeine/acetaminophen vs conventional therapy in elderly women with persistent, moderate to severe osteoarthritis-related pain. Arch Gerontol Geriatr. 2009;49(3):378–382. | |
Gatti A, Sabato AF, Carucci A, et al. Adequacy assessment of oxycodone/paracetamol (acetaminophen) in multimodal chronic pain: a prospective observational study. Clin Drug Investig. 2009;29 Suppl 1:31–40. | |
Raffaeli W, Pari C, Corvetta A, et al. Oxycodone/acetaminophen at low dosage: an alternative pain treatment for patients with rheumatoid arthritis. J Opioid Manag. 2010;6(1):40–46. | |
Sima L, Fang WX, Wu XM, Li F. Efficacy of oxycodone/paracetamol for patients with bone-cancer pain: a multicenter, randomized, double-blinded, placebo-controlled trial. J Clin Pharm Ther. 2012;37(1):27–31. | |
Gammaitoni AR, Galer BS, Bulloch S, et al. Randomized, double-blind, placebo-controlled comparison of the analgesic efficacy of oxycodone 10 mg/acetaminophen 325 mg versus controlled-release oxycodone 20 mg in postsurgical pain. J Clin Pharmacol. 2003;43(3):296–304. | |
Gaskell H, Derry S, Moore RA, McQuay HJ. Single dose oral oxycodone and oxycodone plus paracetamol (acetaminophen) for acute postoperative pain in adults. Cochrane Database Syst Rev. 2009;(3):CD002763. | |
Korn S, Vassil TC, Kotey PN, Fricke JR Jr. Comparison of rofecoxib and oxycodone plus acetaminophen in the treatment of acute pain: a randomized, double-blind, placebo-controlled study in patients with moderate to severe postoperative pain in the third molar extraction model. Clin Ther. 2004;26(5):769–778. | |
Palangio M, Wideman GL, Keffer M, et al. Combination hydrocodone and ibuprofen versus combination oxycodone and acetaminophen in the treatment of postoperative obstetric or gynecologic pain. Clin Ther. 2000;22(5):600–612. | |
Raffa RB. Pharmacology of oral combination analgesics: rational therapy for pain. J Clin Pharm Ther. 2001;26(4):257–264. | |
Raffa RB, Pergolizzi JV Jr. Multi-mechanistic analgesia for opioid-induced hyperalgesia. J Clin Pharm Ther. 2012;37(2):125–127. | |
Cooper SA, Precheur H, Rauch D, Rosenheck A, Ladov M, Engel J. Evaluation of oxycodone and acetaminophen in treatment of postoperative dental pain. Oral Surg Oral Med Oral Pathol. 1980;50(6):496–501. | |
Beaver WT. Aspirin and acetaminophen as constituents of analgesic combinations. Arch Intern Med. 1981;141(3 Spec No):293–300. | |
Vicodin® (hydrocodone bitartrate and acetaminophen) tablets [prescribing information]. North Chicago: Abbott Laboratories; 2011. | |
Percocet® (oxycodone and acetaminophen) tablets [prescribing information]. Dublin: Endo; 2013. | |
Oxycodone and acetaminophen tablet [prescribing information]. Atlanta: Mikart, Inc.; 2011. | |
Lortab™ 5/500 (hydrocodone bitartrate and acetaminophen) tablets [prescribing information]. Nivelle: UCB, Inc.; GA, 2011. | |
Endcocet® (oxycodone and acetaminophen) tablets [prescribing information]. Dublin: Endo; 2013. | |
Lortab™ 7.5/500 (hydrocodone bitartrate and acetaminophen) tablets [prescribing information]. Nivelle: UCB, Inc.; 2011. | |
Prescription drug products containing acetaminophen: actions to reduce liver injury from unintentional overdose [webpage on the Internet]. Silver Spring: US Food and Drug Administration; 2013. Available from: https://federalregister.gov/a/2011-709. Accessed April 14, 2014. | |
Lugo RA, Kern SE. The pharmacokinetics of oxycodone. J Pain Palliat Care Pharmacother. 2004;18(4):17–30. | |
XARTEMIS™ XR (oxycodone hydrochloride and acetaminophen) extended-release tablets [prescribing information]. Dublin: Mallinckrodt Brand Pharmaceuticals, Inc.; 2014. | |
Devarakonda K, Morton T, Giuliani M, Kostenbader K, Barrett T. Single-dose pharmacokinetics of MNK-795, an extended-release oxycodone and acetaminophen combination analgesic: results from 2 active comparator studies. J Bioequiv Availab. 2014;6:38–45. | |
Devarakonda K, Morton T, Giuliani M, Kostenbader K, Barrett T. Steady-state pharmacokinetics of MNK-795, an extended-release oxycodone and acetaminophen combination analgesic: results from 2 active comparator studies. J Bioequiv Availab. 2014;6:53–60. | |
Acuform® drug delivery [webpage on the Internet]. Newark: Depomed, Inc. Available from: http://depomed.com/technology. Accessed February 28, 2014. | |
Berner B, Cowles VE. Case studies in swelling polymeric gastric retentive tablets. Expert Opin Drug Deliv. 2006;3(4):541–548. | |
Chen C, Cowles VE, Hou E. Pharmacokinetics of gabapentin in a novel gastric-retentive extended-release formulation: comparison with an immediate-release formulation and effect of dose escalation and food. J Clin Pharmacol. 2011;51(3):346–358. | |
Krauss RM, Eckel RH, Howard B, et al. AHA Dietary Guidelines: revision 2000: A statement for healthcare professionals from the Nutrition Committee of the American Heart Association. Circulation. 2000;102(18):2284–2299. | |
Center for Drug Evaluation and Research (CDER). Food-Effect Bioavailability and Fed Bioequivalence Studies. Rockville, MD: US Department of Health and Human Services – Food and Drug Administration; 2002. Available from: http://www.fda.gov/downloads/regulatoryinformation/guidances/ucm126833.pdf. Accessed August 4, 2014. | |
OxyContin® (oxycodone HCl) extended-release tablets [prescribing information]. Stamford: Purdue Pharma LP; 2013. | |
Divoll M, Greenblatt DJ, Ameer B, Abernethy DR. Effect of food on acetaminophen absorption in young and elderly subjects. J Clin Pharmacol. 1982;22(11–12):571–576. | |
Tylenol® (acetaminophen) [prescribing information]. Fort Washington: McNeil Consumer Healthcare; 2010. | |
Johnson F, Ciric S, Boudriau S, Swearingen D, Stauffer J. Food effects on the pharmacokinetics of morphine sulfate and naltrexone hydrochloride extended release capsules. Adv Ther. 2010;27(11):846–858. | |
Kaiko RF, Lazarus H, Cronin C, Grandy R, Thomas G, Goldenheim P. Controlled-release morphine bioavailability (MS Contin tablets) in the presence and absence of food. Hosp J. 1990;6(4):17–30. |
 © 2014 The Author(s). This work is published and licensed by Dove Medical Press Limited. The full terms of this license are available at https://www.dovepress.com/terms.php and incorporate the Creative Commons Attribution - Non Commercial (unported, v3.0) License.
By accessing the work you hereby accept the Terms. Non-commercial uses of the work are permitted without any further permission from Dove Medical Press Limited, provided the work is properly attributed. For permission for commercial use of this work, please see paragraphs 4.2 and 5 of our Terms.
© 2014 The Author(s). This work is published and licensed by Dove Medical Press Limited. The full terms of this license are available at https://www.dovepress.com/terms.php and incorporate the Creative Commons Attribution - Non Commercial (unported, v3.0) License.
By accessing the work you hereby accept the Terms. Non-commercial uses of the work are permitted without any further permission from Dove Medical Press Limited, provided the work is properly attributed. For permission for commercial use of this work, please see paragraphs 4.2 and 5 of our Terms.