")
Back to Journals » International Journal of Nanomedicine » Volume 9 » Issue 1
Osteogenic activity of titanium surfaces with nanonetwork structures
Authors Xing H, Komasa S, Taguchi Y, Sekino T, Okazaki J
Received 30 November 2013
Accepted for publication 10 January 2014
Published 5 April 2014 Volume 2014:9(1) Pages 1741—1755
DOI https://doi.org/10.2147/IJN.S58502
Checked for plagiarism Yes
Review by Single anonymous peer review
Peer reviewer comments 3
This paper is retracted.
Helin Xing, 1,2 Satoshi Komasa, 3 Yoichiro Taguchi, 4 Tohru Sekino, 5 Joji Okazaki 3
1Department of Prosthetic Dentistry, School of Stomatology, The Fourth Military Medical University, Xi’an, People’s Republic of China; 2Graduate School of Dentistry (Removable Prosthodontics and Occlusion), 3Department of Removable Prosthodontics and Occlusion, 4Department of Periodontology, Osaka Dental University, Hirakata, Osaka, Japan; 5Institute of Multidisciplinary Research for Advanced Materials, Tohoku University, Aoba-ku, Sendai, Japan
Background: Titanium surfaces play an important role in affecting osseointegration of dental implants. Previous studies have shown that the titania nanotube promotes osseointegration by enhancing osteogenic differentiation. Only relatively recently have the effects of titanium surfaces with other nanostructures on osteogenic differentiation been investigated.
Methods: In this study, we used NaOH solutions with concentrations of 2.5, 5.0, 7.5, 10.0, and 12.5 M to develop a simple and useful titanium surface modification that introduces the nanonetwork structures with titania nanosheet (TNS) nanofeatures to the surface of titanium disks. The effects of such a modified nanonetwork structure, with different alkaline concentrations on the osteogenic differentiation of rat bone marrow mesenchymal stem cells (BMMSCs), were evaluated.
Results: The nanonetwork structures with TNS nanofeatures induced by alkali etching markedly enhanced BMMSC functions of cell adhesion and osteogenesis-related gene expression, and other cell behaviors such as proliferation, alkaline phosphatase activity, extracellular matrix deposition, and mineralization were also significantly increased. These effects were most pronounced when the concentration of NaOH was 10.0 M.
Conclusion: The results suggest that nanonetwork structures with TNS nanofeatures improved BMMSC proliferation and induced BMMSC osteogenic differentiation. In addition, the surfaces formed with 10.0 M NaOH suggest the potential to improve the clinical performance of dental implants.
Keywords: nanotopography, osseointegration, surface modification, bone marrow mesenchymal stem cells
Introduction
Titanium and its alloys have been widely used as endosseous dental implant materials in the past decade because of their mechanical strength, stability, and good biocompatibility.1,2 Implant surfaces play an important role in affecting osseointegration.3–6 Many studies have focused on the osseointegration process, and it is now described at both the histological and cellular levels. Previous work has shown that surface characteristics such as roughness,7–9 wettability,10–14 and surface structures15–17 significantly influence cell differentiation and, as a consequence, osseointegration.16,18 Bone marrow mesenchymal stem cells (BMMSCs) are multipotent stem cells and represent a particularly attractive source for tissue engineering. BMMSCs are the first cells to colonize the biomaterial surface after implantation and are associated with osteogenic differentiation capacity. BMMSCs have been used in numerous studies as a source of osteogenic cells for bone repair.19,20
Several investigations have implied that the implant surface, the nanoscale topographic control of cell behavior, or the combination of nanofeatures can improve the osseointegration process21–23 and influence differentiation of BMMSCs into osteoblasts.19,20 There are numerous ways that the implant surface can be modified to have nanoscale features added to these surfaces in combination. The most common are chemical processes such as alkaline hydrothermal20,24,25 or acid6,15,17,22 oxidation on titanium surfaces to create different nanoscale topographies. Among the common surface nanotopographies, the titania nanotube has drawn much attention. The materials can be fabricated easily by simple and economic anodizing, and the nanotube dimensions can be precisely controlled.6,19,23,26 Recently, other nanofeatures have emerged as a new class of nanoscales because of their physical and chemical properties. Because of some advantages such as appropriate crystallization temperature, environmental friendliness, controllability of reaction conditions, low energy consumption, and low cost, the hydrothermal method has been considered a suitable synthetic route.27–29 However, relatively few studies have examined the in vitro bioactivity of a titanium surface with these nanofeatures.
We recently reported that treatment of titanium specimens in 10 M aqueous NaOH solution and atmospheric pressure for 24 hours yielded titania nanosheet (TNS).30 The nanotopography of nanonetwork structures with TNS nanofeatures is affected by temperature, treatment time, and alkaline concentration.20,31–33 The objectives of the present study were twofold: first, we aimed to investigate the changes in TNS, such as roughness, wettability, and surface structure induced by various alkaline concentrations (2.5, 5.0, 7.5, 10.0, and 12.5 M), and second, we aimed to evaluate the influence of such modified nanonetwork structures with TNS nanofeatures, with different alkaline concentrations, on the osteogenic differentiation of rat BMMSCs. To the best of our knowledge, this is the first study to evaluate the effects of titanium surfaces with nanonetwork structures formed by various alkali concentrations at room temperature on osteogenic differentiation. We investigated the effect of various conditions on the nanonetwork structures with TNS nanofeatures. We also investigated the changes in the surfaces over time. We hope these results will be useful and significant references for determining the mesenchymal stem cell–nanostructure relationship and the design of endosseous dental implant surfaces.
Materials and methods
Specimen preparation
Titanium disks (15 mm in diameter and 1 mm thick) of grade 2 commercially pure titanium were prepared by machining (Daido Steel, Osaka, Japan). After ultrasonic cleaning, these disks were immersed in aqueous NaOH solutions predominantly dissolves only in water with concentrations of 2.5, 5.0, 7.5, 10.0, and 12.5 M and placed in an oil bath maintained at 30°C for 24 hours. Unprocessed titanium disks were used as controls. The solution in each flask was replaced with ion exchange water (200 mL), and this procedure was repeated until the solution reached a conductivity of 5 μS/cm. The specimens were then dried at room temperature. The specimens were named control (CON), 2.5 M, 5.0 M, 7.5 M, 10.0 M, and 12.5 M for the experiments.
Surface characterization
The surface of the specimens was examined by scanning electron microscopy (SEM) (S-4800; Hitachi, Tokyo, Japan) and atomic force microscopy (AFM) (SPM-9600; Shimadzu Tokyo, Japan). Contact angle measurements were carried out by a video contact angle measurement system model VSA 2500 XE (AST Products, Tokyo, Japan) at room temperature. Ultrapure water was used in the contact angle measurements.
Protein adsorption assay
Bovine serum albumin, fraction V (Thermo Fisher Scientific, Waltham, MA, USA), was used as a model protein. Three hundred microliters of protein solution (1 mg/mL protein in saline) was pipetted onto each specimen. After incubation for 1, 3, 6, and 24 hours at 37°C, nonadherent proteins were removed and mixed with bicinchoninic acid (Thermo Fisher Scientific) at 37°C for 1 hour. The amount of the removed albumin, as well as the total amount of albumin inoculated, was quantified using a microplate reader at 562 nm. The rate of albumin adsorption was calculated as the percentage of albumin adsorbed to specimens relative to the total amount.
Cell culture
The animal experiments were conducted in accordance with the Guidelines for Animal Experimentation of Osaka Dental University (approval 13-02039). The rat BMMSCs were obtained from the femurs of 8-week-old Sprague Dawley rats. BMMSCs were maintained in growth medium containing minimal essential medium (Nacalai Tesque Inc., Tokyo, Japan), 10% fetal bovine serum (FBS; Nacalai Tesque Inc.), and antibiotic-antimycotic mixed stock solution (Nacalai Tesque Inc.) and cultured in a humidified atmosphere with 5% CO2 at 37°C. After 3 days, the medium was replaced with the nonadherent cells removed, and thereafter the medium was changed every 3 days. When the culture grew to about 80% confluence, the BMMSCs were trypsinized, using 0.5 g/L trypsin and 0.53 mmol/L ethylenediaminetetraacetic acid (Nacalai Tesque Inc.), and were seeded on specimens at a density of 4 × 10⁴ cells/cm2. The medium was removed and replaced with differentiation medium containing 10% FBS, antibiotic–antimycotic mixed stock solution, and osteogenic supplements: 10 mM β-glycerophosphate (Wako Pure Chemical Industries, Osaka, Japan), ascorbic acid (Nacalai Tesque Inc.), and 10 nM dexamethasone (Nacalai Tesque Inc.). This differentiation medium was changed every 3 days.
Cell adhesion
Rat BMMSCs were seeded on the specimens at a density of 4 × 10⁴ cells/cm2 and allowed to attach for 30 minutes, 1 hour, and 3 hours. At each prescribed time, the nonadherent cells were removed by rinsing with phosphate-buffered saline (PBS). Cells were fixed and stained with 4′,6-diamidino-2-phenylindole (DAPI). The cell numbers in five random fields were counted under an all-in-one fluorescence microscope (BZ-9000; Keyence, Tokyo, Japan) and processed using BZII analysis software (Keyence).
Cell proliferation assay
Cell proliferation was measured using the CellTiter-Blue® Cell Viability Assay (Promega Corporation, Madison, WI, USA) according to the manufacturer’s protocol. Rat BMMSCs were seeded on the specimens at a density of 4 × 10⁴ cells/cm2 and allowed to attach for 1, 3, and 7 days. At each prescribed time, nonadherent cells were removed by rinsing with PBS, and then 50 μL CellTiter-Blue® Reagent and 250 μL PBS were added to each well. After 1 hour incubation at 37°C, the solution was removed from the 24-well tissue culture plates (Falcon), and 100 μL was added to a new 96-well tissue culture plate (Falcon). Fluorescence was recorded at 560/590 nm, using a 96-well microplate reader (SpectraMax M5; Molecular Devices LLC, Sunnyvale, CA, USA). The difference in the two optical densities was defined as the proliferation value.
Cell morphology
Rat BMMSCs were seeded on specimens at a density of 4 × 10⁴ cells/cm2. After 30 minutes, 1 hour, 3 hours, and 3 days of incubation, the specimens with attached cells were washed with PBS, fixed in 4% glutaraldehyde, and dehydrated in a graded ethanol series. The samples were dried in a critical point dryer (HCP-1; Hitachi). A 10 nM thick gold-palladium layer was deposited on the samples by ion sputtering (E-1030; Hitachi). The morphology of the cells attached to the specimen surface was visualized by SEM (S-4800; Hitachi).
Alkaline phosphatase staining and activity
Rat BMMSCs were seeded on each specimen at a density of 4 × 10⁴ cells/cm2. After culturing for 1 and 2 weeks, the cells were washed and fixed, and alkaline phosphatase (ALP) staining was performed with the 5-bromo-4-chloro-3′-indolyphosphate/nitro-blue tetrazolium (BCIP/NBT) alkaline phosphatase color development substrate (Promega Corporation) for 15 minutes. For every 5 mL alkaline phosphatase buffer (100 mM Tris-HCl at pH 9.0, 150 mM NaCl, 1 mM MgCl2), we added 33 μL NBT and 16.5 μL BCIP. We added the NBT first, mixed the solution, added the BCIP, and mixed again. ALP activity of rat BMMSCs was examined at 1 and 2 weeks, using the Amplite™ Luminometric Alkaline Phosphatase enzyme-linked immunosorbent assay (ELISA) kit (Sigma-Aldrich, St Louis, MO, USA). Nonadherent cells were removed by rinsing with PBS and rat BMMSCs lysed with 200 μL 0.2% Triton X-100 (Sigma-Aldrich), and the lysate was transferred to a microcentrifuge tube containing a 5 mm hardened steel ball. Tubes were agitated on a shaker (Mixer Mill type MM 301; Retsh, Haan, Germany) at 29 Hz for 20 seconds to homogenize the sample. The reaction was terminated with aqueous NaOH solutions from 3 to 0.5 M. ALP activity was evaluated as the amount of p-nitrophenol released through the enzymatic reaction and measured at 405 nm, using a 96-well microplate reader (SpectraMax M5; Molecular Devices, LLC).
Extracellular matrix mineralization
Extracellular matrix (ECM) mineralization by rat BMMSCs was evaluated by Alizarin Red staining.22 After culturing for 3 and 4 weeks, the cells were washed three times with PBS, fixed in cold 70% ethanol for 20 minutes, and washed with ultrapure water for 3 minutes. The cell cultures were stained with Alizarin Red for 10 minutes at room temperature. Cell monolayers were washed with distilled water until no more color appeared, and images were acquired. Calcium deposited in the ECM was measured after dissolution with 10% formic acid. The amount of calcium was quantified using a Calcium E-test Kit (Wako Pure Chemical Industries, Ltd). After 3 and 4 weeks of culture, 1 mL calcium emission test reagent and 2 mL kit buffer were added to 50 μL of collected medium, and the absorbance of the reaction products was measured at 610 nm using a 96-well microplate reader (SpectraMax M5). The concentration of calcium ions was calculated from the absorbance value relative to a standard curve.
Osteocalcin ELISA
The sandwich enzyme immunoassay used in this study was specific for rat osteocalcin and measured its levels directly in cell culture supernatant after 3 and 4 weeks of culture, using a commercially available ELISA (Rat Osteocalcin ELISA Kit DS; DS Pharma Biomedical Co, Ltd, Osaka, Japan), according to the manufacturer’s instructions.
Osteogenesis-related gene expression
Expression of osteogenesis-related genes was evaluated using the real-time TaqMan RT PCR assay (Life Technologies, Carlsbad, CA, USA). Rat BMMSCs were seeded with 4 × 10⁴ cells/cm2 and cultured for 3 and 7 days. Total RNA was isolated using the RNeasy® Mini Kit (Qiagen, Venlo, the Netherlands). Ten microliters of RNA from each sample were reversed transcribed into cDNA, using the PrimeScript™ RT Reagent Kit (TaKaRa, Shiga, Japan). Expression of osteogenesis-related genes including bone sialoprotein (BSP), osteonectin (ON), runt-related transcription factor 2 (RUNX2), and collagen type 1 (COL-1) was quantified using the StepOne™ Plus Real-Time PCR System (Life Technologies). In a MicroAmp® Fast Optical 96-well Reaction Plate (0.1 mL well volume; Life Technologies), 5 μL TaqMan® Fast Universal PCR Master Mix, 1 μL of the primer probe set (20× Taqman Gene Expression Assays: applera ordering number: Rss330360-m1Gadphs, Rss351515-m1Ibasp, Rss302733-Sparc, Rss339198-m1runx2, Rss354847-m1col1a1), 1 μL sample cDNA, and 3 μL DEPC water (Nippongene) were added to each well. The plate was subjected to 40 reaction cycles of 95°C for 1 second and 60°C for 20 seconds. The reactive gene expression rate was calculated using the ΔΔCt method34 in each group, assuming the gene expression rate of the negative control group.
Statistical analysis
The data were analyzed using SPSS 19.0 software (IBM Corporation, Armonk, NY, USA). One-way analysis of variance followed by a Student–Newman–Keuls post hoc test was used to determine the level of significance. A value of P<0.05 was considered to be significant, and P<0.01 was considered to be highly significant.
Results
Surface properties of specimens
Figure 1 shows the surface views of the control and experimental group specimens (2.5, 5.0, 7.5, 10.0, and 12.5 M NaOH). Similar porous network structures were formed by the alkali treatment. The high-magnification SEM images show details of the TNS self-organization into a porous network structure. The dimension of the porous network structures became smaller from 2.5 to 10.0 M NaOH. However, the porous network structures were nonhomogeneous with 12.5 M NaOH. AFM also showed a similar appearance (Figure 1 a3–f3), with uniform roughness (Ra, average roughness; Rz, maximum height) (Table 1).
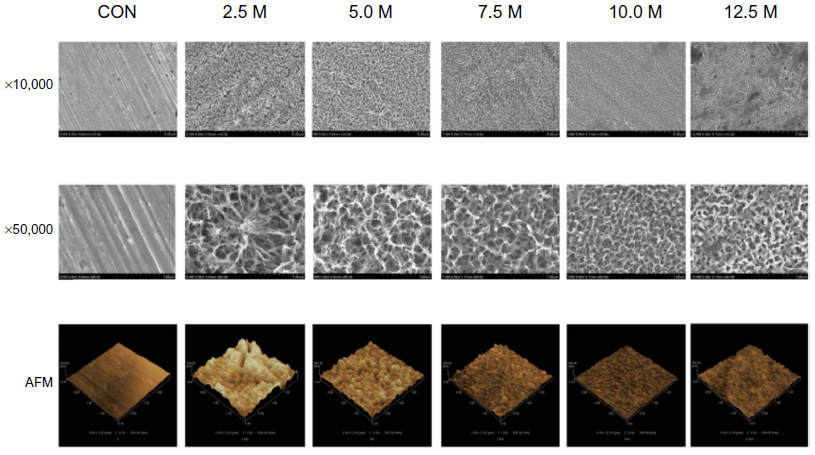 | Figure 1 Scanning electron micrographs after treatment with various concentrations of NaOH and AFM of specimen surfaces. |
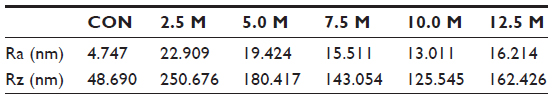 | Table 1 Surfaces of various specimens formed under various alkali concentrations (NaOH) |
The contact angles of the control and experimental group specimens (2.5, 5.0, 7.5, 10.0, and 12.5 M NaOH) are shown in Figure 2. The alkali-treated specimens exhibited superhydrophilicity compared with the control specimens. In addition, the contact angles of the alkali-treated specimens gradually diminished from 40° to 6° with increasing alkali concentrations, with the exception of 12.5 M NaOH.
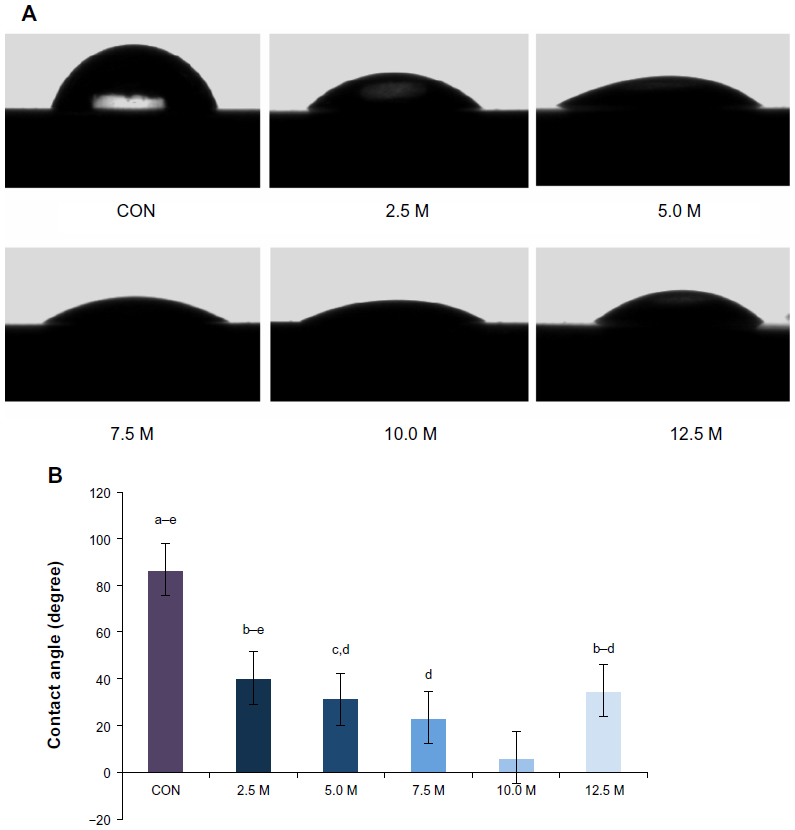 | Figure 2 Contact angle measurements of ultrapure water droplets pipetted on specimens. (A) Optical images. (B) Quantitative degree results. |
Protein adsorption
The amount of protein adsorbed on the surface from bovine serum albumin after 1, 3, 6, and 24 hours incubation was assayed (Figure 3). More protein was adsorbed onto the alkali-treated specimens than the control specimens, which increased with the alkali concentrations, with the exception of 12.5 M NaOH.
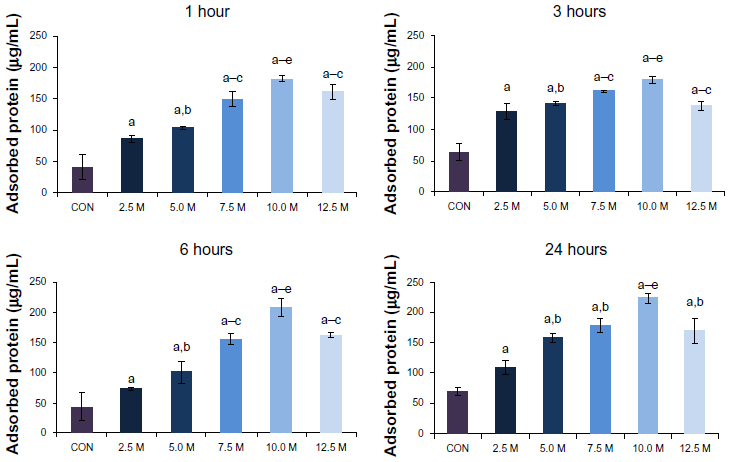 | Figure 3 Assay of protein adsorption to different specimens after 1, 3, 6, and 24 hours incubation in bovine serum albumin. |
Cell adhesion
Cell adhesion on the specimens during the first 3 hours of incubation is shown in Figure 4. At each interval, the numbers of adherent cells on alkali-treated specimens were higher than on the control specimens. The cell numbers on alkali-treated specimens clearly increased with alkali concentration after incubation for 30 minutes, 1 hour, and 3 hours. However, cell adhesion on the specimens treated with 12.5 M NaOH was lower than that on the surfaces treated with 10.0 M NaOH.
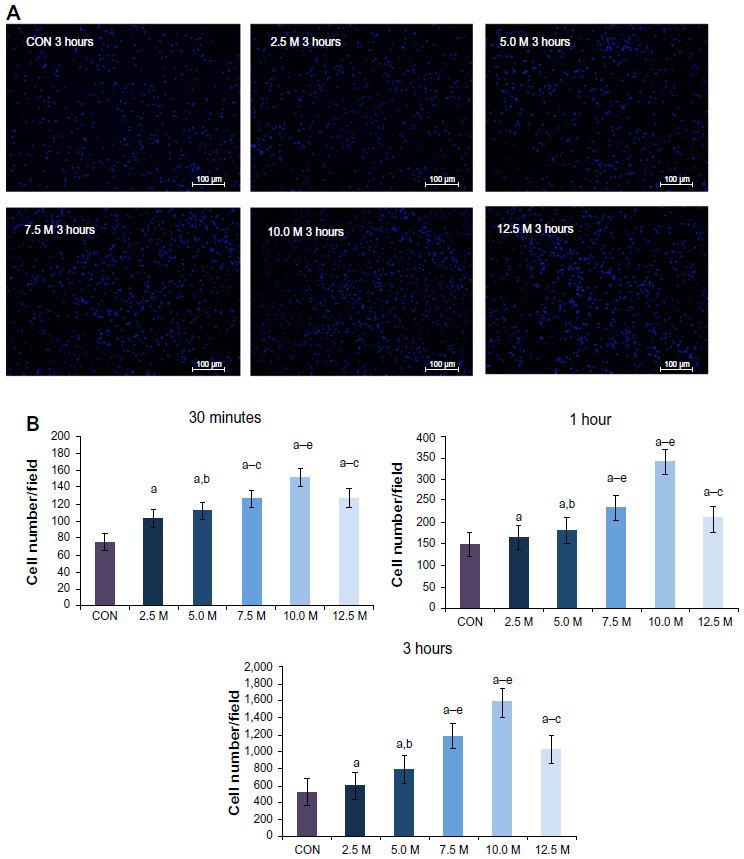 | Figure 4 Initial number of adherent BMMSCs, measured by counting cells stained with DAPI under a fluorescence microscope after 30 minutes, 1 hour, and 3 hours incubation. (A) Fluorescence images of cells attached after 3 hours incubation. (B) Quantitative results of initial number of adherent BMMSCs. |
Cell proliferation
Cell proliferation on the specimens during the first 3 days of incubation was assessed (Figure 5). There were significant differences between alkali-treated and control specimens at 1, 3, and 7 days. In addition, the highest proliferation at each time point was at a concentration of 10.0 M NaOH.
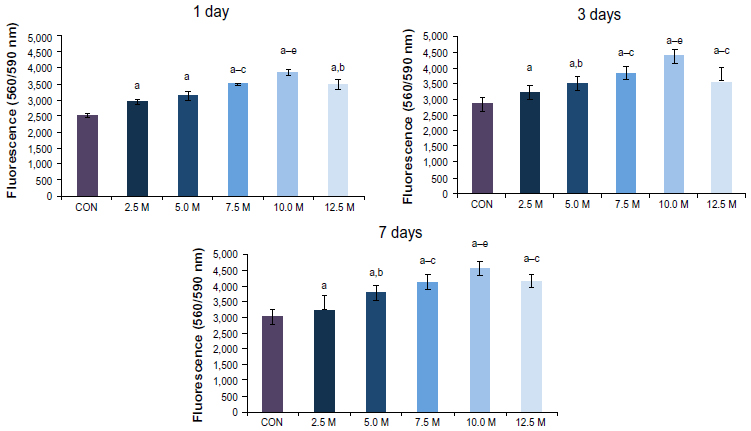 | Figure 5 Cell proliferation on samples after 1, 3, and 7 days of incubation, measured by the CellTiter-Blue® Cell Viability Assay. |
Cell morphology
The morphology of rat BMMSCs attaching to the surface of the specimens was observed after 30 minutes, 1 hour, 3 hours, and 3 days of culture (Figure 6). For short time culture of 30 minutes, 1 hour, and 3 hours (Figure 6A–C, respectively), the BMMSCs showed a similar elliptical shape; however, the filopodia appeared noticeably different. The BMMSCs did not acquire any filopodia in the control group when cultured for 30 minutes (Figure 6A). The quantity and length of filopodia increased with alkali concentration. When the culture time was increased to 1 hour (Figure 6B) and 3 hours (Figure 6C), the shape of the BMMSCs also changed to a more elongated shape. When cultured for a long time (3 days), the BMMSCs showed markedly different shapes related to specimen topography (Figure 6D). BMMSCs in the control group displayed a spindle shape and developed less distinct lamellipodia, which was indicative of undifferentiated BMMSCs. In contrast, the cells on surfaces treated with 2.5, 5.0, 7.5, 10.0, and 12.5 M NaOH displayed a stellate cell shape with well-developed, highly spread lamellipodia.
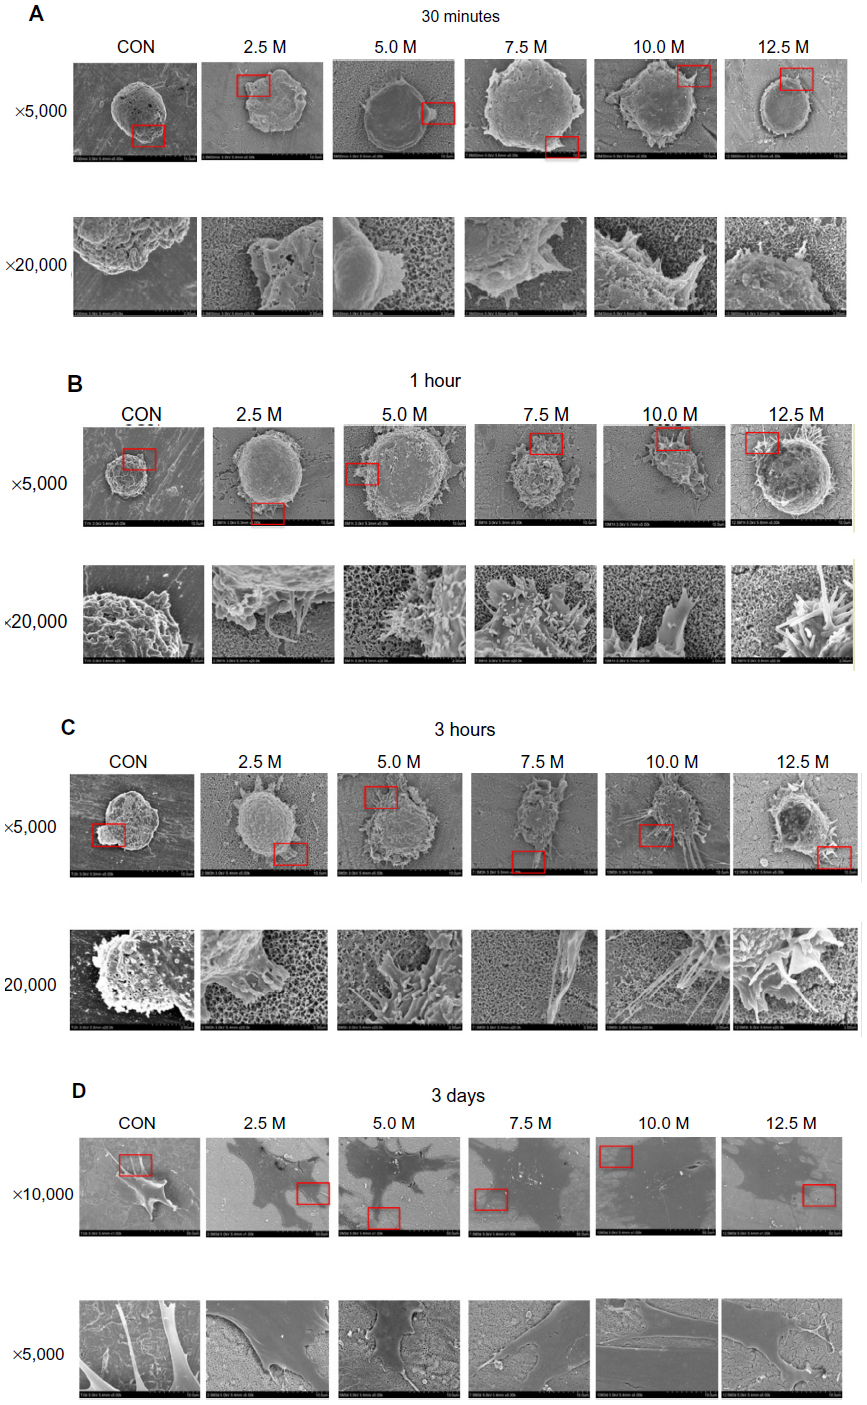 | Figure 6 Scanning electron micrographs of cells after 30 minutes (A), 1 hour (B), 3 hours (C), and 3 days (D) culture. |
ALP staining and intracellular ALP activity
As shown in Figure 7A and B, ALP production in the BMMSCs on all the substrates occurred as early as 1 week after incubation and increased with time. There were significant differences in ALP production among different specimens at each time. Intracellular ALP activity after 1 and 2 weeks of culture was in accordance with the ALP staining results (Figure 7C), showing obvious differences in ALP activity among different specimens.
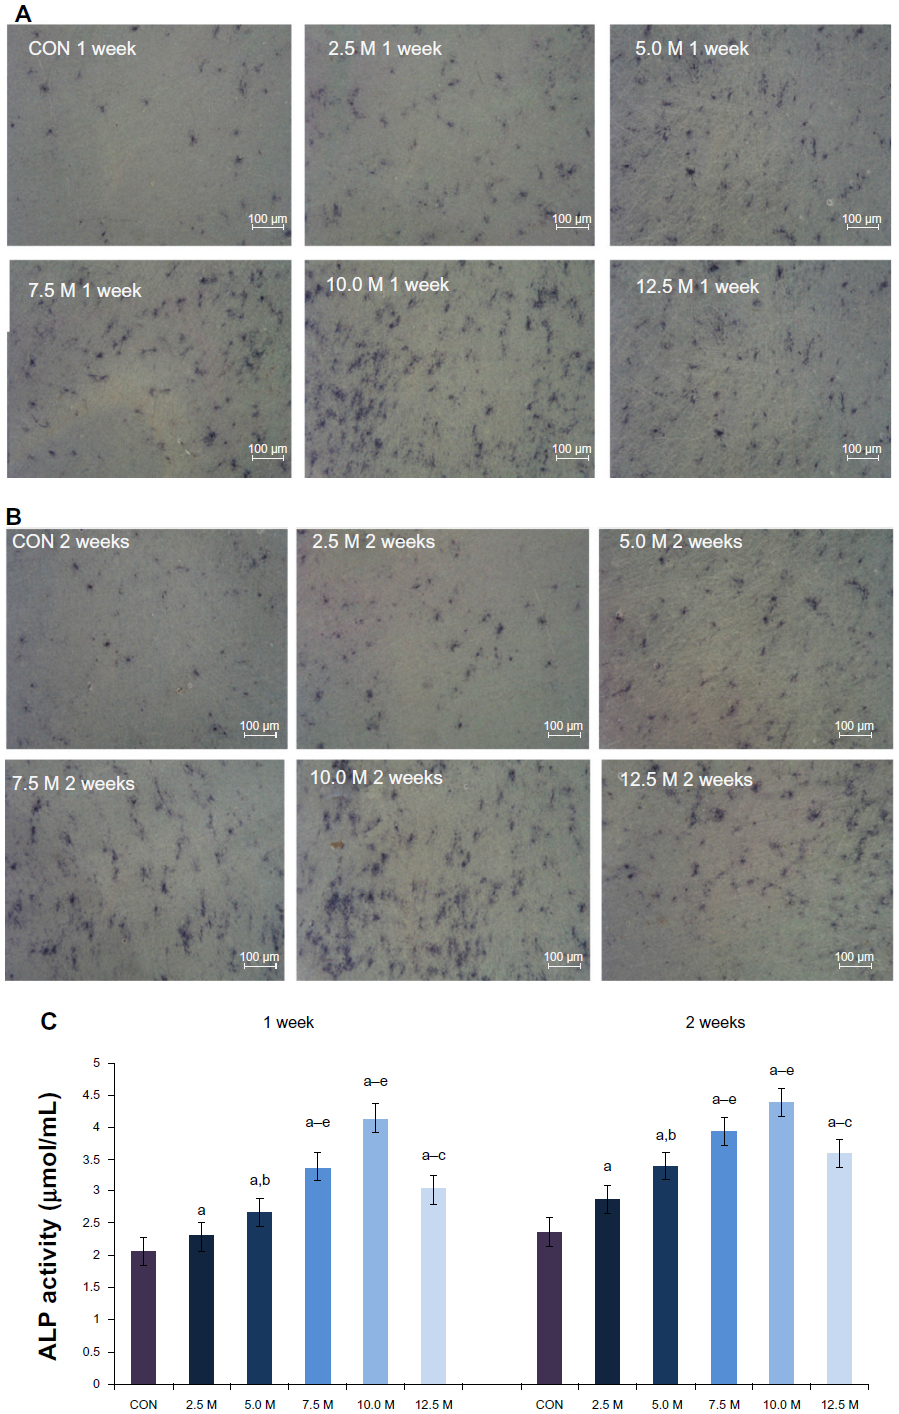 | Figure 7 Alkaline phosphatase staining of mesenchymal stem cells after 1 week (A) and 2 weeks (B) culture. Alkaline phosphatase activity of mesenchymal stem cells on different samples cultured for 1 and 2 weeks (C). |
ECM mineralization
ECM mineralization was assessed by Alizarin Red staining (Figure 8A and B). In the control cells, there were small mineralization dots (Figure 8A and B). However, 2.5, 5.0, 7.5, 10.0, and 12.5 M NaOH induced abundant mineralization nodules that were larger than those in the control group. In addition, the mineralization dots differed in appearance according to the concentration of NaOH (Figure 8-1). Calcium deposition demonstrated that the ECM mineralization levels in surfaces treated with 2.5, 5.0, 7.5, 10.0, and 12.5 M NaOH were significantly higher than in the control group (Figure 8C).
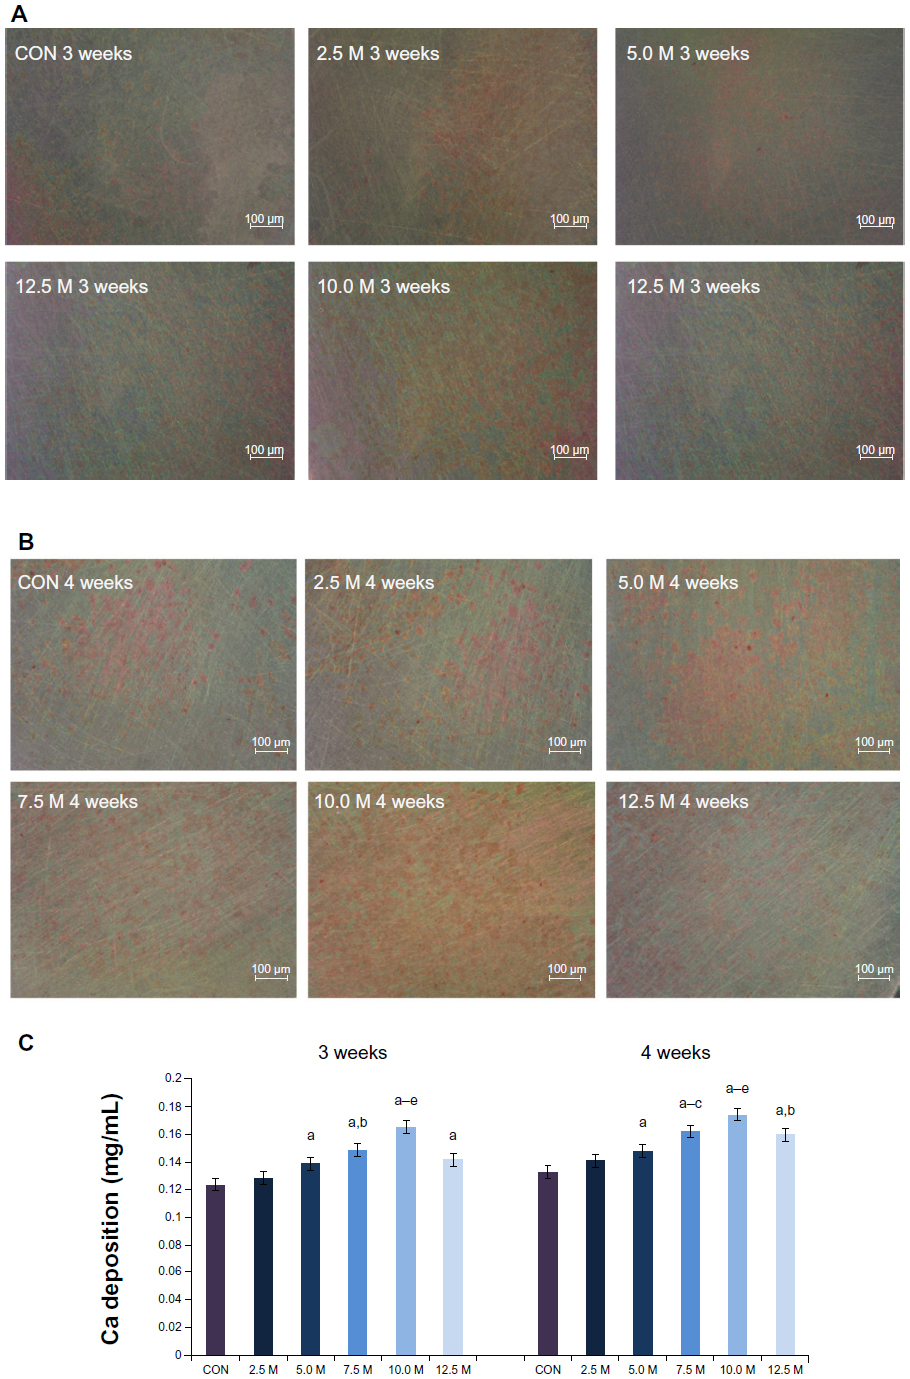 | Figure 8 Extracellular matrix mineralization on different samples after 3 weeks (A) and 4 weeks (B) culture of mesenchymal stem cells. (C) Quantitative results of calcium deposition. |
Osteocalcin production
The presence of osteocalcin in the supernatant of specimens after 3 and 4 weeks’ culture is shown in Figure 9. Osteocalcin production differed significantly between the control and experimental specimens and increased with NaOH concentration from 2.5-10.0 M. In addition, osteocalcin production increased with culture time.
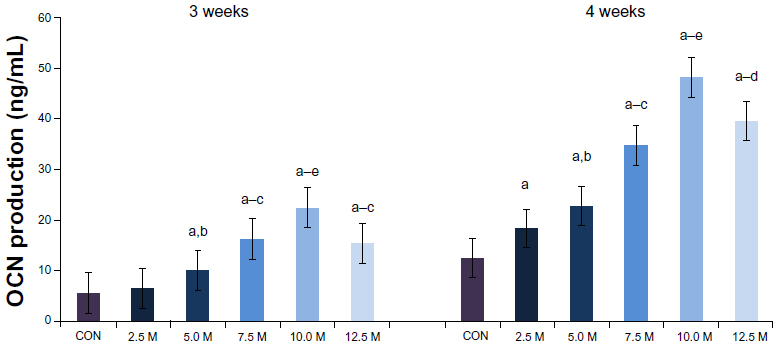 | Figure 9 OCN production after 3 and 4 weeks of culture, as measured by sandwich enzyme immunoassay. |
Gene expression
The expression levels of osteogenesis-related genes, including BSP, ON, RUNX2, and COL-1, were assessed by quantitative RT-PCR (Figure 10). The similar topographies explored in this study induced different gene expression levels at 3 and 7 days. In general, alkali-treated specimens induced higher mRNA levels than the controls. The NaOH concentration of 10.0 M induced the highest mRNA levels for all the osteogenesis-related genes.
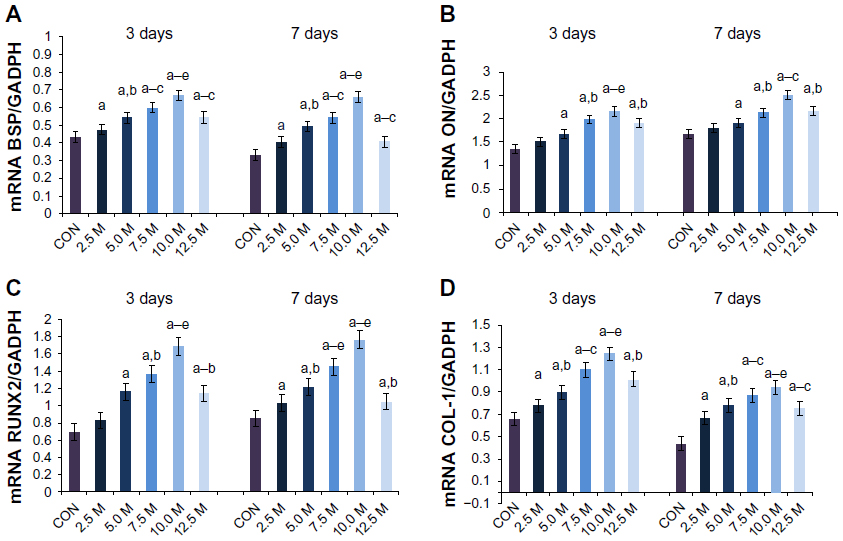 | Figure 10 Gene expression in primary osteoblasts cultured on titanium surfaces after incubation for 3 and 7 days: (A) BSP, (B) ON, (C) RUNX2, and (D) COL-1. Data were generated by real-time polymerase chain reaction and are shown as mean ± standard deviation expression relative to GADPH. |
Discussion
In this study, titanium was treated with various concentrations of NaOH at room temperature and atmospheric pressure for 24 hours to obtain the nanonetwork structures with TNS nanofeatures (as revealed by SEM and AFM) in the absence or presence of different nanoscale roughness and different sizes of porous network structures The nanonetwork structures with TNS nanofeatures affected wettability (as revealed by water contact angle measurements) and protein adsorption. Moreover, BMMSCs behavior was sensitive to the modified surfaces.
Our results demonstrate that the experimental group became more hydrophilic and exhibited markedly improved wettability. A better understanding of the surface roughness and topography of modified titanium surfaces is a basic requirement for the discussion of wettability.14 Ra and Rz are widespread and are often solely used as height parameters to describe implant surface roughness.35 The Ra and Rz of the experimental specimens became smaller from 2.5-10.0 M NaOH but increased with 12.5 M NaOH (Table 1). With a similar tendency, the contact angles of the alkali-treated specimens gradually diminished from 40° to 6° with increasing alkali concentration but increased up to 35° in the 12.5 M NaOH group (Figure 2B), which suggested that the wettability on the surface of the experimental specimens declined from 2.5–10.0 M but increased from 10.0–12.5 M NaOH. The high-magnification SEM images (Figure 1) also showed that similar homogeneous porous network structures were distributed in each experimental group and that the size of the structures decreased with increasing alkali concentration. However, the homogeneous porous network structures were not well distributed in the 12.5 M NaOH group. This agrees with previous studies, which showed that the liquid sank into the porous TiO2 matrix and the degree of contact angle decreased.13 For reliable surface characterization, parameters describing surface variation in the spatial direction are also needed36. Thus, three-dimensional assessment of surface topography is becoming more widely appreciated. AFM three-dimensional images (Figure 2) showed that the nanoscale agglomerates were large when the NaOH concentration was low.29 In addition, a concentration of 12.5 M NaOH was too high to obtain homogeneous nanoscale agglomerates (Figure 1).
The adsorption of ECM adhesive proteins onto implanted materials is the first essential step in bone tissue response and affects cell adhesion and proliferation.37 The nanoscale surface roughness itself is considered a key factor for enhancing bovine fibronectin adsorption and may induce conformational change of fibronectin on nanoscale titanium surfaces.16 Our work is in agreement with recent studies suggesting that different nanoscale surface roughness shows a different level of adhesive protein adsorption (Figure 3).
BMMSCs were used to model osteoinduction and osteoblastic differentiation in cell cultures performed on different titanium substrates. Adhesion and osteoblastic differentiation under culture conditions, including osteogenic supplements, occurred to a varying degree on the different surfaces.21 Initial cell adhesion is the key step in the ensuing cell proliferation and differentiation on biomaterials.37 As shown in Figure 4, different concentrations of NaOH induced obvious differences in the initial number of adherent cells. After 30 minutes, 1 hour and 3 hours, the greatest number of adherent cells was seen in the specimens treated with 10.0 M NaOH. It has been proposed that filopodia play a role in cell recognition of the nanoscale topography because they protrude from the foremost part of the cell. The role of filopodia in sensing nanoscale topography was recently demonstrated on the 11 nm high islands.38,39 Our results provide additional evidence of this phenomenon. For cells with a surface roughness of 13 nm on surfaces treated with 10.0 M NaOH, SEM images revealed that cells had more filopodia after a short time of culture (Figure 6A–C). They formed more lamellipodia and were wider and thicker after a long period of culture (Figure 6D).
Three stages can be distinguished in osteogenic differentiation: proliferation, matrix development/maturation, and mineralization.40 The proliferative activity of BMMSCs was determined by quantification of cell proliferation (Figure 5), which showed a similar tendency at different times, with the highest level among the 10.0 M NaOH specimens. The transition from proliferation stage to matrix maturation stage was suggested by the upregulation of genes associated with development and maturation, as well as ALP activity. Four osteogenic markers, BSP, ON, RUNX2, and COL-1, were selected to analyze differentiation activities. BSP expression is one indicator of the onset of terminal osteoblastic differentiation.5 Osteonectin, also known as secreted protein acidic and rich in cysteine, is a glycoprotein abundantly expressed in bone undergoing active remodeling.41 RUNX2 is an important transcription factor necessary for osteoblast differentiation and is expressed in the early stages of osteogenic differentiation.42 COL-1 accounts for 90% of the total protein in the organic matrix of bone. It not only provides the structural framework with viscoelastic properties but also defines compartments for ordered mineral deposition.43 The real-time PCR results showed that expression of nearly all the genes was upregulated after alkali treatment and differed significantly with concentration, with the highest expression being in the 10.0 M NaOH specimens (Figure 10). ALP activity variation provides evidence that bone cell differentiation is also affected by nanotopography (Figure 7). Variation in ALP activity was observed after the proliferation period and generally followed adhesion-related cell behavior. The conclusion was that ALP activity was highest on the 10.0 M NaOH specimen surfaces. ALP activity is regarded as a relatively early-stage bone cell phenotype. ALP activity in BMMSCs was detected after a relatively short culture period (1–2 weeks), followed by the later-stage (3–4 weeks) expression of other bone cell phenotypic markers such as osteocalcin. Osteocalcin is a marker of late-stage osteogenic differentiation, and peak expression was seen in the 10.0 M NaOH specimens (Figure 9). Mineralization of BMMSCs as measured by Alizarin Red staining (Figure 8A and B), and calcium deposition (Figure 8C) also reached a maximum on the 10.0 M NaOH specimen surfaces. Calcium accumulation starts at the matrix development stage and reaches its maximum during mineralization.42
In this study, the modeled process of osseointegration could be differentiated as a function of surface topography at the nanoscale level. This study indicates that treatment with alkali results in the nanonetwork structures on the titanium surface, which influence BMMSCs osteogenic differentiation. The topography of the porous network structure reported here may provide insight into future development of titanium implants. Addition of the nanonetwork structures to the titanium surface can promote cell functions, and alkali treatment enhancement of cell adhesion, proliferation, intracellular total protein synthesis, and ALP activity may lead to faster bone maturation around the implant, probably inducing better osseointegration. Moreover, the later-stage (3–4 weeks) expression of MSCs and osteocalcin also increased after alkali treatment. A NaOH concentration of 10.0 M provided the most favorable environment for osteogenic differentiation of BMMSCs. This indicates that bone cell differentiation was largely controlled by the nanoscale microenvironment. The results presented here are consistent with our hypothesis that modified nanonetwork structure surface topography, with different alkaline concentrations, affects the osteogenic differentiation of rat BMMSCs, which gives them different nanoscale surface topography and surface roughness and wettability. Several studies have also shown that hydrophilic surfaces are necessary for biomaterial tissue integration.15 Other recent studies have shown that the size and characteristics of the features may be more important than the effects of chemical composition alone.17 Therefore, nanoscale features play an important role in osteogenic differentiation.
Some researchers showed that using an H2O2 process, fabricated two size-controllable sawtooth-like nanostructures with different dimensions on a titanium surface. The proliferation and osteogenic differentiation abilities of rat BMMSCs were different when cultured on surfaces with different dimensions of nano sawtooth structure.20 As shown in the SEM images, the dimensions of the nanonetwork were changed among experiment groups. In another study, samples called subnano, nano-, and submicron, with an average nanoscale surface Ra of 0.645, 3.85, and 13.37 nm, respectively, also showed the effects of Ra on cell behavior. The critical transcription factor genes regulating osteoblast differentiation (RUNX2, Osterix, and Dlx5) and osteoblast phenotype genes (COL, BSP, osteopontin, and osteocalcin) were notably increased in cells grown on nano-submicron surfaces compared with those grown on subnanoscale and nano-titanium surfaces. Early cellular adhesion and proliferation were significantly higher in the nano and nano-submicron hybrid surfaces compared with the subnanoscale surface. The expression levels of osteoblast phenotype genes (osteonectin, osteopontin, and osteocalcin) increased in cells grown on nano-submicron hybrid surface features compared with those grown on subnanoscale and nano-titanium surfaces at 21 days of cell differentiation.16
Conclusion
Using a nanonetwork topography model that mimics biomineralized matrices, the present study examined the effects of adding the nanonetwork structures with TNS nanofeatures to the surface of titanium. Rat BMMSCs were cultured on untreated titanium disks and on those treated with 2.5, 5.0, 7.5, 10.0, and 12.5 M NaOH. The nanonetwork structures with TNS nanofeatures induced by alkali etching markedly enhanced BMMSCs’ functions of cell adhesion and osteogenesis-related gene expression, and other cell behaviors such as proliferation, ALP activity, and ECM deposition and mineralizations were also significantly improved. These effects were most pronounced when the concentration of NaOH was 10.0 M. Our results show that nanonetwork structures with TNS nanofeature can support BMMSC proliferation and induce osteogenic differentiation. In particular, results obtained with 10.0 M NaOH suggest great potential in improving the clinical performance of bone implants.
Acknowledgments
This work was supported by Grant-in-Aid for Scientific Research (24592942, 24792345) from the Japan Society for the Promotion of Science. We thank Professor Shoji Takada, Department of Biomaterials, Osaka Dental University, Japan, for his valuable discussion. We also thank Mr H Hori from the Central Institute of Dental Research, Osaka Dental University, Japan, for his kind help on experimental technique.
Disclosure
The authors report no conflicts of interest in this work.
References
Rosa MB, Albrektsson T, Francischone CE, Schwartz Filho HO, Wennerberg A. The influence of surface treatment on the implant roughness pattern. J Appl Oral Sci. 2012;20(5):550–555. | |
Meulen Pv, Linden Wv, Eeden Rv. Optimal restoration of dental esthetics and function with advanced implant-supported prostheses: a clinical report. J Prosthodont. 2012;21(5):393–399. | |
Nanci A, Wuest JD, Peru L, et al. Chemical modification of titanium surfaces for covalent attachment of biological molecules. J Biomed Mater Res. 1998;40(2):324–335. | |
Buser D, Broggini N, Wieland M, et al. Enhanced bone apposition to a chemically modified SLA titanium surface. J Dent Res. 2004;83(7):529–533. | |
Guo J, Padilla RJ, Ambrose W, De Kok IJ, Cooper LF. The effect of hydrofluoric acid treatment of TiO2 grit blasted titanium implants on adherent osteoblast gene expression in vitro and in vivo. Biomaterials. 2007;28(36):5418–5425. | |
Zhao L, Liu L, Wu Z, Zhang Y, Chu PK. Effects of micropitted/nanotubular titania topographies on bone mesenchymal stem cell osteogenic differentiation. Biomaterials. 2012;33(9):2629–2641. | |
Eisenbarth E, Velten D, Breme J. Biomimetic implant coatings. Biomol Eng. 2007;24(1):27–32. | |
Ogawa T, Nishimura I. Different bone integration profiles of turned and acid-etched implants associated with modulated expression of extracellular matrix genes. Int J Oral Maxillofac Implants. 2003;18(2):200–210. | |
Deligianni DD, Katsala N, Ladas S, Sotiropoulou D, Amedee J, Missirlis YF. Effect of surface roughness of the titanium alloy Ti-6Al-4V on human bone marrow cell response and on protein adsorption. Biomaterials. 2001;22(11):1241–1251. | |
Lampin M, Warocquier-Clérout R, Legris C, Degrange M, Sigot-Luizard MF. Correlation between substratum roughness and wettability, cell adhesion, and cell migration. J Biomed Mater Res. 1997;36(1):99–108. | |
Liao H, Andersson AS, Sutherland D, Petronis S, Kasemo B, Thomsen P. Response of rat osteoblast-like cells to microstructured model surfaces in vitro. Biomaterials. 2003;24(4):649–654. | |
Rupp F, Scheideler L, Olshanska N, de Wild M, Wieland M, Geis-Gerstorfer J. Enhancing surface free energy and hydrophilicity through chemical modification of microstructured titanium implant surfaces. J Biomed Mater Res A. 2006;76(2):323–334. | |
Takebe J, Itoh S, Okada J, Ishibashi K. Anodic oxidation and hydrothermal treatment of titanium results in a surface that causes increased attachment and altered cytoskeletal morphology of rat bone marrow stromal cells in vitro. J Biomed Mater Res. 2000;51(3):398–407. | |
Rupp F, Scheideler L, Rehbein D, Axmann D, Geis-Gerstorfer J. Roughness induced dynamic changes of wettability of acid etched titanium implant modifications. Biomaterials. 2004;25(7–8):1429–1438. | |
Lamolle SF, Monjo M, Rubert M, Haugen HJ, Lyngstadaas SP, Ellingsen JE. The effect of hydrofluoric acid treatment of titanium surface on nanostructural and chemical changes and the growth of MC3T3-E1 cells. Biomaterials. 2009;30(5):736–742. | |
Khang D, Choi J, Im YM, et al. Role of subnano-, nano- and submicron-surface features on osteoblast differentiation of bone marrow mesenchymal stem cells. Biomaterials. 2012;33(26):5997–6007. | |
Mendonça G, Mendonça DB, Simões LG, et al. The effects of implant surface nanoscale features on osteoblast-specific gene expression. Biomaterials. 2009;30(25):4053–4062. | |
Gittens RA, McLachlan T, Olivares-Navarrete R, et al. The effects of combined micron-/submicron-scale surface roughness and nanoscale features on cell proliferation and differentiation. Biomaterials. 2011;32(13):3395–3403. | |
Zhao L, Wang H, Huo K, et al. The osteogenic activity of strontium loaded titania nanotube arrays on titanium substrates. Biomaterials. 2013;34(1):19–29. | |
Zhang W, Li Z, Liu Y, et al. Biofunctionalization of a titanium surface with a nano-sawtooth structure regulates the behavior of rat bone marrow mesenchymal stem cells. Int J Nanomedicine. 2012;7:4459–4472. | |
Mendonça G, Mendonça DB, Aragão FJ, Cooper LF. The combination of micron and nanotopography by H(2)SO(4)/H(2)O(2) treatment and its effects on osteoblast-specific gene expression of hMSCs. J Biomed Mater Res A. 2010;94(1):169–179. | |
Zhao L, Mei S, Chu PK, Zhang Y, Wu Z. The influence of hierarchical hybrid micro/nano-textured titanium surface with titania nanotubes on osteoblast functions. Biomaterials. 2010;31(19):5072–5082. | |
Kubo K, Tsukimura N, Iwasa F, et al. Cellular behavior on TiO2 nanonodular structures in a micro-to-nanoscale hierarchy model. Biomaterials. 2009;30(29):5319–5329. | |
Dong W, Zhang T, Epstein J, et al. Multifunctional nanowire bioscaffolds on titanium. Chem Mater. 2007;19:4454–4459. | |
Brammer KS, Kim H, Noh K, et al. Highly bioactive 8 nm hydrothermal TiO2 nanotubes elicit enhanced bone cell response. Adv Eng Mater. 2011;13(3):B88–B94. | |
Bauer S, Park J, von der Mark K, Schmuki P. Improved attachment of mesenchymal stem cells on super-hydrophobic TiO2 nanotubes. Acta Biomater. 2008;4(5):1576–1582. | |
Hosono E, Matsuda H, Honma I, Ichihara M, Zhou H. Synthesis of a perpendicular TiO2 nanosheet film with the superhydrophilic property without UV irradiation. Langmuir. 2007;23(14):7447–7450. | |
Yuan JJ, Li HD, Wang QL, et al. Fabrication, characterization, and photocatalytic activity of double-layer TiO2 nanosheet films. Mater Lett. 2012;81:123–126. | |
Zanganeh S, Kajbafvala A, Zanganeh N, et al. Hydrothermal synthesis and characterization of TiO 2 nanostructures using LiOH as a solvent. Adv Powder Technol. 2011;22(3):336–339. | |
Komasa S, Taguchi Y, Nishida H, Tanaka M, Kawazoe T. Bioactivity of nanostructure on titanium surface modified by chemical processing at room temperature. J Prosthodont Res. 2012;56(3):170–177. | |
Dong W, Zhang T, McDonald M, Padilla C, Epstein J, Tian ZR. Biocompatible nanofiber scaffolds on metal for controlled release and cell colonization. Nanomedicine. 2006;2(4):248–252. | |
Morgan DL, Liu H-W, Frost RL, Waclawik ER. Implications of precursor chemistry on the alkaline hydrothermal synthesis of titania/titanate nanostructures. J Phys Chem C. 2010;114:101–110. | |
Wei D, Zhou Y, Wang Y, Meng Q, Jia D. Structure and apatite formation of microarc oxidized TiO2-based films before and after alkali-treatment by various alkali concentrations. Surface Coatings Technol. 2008;202(20):5012–5019. | |
Finke B, Luethen F, Schroeder K, et al. The effect of positively charged plasma polymerization on initial osteoblastic focal adhesion on titanium surfaces. Biomaterials. 2007;28(30):4521–4534. | |
Vandrovcova M, Hanus J, Drabik M, et al. Effect of different surface nanoroughness of titanium dioxide films on the growth of human osteoblast-like MG63 cells. J Biomed Mater Res A. 2012;100(4):1016–1032. | |
Arvidsson A, Liedberg B, Möller K, Lyvén B, Sellén A, Wennerberg A. Chemical and topographical analyses of dentine surfaces after Carisolv treatment. J Dent. 2002;30(2–3):67–75. | |
Zhang H, Bremmell K, Kumar S, Smart RS. Vitronectin adsorption on surfaces visualized by tapping mode atomic force microscopy. J Biomed Mater Res A. 2004;68(3):479–488. | |
Anselme K. Osteoblast adhesion on biomaterials. Biomaterials. 2000;21(7):667–681. | |
Lim JY, Hansen JC, Siedlecki CA, Runt J, Donahue HJ. Human foetal osteoblastic cell response to polymer-demixed nanotopographic interfaces. J R Soc Interface. 2005;2(2):97–108. | |
Yamamoto Y, Ohsaki Y, Goto T, Nakasima A, Iijima T. Effects of static magnetic fields on bone formation in rat osteoblast cultures. J Dent Res. 2003;82(12):962–966. | |
Sila-Asna M, Bunyaratvej A, Maeda S, Kitaguchi H, Bunyaratavej N. Osteoblast differentiation and bone formation gene expression in strontium-inducing bone marrow mesenchymal stem cell. Kobe J Med Sci. 2005;3(1–2):25–35. | |
Masaki C, Schneider GB, Zaharias R, Seabold D, Stanford C. Effects of implant surface microtopography on osteoblast gene expression. Clin Oral Implants Res. 2005;16(6):650–656. | |
Kruger TE, Miller AH, Wang J. Collagen scaffolds in bone sialoprotein-mediated bone regeneration. ScientificWorldJournal. 2013;2013:812718. |
 © 2014 The Author(s). This work is published and licensed by Dove Medical Press Limited. The full terms of this license are available at https://www.dovepress.com/terms.php and incorporate the Creative Commons Attribution - Non Commercial (unported, v3.0) License.
By accessing the work you hereby accept the Terms. Non-commercial uses of the work are permitted without any further permission from Dove Medical Press Limited, provided the work is properly attributed. For permission for commercial use of this work, please see paragraphs 4.2 and 5 of our Terms.
© 2014 The Author(s). This work is published and licensed by Dove Medical Press Limited. The full terms of this license are available at https://www.dovepress.com/terms.php and incorporate the Creative Commons Attribution - Non Commercial (unported, v3.0) License.
By accessing the work you hereby accept the Terms. Non-commercial uses of the work are permitted without any further permission from Dove Medical Press Limited, provided the work is properly attributed. For permission for commercial use of this work, please see paragraphs 4.2 and 5 of our Terms.