")
Back to Journals » Degenerative Neurological and Neuromuscular Disease » Volume 4
Optical coherence tomography for retinal imaging in multiple sclerosis
Authors Zimmermann H, Oberwahrenbrock T, Brandt AU, Paul F, Dörr J
Received 30 August 2014
Accepted for publication 17 October 2014
Published 9 December 2014 Volume 2014:4 Pages 153—162
DOI https://doi.org/10.2147/DNND.S73506
Checked for plagiarism Yes
Review by Single anonymous peer review
Peer reviewer comments 2
Editor who approved publication: Prof. Dr. Thomas Müller
Hanna Zimmermann,1 Timm Oberwahrenbrock,1 Alexander U Brandt,1 Friedemann Paul,1–3 Jan Dörr1,2
1NeuroCure Clinical Research Center, 2Clinical and Experimental Multiple Sclerosis Research Center, 3Department of Neurology, Charité – Universitätsmedizin Berlin, Berlin, Germany
Abstract: Visual disturbances caused by inflammatory and demyelinating processes of the visual system, mainly in the optic nerve, are a common symptom in multiple sclerosis (MS). Optical coherence tomography (OCT) is a tool that is increasingly used for quantifying retinal damage in MS and other neurologic diseases. Based on spectral interferometry, it uses low-coherent infrared light to generate high-resolution spatial images of the retina. The retinal nerve fiber layer (RNFL) consists of unmyelinated axons that form the optic nerve, and thus represents a part of the central nervous system. OCT allows for noninvasive measurements of RNFL thickness in micrometer resolution. With the help of OCT, researchers have managed to demonstrate that eyes of MS patients show distinct RNFL thinning after an event of acute optic neuritis in MS, and even subclinical damage in eyes with no previous optic neuritis. OCT is also a useful tool in terms of providing a differential diagnosis of MS toward, for example, neuromyelitis optica, a disease that usually shows stronger retinal thinning, or Susac syndrome, which is characterized by distinct patchy thinning of the inner retinal layers. RNFL thinning is associated with magnetic resonance imaging-derived measurements of the brain, such as whole-brain atrophy, gray and white matter atrophy, and optic radiation damage. These features suggest that OCT-derived retinal measurements are a complement for measuring central nervous system neurodegeneration in the context of clinical trials – for example, with neuroprotective substances.
Keywords: visual function, multiple sclerosis, optic neuritis, retinal nerve fiber layer, neuromyelitis optica, Susac syndrome
Introduction
“Objective”, “easy to perform”, “noninvasive”, “cheap”, and “reproducible” – these are keywords that are used when referring to the application of optical coherence tomography (OCT) as a novel imaging marker for the diagnosis, differential diagnosis, and disease progression in multiple sclerosis (MS), the most common chronic inflammatory disorder of the central nervous system (CNS).1 But what is really behind it?
Visual disturbances including blurred vision, visual field defects, and color desaturation are frequently occurring symptoms in MS and are assumed to be caused by inflammation in and axonal damage to the optic nerve as part of the CNS.2,3 When exceeding a certain threshold, this scenario may clinically appear as acute optic neuritis (ON). During the course of the disease, acute ON affects 50%–70% of MS patients.2,3 Notably, MS patients consider visual function the second most important body function,4 which underscores the considerable impact of visual impairment on patients’ quality of life.
Since its introduction in 1991,5 retinal OCT has emerged as a valuable part of the neuroophthalmologic imaging toolbox. It allows for spatial imaging of the retina with micrometer resolution and thus, for example, quantification of the retinal nerve fiber layer (RNFL), which represents the unmyelinated axons of the retinal ganglion cells that converge to the optic disc and form the optic nerve (Figure 1).6 In principle, OCT works as an analog to ultrasound imaging, but is based on spectral interferometry.7 Infrared low-coherent light from a laser or superluminescent diode is scattered back by the different retinal layers. By analyzing phase differences obtained from an interference pattern with a reference beam, the signal can be mathematically transformed into a depth protocol. Thus, intraretinal thickness estimates can be calculated. Of note, as a general rule, OCT data are derived from different abilities of distinct anatomical structures to reflect light and do not necessarily represent the respective anatomical structures itself.
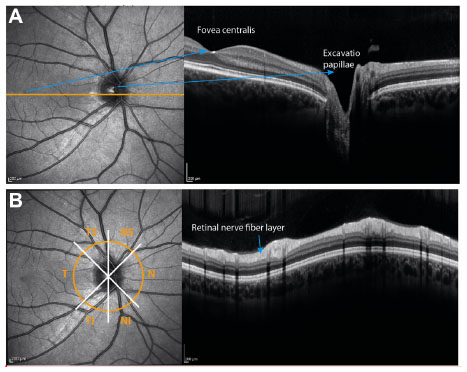 | Figure 1 OCT-derived cross-sectional images of the retina. |
The first OCT data from MS patients were reported in 1999.8 While early OCT studies in MS were performed with comparatively slow third generation time domain (TD)-OCT devices, which focus on the peripapillary RNFL derived from a ring scan and the total macular volume (TMV) of all layers, state-of-the-art fourth generation spectral domain (SD)-OCT devices and algorithms facilitate retinal imaging with enhanced resolution, shorter acquisition times, three-dimensional scans, and video imaging. Also, in the latest SD-OCT devices, eye tracking systems allow accurate repositioning of the scanned area, thus providing conditions for detecting even subtle changes in the range of a few micrometers in follow-up measurements. The most important advantage of SD-OCT is that it allows for intraretinal segmentation, which means that the different retinal layers can now be differentiated and measured individually (Figure 2). Thus, besides the RNFL, the bordering ganglion cell layer (GCL), often combined with the inner plexiform layer (GCIPL), became an important outcome parameter in OCT studies in MS.9–14 Importantly, comparative studies with different OCT devices revealed that data generated by TD-OCT and SD-OCT are not interchangeable.15 Thus, the technique used for acquisition should be considered when interpreting data.
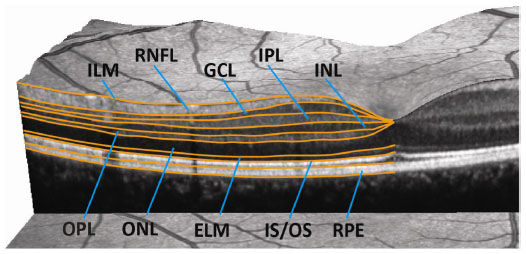 | Figure 2 Intraretinal segmentation in a three-dimensional spectral domain OCT scan of the macula. |
The examination is noninvasive; OCT devices are – comparatively – affordable, and examinations can be performed within a few minutes. Given these features, OCT has emerged into a valuable imaging method for the detection and longitudinal monitoring of neuroaxonal pathology in MS and other diseases with a neurodegenerative component. Importantly, typical OCT findings in MS, namely RNFL reduction and GCL thinning, were also the most prominent pathological changes observed in a postmortem histological investigation of the retinas of MS patients, which thereby corroborates the validity of the OCT technique.16 Against this background, OCT is on the rise to becoming a standard outcome parameter in observational and interventional trials in MS.
The aim of this review is to briefly summarize current OCT findings in MS and ON, its role for differential diagnosis, and its suitability as an outcome parameter in clinical trials.
Retinal damage in MS following ON
Acute ON is the presenting symptom in 15%–20% of MS patients and occurs in up to 70% of patients during the course of the disease.2,3 For decades, temporal paling and atrophy of the optic disc was considered a characteristic morphological consequence of ON. Accordingly, numerous OCT studies consistently found that ON leads to significant thinning of the RNFL (Figure 3).17–26 According to a meta-analysis of cross-sectional TD-OCT studies that included more than 2,000 individual eyes from MS patients with a previous episode of ON,27 a mean RNFL reduction of approximately 20 μm can be expected after ON, which corresponds to a 20% loss in RNFL thickness. The favorite explanation for this observation is the retrograde degeneration of retinal axons that have been damaged by an inflammatory attack to the optic nerve. More recently, the course of RNFL reduction in the context of acute ON has been evaluated in more detail using SD-OCT.11 After initial swelling due to edema in the acute phase of ON, RNFL thickness decreased over the following 6 months. Intraretinal segmentation demonstrated that GCIPL also decreased significantly after ON. Of note, initial swelling was restricted to RNFL, suggesting that the changes in the GCIPL are the more reliable parameter for longitudinal monitoring of ON-related retinal damage.
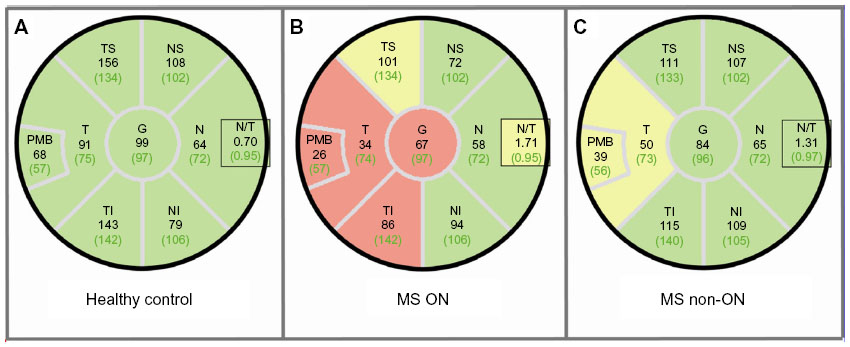 | Figure 3 RNFL thinning in MS with and without ON. |
Retinal damage in MS without ON
While RNFL reduction after an episode of ON is not surprising, RNFL reduction was consistently observed in MS patients who had never had a clinical episode of ON, as well as in the clinically unaffected fellow eye of patients with a history of ON (Figure 3).17,18,20,28 Accordingly, the meta-analysis of cross-sectional TD-OCT studies mentioned in the “Retinal damage in MS following ON” section reported a mean RNFL reduction of approximately 7 μm in more than 3,100 eyes of MS patients without ON.27 We recently performed a large multicenter SD-OCT study including 414 MS patients and 94 healthy control subjects, with the objective of describing retinal findings in MS, while focusing on the influence of an ON and differences in MS subgroups.18 The study revealed that even in the absence of ON, the RNFL is about 10 μm thinner when compared to that of healthy controls. MS patients with a secondary progressive disease course were more severely affected than patients with relapsing–remitting MS; moreover, patients with primary progressive MS who, by definition, do not develop acute ON, also showed RNFL thinning. In contrast to earlier TD-OCT-derived data, which failed to demonstrate RNFL reduction in patients with clinically isolated syndrome (CIS) suggestive of early MS,29 a more recent SD-OCT study showed GCL thinning in a cohort of CIS patients without a history of ON and with normal visual evoked potential (VEP) latencies.12 These data indicate that degeneration of retinal neurons occurs very early in the course of the disease and independent of ON. While a plethora of cross-sectional OCT studies in MS exist, high-quality longitudinal data are rather sparse. According to a TD-OCT study that monitored RNFL changes in MS patients at 6-month intervals over a period of up to 4.5 years, progressive RNFL thinning occurred even in the absence of ON as a function of time with a mean annualized decrease of 1–2 μm.30 A similar decrease in RNFL and GCIPL thickness was recently reported in an SD-OCT study on 92 MS patients over a median follow-up period of 1 year.14 In contrast, a smaller longitudinal SD-OCT study failed to detect a significant change over time in a mixed cohort of patients with relapsing–remitting and secondary progressive MS.31 Thus, longitudinal SD-OCT data still await confirmation in a sufficiently large cohort of well-characterized MS patients over a sufficiently long period of time. In comparison, the natural course of RNFL thinning in a healthy population ranges from around 0.1–0.5 μm per year.32–35
How can the development of retinal damage in MS patients without a concomitant or previous ON be explained? In fact, there is a lively ongoing scientific debate about this phenomenon. Currently, three favorite hypotheses are discussed, which are not mutually exclusive.36 The first explanation refers to a subclinical “smoldering” ON that structurally impacts the optic nerve but does not manifest as clinically apparent ON. Consequently, retrograde axonal damage results in RNFL thinning, and GCL reduction can be explained by the “dying back” of retinal ganglion cells. Another hypothesis is focused on the concept of retrograde transsynaptic degeneration of the retinal axons and neurons, respectively, which was already suggested in the 1960s.37 MS lesions within the posterior part of the visual pathway affect axons of the optic radiation, which leads to retrograde degeneration of second-level neurons in the lateral geniculate nucleus and then, by crossing the synapse, transsynaptically to the degeneration of the optical tract and optic nerve, respectively.38,39 This model is supported by several combined OCT and magnetic resonance imaging (MRI) studies, which are discussed later in this review. The third approach to explain subclinical retinal damage in MS is being discussed controversially and refers to a primary retinal pathology in MS in which retinal neurons are the primary target of a neurodegenerative process.10,40
Retinal changes in MS beyond axonal and neuronal damage
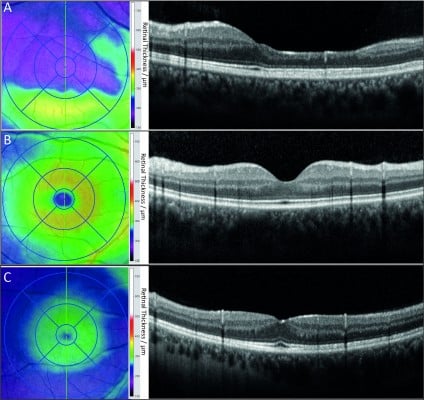
In addition to the RNFL and GCIPL, other retinal layers may be affected in MS, although data are less clear. Changes in the inner nuclear layer (INL) revealed new insight on MS-related retinal damage: Gelfand et al41 reported findings of macular microcysts in the INL in 5%–6% of all MS patients’ eyes. Appearance of macular microcysts is illustrated in Figure 4. MS patients suffering from macular microcysts tended to have reduced RNFL and GCIPL, more severely impaired visual function, and worse MS disease severity scores. Several studies from other centers confirmed these results and researchers suggested that macular microcysts are a consequence of retinal ganglion cell degeneration comprising inflammatory components.42,43 Macular microcysts in MS appear to be dynamic in their extent, suggesting a dependency on the acute inflammatory status of the optic nerve.42,44 It was also reported that macular microcysts are not exclusive to MS, but they also occur in other neuroinflammatory conditions such as neuromyelitis optica (NMO) and chronic relapsing inflammatory optic neuropathy, and that macular microcysts in those diseases are generally associated with ON.41,42 However, macular microcysts are not specific to neuroinflammatory diseases, as a comprehensive report on the complete clinical spectrum of macular microcysts has revealed.45 Similar findings have also been shown in hereditary optic neuropathy, including Leber hereditary optic neuropathy and glaucoma,46–48 pointing to vitreous traction and schisis of the INL as an alternative cause for macular microcysts.46,49 In our own database, none of nine patients with neuroinflammatory diseases and macular microcysts showed any signs of vitreous traction, which clearly argues against vitreous traction as a causative factor in macular microcysts.44 Detection of macular microcysts was the first evidence that neuroinflammatory disorders do not only lead to a loss of retinal axons and ganglion cells, but also to visible structural damage in further retinal layers. Even in the absence of visible macular microcysts, thickening of the INL occurs in eyes with a history of ON, which is also in correlation to gadolinium-enhancing T2-hyperintense lesions on cranial MRI, disability, and relapse rate, indicating that the INL might be a site of swelling due to acute inflammatory processes.42,43 While the INL was repeatedly shown to be a dynamic parameter for abnormalities in MS, results for the involvement of the outer retinal layers – namely, the outer plexiform layer, outer nuclear layer, and photoreceptor layer – are inconsistent. In a subgroup of MS patients with suspected primary retinal thinning named “macula thinning predominant” with normal RNFL but abnormal TMV, a reduction of these outer layers was found in comparison to healthy controls.10 However, while a similar finding was reported from a second United States cohort,50 we could not confirm the existence of this subtype in our own database.40
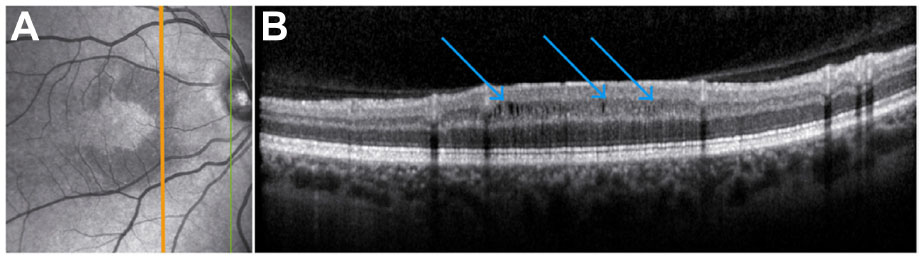 | Figure 4 Macular microcysts in a patient with recurrent optic neuritis. |
Relationship between structural retinal changes and visual function
Visual impairment is one of the most prevalent symptoms of MS and compromises the health-related quality of life in MS patients.4,51,52 Interestingly, OCT-determined retinal disintegration correlates with the quality of life in MS patients.51 This suggests that OCT-detectable retinal damage translates into gaugeable visual dysfunction, indicating the morphological changes that we can detect by OCT are clinically relevant. Indeed, several publications describe a relation of retinal axonal or ganglion cell loss to visual function.26,51,54 In terms of visual acuity, low-contrast visual acuity determined at 1.25% and 2.5% contrast levels using low-contrast visual acuity (Sloan) charts or functional acuity contrast testing showed a stronger association with RNFL/GCL thinning than did high-contrast tests using Snellen or Early Treatment Diabetic Retinopathy Study (ETDRS) charts.53–55 Also, color vision determined by pseudoisochromatic Hardy–Rand–Rittler plates or the Lanthony D15 desaturated tests was found to be impaired in MS and is associated with RNFL thinning.56
One widespread method to test optic nerve function include the use of VEP recorded from the visual cortex. The amplitude and latency after a visual stimulus allow for conclusions to be made on the integrity of the optic pathway. Several publications investigated whether OCT or VEP is the more sensitive tool in evaluating optic nerve damage in MS.57–59 VEP tended to be more sensitive in detecting eyes with a previous ON, whereas OCT is more objective in obtaining the subtle shades of degeneration. In consequence, the two methods are considered complementary because each represents different aspects of the pathology. RNFL thickness was also shown to correlate with visual field deficits after ON.60 A more recent technique to characterize visual function is multifocal VEP, which detects abnormalities in smaller areas using numerous stimulations presented in one measurement. In a cohort of CIS patients it was able to detect focal abnormalities even in the absence of ON.61
As a general rule, OCT examinations should always be accompanied by a comprehensive visual function test to give an overall picture of the patient’s visual impairment.62
Relationship between OCT and brain atrophy
A frequently used slogan in neurology-related OCT research is “OCT – a window to the brain?” and occasionally, provocative claims to substitute MRI by cheaper, faster, and easier-to-perform OCT are made. In 2007, the first study investigating the relationship between OCT measurements and brain atrophy showed a significant association between RNFL thickness and brain parenchymal fraction, an MRI-derived measure of brain atrophy.63 These data suggested that neurodegeneration in the brain is reflected by retinal axonal breakdown and were the starting shot for the evaluation of the capacity of OCT-based measures as surrogate markers for global neurodegeneration in MS and, subsequently, other neurodegenerative disorders.64–66 Several subsequent TD-OCT-based publications confirmed a relationship between different MRI measurements of brain atrophy and RNFL thickness in MS patients, yet the studies varied in terms of their methods and patient cohorts.19,22,67,68 Also, an association between RNFL thickness and axonal damage in the visual cortex, as determined by magnetic resonance spectroscopy, was shown.69 While some studies63,67 focused mainly on global brain atrophy as a more robust measure of overall brain neurodegeneration, which integrates volume changes in both gray and white matter irrespective of the underlying cause, few of these early studies addressed the correlations between retinal axonal damage and gray or white matter atrophy separately.19,22,68 However, data remained inconsistent, probably as a consequence of different cohort characteristics and methodological restrictions.22,68 Results from more recent SD-OCT studies are inconsistent as well. While some researchers reported good correlations for OCT measurements with white matter atrophy (but not or less so for gray matter), others found a relationship of RNFL and GCIPL thickness with cortical gray matter volume.70–72 Furthermore, a negative correlation of INL thickness and white matter volume was reported.70 One important confounder that impacts the correlation between OCT and MRI measures of neurodegeneration is a patient’s history of ON.72 An event of ON may inflict substantial damage to the optic nerve and inner retinal layers, respectively, which is not necessarily accompanied by equivalent damage to the brain parenchyma, thereby especially disrupting the association with gray matter measurements.72 How can the quite consistently observed associations between retinal and brain damage, at least in MS eyes without an ON history, be explained? Obviously, a more global primary or secondary degenerative process that affects the whole CNS including the retina may be an explanation. Strong support for the concept of retrograde transsynaptic degeneration discussed earlier comes from a recent combined OCT and ultrahigh field MRI study, which showed a significant correlation between both thinning of the optic radiation and lesion volume within the optic radiation with RNFL reduction.73 Transsynaptic degeneration may not only occur in a retrograde direction, but it may also occur bidirectionally.38 Anterograde degeneration in the form of Wallerian degeneration following ON can transsynaptically proceed beyond the lateral geniculate nucleus via the optic radiation to the visual cortex.74,75 In summary, OCT and MRI provide differential and largely complementary information. Thus, for the time being, OCT should be viewed as an additional complementary outcome parameter instead of an alternative to MRI.
OCT in the diagnosis and differential diagnosis of MS
Currently, the use of OCT in the diagnosis of MS is not clearly established, and outside MS centers and clinical trials, OCT clearly still plays a subordinated role. Nevertheless, as visual dysfunction caused by inflammation or axonal damage of the optic nerve is not unique for MS – and given that it may also occur in other neuroophthalmologic disorders often misdiagnosed as MS62 – a tool to differentiate diseases on the basis of characteristic morphological retinal changes would be helpful. Indeed, several OCT studies demonstrated a capability of OCT to differentiate between retinal damage attributable to MS–ON and other neuroophthalmologic differential diagnoses, as different entities show different patterns of retinal pathology. Two important differential diagnoses of MS in which OCT has been shown to be helpful in terms of differential diagnosis, namely neuromyelitis optica spectrum disorders (NMOSD) and Susac syndrome (SuS), are exemplarily discussed in the following paragraphs.
Both NMOSD and MS are neuroinflammatory diseases with acute ON as a characteristic or even crucial manifestation.76,77 But while ON is usually unilateral in MS and is often characterized by a good prognosis,3 ON in NMOSD frequently presents bilaterally and even simultaneously. Visual impairment is often more severe and the risk of recurrence is higher.78 Several studies investigated whether different OCT patterns exist in NMOSD and MS patients. A major finding of most studies, including our own investigation of 17 patients with MS and NMOSD, respectively,79 is that RNFL reduction after ON is more pronounced in NMO than in MS (55–83 μm versus 74–95 μm, respectively).11,21,79–83 Likewise, the GCIPL is more severely affected.11,79 However, other studies failed to detect a difference in RNFL thickness between MS and NMOSD.84,85 The strong visual impairment in NMO is thought to result from a certain threshold of neuroaxonal loss, from which retinal neurons and axons no longer have the ability to sufficiently maintain visual function. Furthermore, macular microcysts occur at a higher frequency in NMOSD–ON than MS–ON (21% versus 5%, respectively), indicating a stronger presence of inflammatory processes.42,79,86 This is in line with the increased INL thickness reported in NMOSD after ON in comparison to MS.79 Interestingly, OCT results of NMOSD eyes not affected by a clinically reported ON show no or only slight differences in comparison to healthy control subjects,11,21,79,81,85 which might be indicative of either (or both) lesser diffuse direct optic nerve damage in NMOSD when compared to MS, or less pronounced retrograde transsynaptic degeneration as a consequence of less severe affection of the posterior visual pathway in NMOSD.
SuS is a rare condition characterized by encephalopathy, visual disturbances, and hearing loss, which are caused by probable autoimmune-mediated occlusions of small vessels in the brain, retina, and inner ear, respectively.87–92 Despite the completely different pathophysiology of visual involvement in SuS and MS, the phenotype of visual impairment in SuS may resemble that of ON. In combination with clinically and radiologically evident CNS involvement, and taking into account that young women are predominantly affected both by SuS and MS, it is not surprising that patients with SuS are very often misdiagnosed as having MS.93–96 Recently, a TD-OCT study comparing retinal morphology in nine SuS patients and MS patients with or without previous ON revealed distinct patterns of retinal damage in SuS and MS.97 All three groups showed a reduction of average RNFL thickness and TMV. However, while in MS retinal layer damage is evenly distributed over all sectors of the macula, in SuS patients, a characteristically patchy retinal thinning in certain sectors was observed, reflecting the vascular origin of the pathology. However, there were no specific retinal areas that were predominantly affected. Currently, studies using SD-OCT in SuS are underway and will provide further information on the predominantly affected retinal layers. While damage is mainly restricted to RNFL and GCIPL in MS, the architecture of the blood supply in the retina also suggests that deeper layers are involved in SuS (Figure 5).
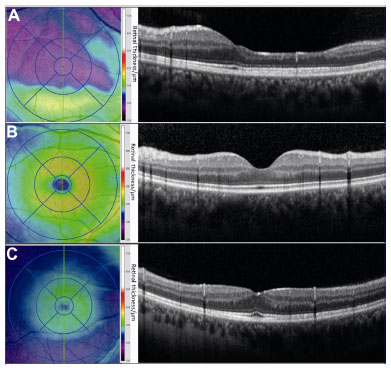 | Figure 5 Distinct patterns of macular volume loss in a patient with Susac syndrome. |
Conclusion and future perspectives
OCT and, in particular, the up-to-date SD-OCT technique provide detailed information at high resolution regarding the thickness, and thus structural integrity, of the different retinal layers. Given that within the retina, axons of the retinal ganglion cells are not myelinated, axonal damage can be directly quantified, rendering OCT an excellent tool to evaluate neuroaxonal damage in vivo. OCT certainly provides only limited added value in the diagnostic workup of straightforward cases. But, as different diseases may show distinct patterns of retinal pathology, OCT may be helpful in the differential diagnostic workup in difficult situations. Most importantly, in the context of MS, it is now well established that at least in the absence of ON, retinal neuroaxonal degeneration determined by OCT reflects global neurodegeneration in the CNS, suggesting OCT parameters – in particular, RNFL and GCIPL – as surrogates for measuring CNS neurodegeneration. However, the appropriateness of OCT as part of the routine monitoring of MS patients is currently controversially discussed.98,99 Moreover, the high inter- and intraindividual reproducibility of OCT data facilitates follow-up monitoring of neurodegeneration and provides a rationale for the use of OCT as an outcome parameter in clinical trials in general and in particular those addressing neurodegeneration or evaluating the neuroprotective capacity of new drugs. Indeed, an increasing number of observational and interventional studies100 already included changes in RNFL as secondary endpoint. An important observation that limits the use of OCT in MS research is that the correlation between retinal and CNS neurodegeneration often tends to decrease or even vanish in the context of ON, which can be explained by the dramatic impact of ON on the inner retinal layers. However, there are no longitudinal data available to substantiate the influence of ON on the relationship of retinal thinning and brain atrophy. Thus, the history of ON or acute ON in a patient enrolled in a clinical trial is a major confounder that needs to be carefully addressed. Less affected by this limitation are trials in patients with acute ON, in which OCT parameters are excellent endpoints for the evaluation of neuroprotective substances. Recently, Sühs et al101 were the first to use RNFL reduction in the first 16 weeks after an acute ON as the primary endpoint in an interventional randomized controlled Phase II clinical trial, and they showed that a 3-day course of erythropoietin in addition to methylprednisolone was superior to placebo in preventing RNFL thinning after ON. Remarkably, a sample size of 40 individuals per arm was sufficient to detect a significant difference.101 Further studies with OCT parameters as primary or secondary endpoints are under way.
Disclosure
The authors report no conflicts of interest in this work.
References
Compston A, Coles A. Multiple sclerosis. Lancet. 2008;372(9648): 1502–1517. | |
Balcer LJ. Clinical practice. Optic neuritis. N Engl J Med. 2006; 354(12):1273–1280. | |
Toosy AT, Mason DF, Miller DH. Optic neuritis. Lancet Neurol. 2014; 13(1):83–99. | |
Heesen C, Böhm J, Reich C, Kasper J, Goebel M, Gold SM. Patient perception of bodily functions in multiple sclerosis: gait and visual function are the most valuable. Mult Scler. 2008;14(7):988–991. | |
Huang D, Swanson EA, Lin CP, et al. Optical coherence tomography. Science. 1991;254(5035):1178–1181. | |
Bock M, Paul F, Dörr J. [Diagnosis and monitoring of multiple sclerosis: the value of optical coherence tomography]. Nervenarzt. 2013;84(4):483–492. German. | |
Drexler W, Fujimoto JG. State-of-the-art retinal optical coherence tomography. Prog Retin Eye Res. 2008;27(1):45–88. | |
Parisi V, Manni G, Spadaro M, et al. Correlation between morphological and functional retinal impairment in multiple sclerosis patients. Invest Ophthalmol Vis Sci. 1999;40(11):2520–2527. | |
Saidha S, Syc SB, Durbin MK, et al. Visual dysfunction in multiple sclerosis correlates better with optical coherence tomography derived estimates of macular ganglion cell layer thickness than peripapillary retinal nerve fiber layer thickness. Mult Scler. 2011;17(12):1449–1463. | |
Saidha S, Syc SB, Ibrahim MA, et al. Primary retinal pathology in multiple sclerosis as detected by optical coherence tomography. Brain. 2011;134(Pt 2):518–533. | |
Syc SB, Saidha S, Newsome SD, et al. Optical coherence tomography segmentation reveals ganglion cell layer pathology after optic neuritis. Brain. 2012;135(Pt 2):521–533. | |
Oberwahrenbrock T, Ringelstein M, Jentschke S, et al. Retinal ganglion cell and inner plexiform layer thinning in clinically isolated syndrome. Mult Scler. 2013;19(14):1887–1895. | |
Ratchford JN, Saidha S, Sotirchos ES, et al. Active MS is associated with accelerated retinal ganglion cell/inner plexiform layer thinning. Neurology. 2013;80(1):47–54. | |
Narayanan D, Cheng H, Bonem KN, Saenz R, Tang RA, Frishman LJ. Tracking changes over time in retinal nerve fiber layer and ganglion cell-inner plexiform layer thickness in multiple sclerosis. Mult Scler. 2014;20(10):1331–1341. | |
Bock M, Brandt AU, Dörr J, et al. Time domain and spectral domain optical coherence tomography in multiple sclerosis: a comparative cross-sectional study. Mult Scler. 2010;16(7):893–896. | |
Green AJ, McQuaid S, Hauser SL, Allen IV, Lyness R. Ocular pathology in multiple sclerosis: retinal atrophy and inflammation irrespective of disease duration. Brain. 2010;133(Pt 6):1591–1601. | |
Bock M, Brandt AU, Dörr J, et al. Patterns of retinal nerve fiber layer loss in multiple sclerosis patients with or without optic neuritis and glaucoma patients. Clin Neurol Neurosurg. 2010;112(8):647–652. | |
Oberwahrenbrock T, Schippling S, Ringelstein M, et al. Retinal damage in multiple sclerosis disease subtypes measured by high-resolution optical coherence tomography. Mult Scler Int. 2012;2012:530305. | |
Siger M, Dziegielewski K, Jasek L, et al. Optical coherence tomography in multiple sclerosis: thickness of the retinal nerve fiber layer as a potential measure of axonal loss and brain atrophy. J Neurol. 2008; 255(10):1555–1560. | |
Sepulcre J, Murie-Fernandez M, Salinas-Alaman A, García-Layana A, Bejarano B, Villoslada P. Diagnostic accuracy of retinal abnormalities in predicting disease activity in MS. Neurology. 2007;68(18): 1488–1494. | |
Ratchford JN, Quigg ME, Conger A, et al. Optical coherence tomography helps differentiate neuromyelitis optica and MS optic neuropathies. Neurology. 2009;73(4):302–308. | |
Grazioli E, Zivadinov R, Weinstock-Guttman B, et al. Retinal nerve fiber layer thickness is associated with brain MRI outcomes in multiple sclerosis. J Neurol Sci. 2008;268(1–2):12–17. | |
Zaveri MS, Conger A, Salter A, et al. Retinal imaging by laser polarimetry and optical coherence tomography evidence of axonal degeneration in multiple sclerosis. Arch Neurol. 2008;65(7):924–928. | |
Albrecht P, Fröhlich R, Hartung HP, Kieseier BC, Methner A. Optical coherence tomography measures axonal loss in multiple sclerosis independently of optic neuritis. J Neurol. 2007;254(11):1595–1596. | |
Costello F, Hodge W, Pan YI, Freedman M, DeMeulemeester C. Differences in retinal nerve fiber layer atrophy between multiple sclerosis subtypes. J Neurol Sci. 2009;281(1–2):74–79. | |
Fisher JB, Jacobs DA, Markowitz CE, et al. Relation of visual function to retinal nerve fiber layer thickness in multiple sclerosis. Ophthalmology. 2006;113(2):324–332. | |
Petzold A, de Boer JF, Schippling S, et al. Optical coherence tomography in multiple sclerosis: a systematic review and meta-analysis. Lancet Neurol. 2010;9(9):921–932. | |
Albrecht P, Ringelstein M, Müller AK, et al. Degeneration of retinal layers in multiple sclerosis subtypes quantified by optical coherence tomography. Mult Scler. 2012;18(10):1422–1429. | |
Outteryck O, Zephir H, Defoort S, et al. Optical coherence tomography in clinically isolated syndrome: no evidence of subclinical retinal axonal loss. Arch Neurol. 2009;66(11):1373–1377. | |
Talman LS, Bisker ER, Sackel DJ, et al. Longitudinal study of vision and retinal nerve fiber layer thickness in multiple sclerosis. Ann Neurol. 2010;67(6):749–760. | |
Serbecic N, Aboul-Enein F, Beutelspacher SC, et al. High resolution spectral domain optical coherence tomography (SD-OCT) in multiple sclerosis: the first follow up study over two years. PLoS One. 2011;6(5): e19843. | |
Parikh RS, Parikh SR, Sekhar GC, Prabakaran S, Babu JG, Thomas R. Normal age-related decay of retinal nerve fiber layer thickness. Ophthalmology. 2007;114(5):921–926. | |
Sung KR, Wollstein G, Bilonick RA, et al. Effects of age on optical coherence tomography measurements of healthy retinal nerve fiber layer, macula, and optic nerve head. Ophthalmology. 2009;116(6): 1119–1124. | |
Alamouti B, Funk J. Retinal thickness decreases with age: an OCT study. Br J Ophthalmol. 2003;87(7):899–901. | |
Celebi AR, Mirza GE. Age-related change in retinal nerve fiber layer thickness measured with spectral domain optical coherence tomography. Invest Ophthalmol Vis Sci. 2013;54(13):8095–8103. | |
Balk LJ, Petzold A. Current and future potential of retinal optical coherence tomography in multiple sclerosis with and without optic neuritis. Neurodegener Dis Manag. 2014;4(2):165–176. | |
Vanburen JM. Trans-synaptic retrograde degeneration in the visual system of primates. J Neurol Neurosurg Psychiatry. 1963;26:402–409. | |
Balk LJ, Steenwijk MD, Tewarie P, et al. Bidirectional trans-synaptic axonal degeneration in the visual pathway in multiple sclerosis. J Neurol Neurosurg Psychiatry. Epub June 27, 2014. | |
Jindahra P, Petrie A, Plant GT. Retrograde trans-synaptic retinal ganglion cell loss identified by optical coherence tomography. Brain. 2009;132(Pt 3):628–634. | |
Brandt AU, Oberwahrenbrock T, Ringelstein M, et al. Primary retinal pathology in multiple sclerosis as detected by optical coherence tomography. Brain. 2011;134(Pt 11):e193; author reply e194. | |
Gelfand JM, Nolan R, Schwartz DM, Graves J, Green AJ. Microcystic macular oedema in multiple sclerosis is associated with disease severity. Brain. 2012;135(Pt 6):1786–1793. | |
Kaufhold F, Zimmermann H, Schneider E, et al. Optic neuritis is associated with inner nuclear layer thickening and microcystic macular edema independently of multiple sclerosis. PLoS One. 2013; 8(8):e71145. | |
Saidha S, Sotirchos ES, Ibrahim MA, et al. Microcystic macular oedema, thickness of the inner nuclear layer of the retina, and disease characteristics in multiple sclerosis: a retrospective study. Lancet Neurol. 2012;11(11):963–972. | |
Brandt AU, Oberwahrenbrock T, Kadas EM, Lagrèze WA, Paul F. Dynamic formation of macular microcysts independent of vitreous traction changes. Neurology. 2014;83(1):73–77. | |
Burggraaff MC, Trieu J, de Vries-Knoppert WA, Balk L, Petzold A. The clinical spectrum of microcystic macular edema. Invest Ophthalmol Vis Sci. 2014;55(2):952–961. | |
Barboni P, Carelli V, Savini G, Carbonelli M, La Morgia C, Sadun AA. Microcystic macular degeneration from optical neuropathy: not inflammatory, not trans-synaptic degeneration. Brain. 2013;136(Pt 7):e239. | |
Abegg M, Dysli M, Wolf S, Kowal J, Dufour P, Zinkernagel M. Microcystic macular edema: retrograde maculopathy caused by optic neuropathy. Ophthalmology. 2014;121(1):142–149. | |
Wolff B, Basdekidou C, Vasseur V, Mauget-Faÿsse M, Sahel JA, Vignal C. Retinal inner nuclear layer microcystic changes in optic nerve atrophy: a novel spectral-domain OCT finding. Retina. 2013;33(10): 2133–2138. | |
Lujan BJ, Horton JC. Microcysts in the inner nuclear layer from optic atrophy are caused by retrograde trans-synaptic degeneration combined with vitreous traction on the retinal surface. Brain. 2013;136(Pt 11):e260. | |
Winges KM, Werner JS, Harvey DJ, et al. Baseline retinal nerve fiber layer thickness and macular volume quantified by OCT in the North American phase 3 fingolimod trial for relapsing-remitting multiple sclerosis. J Neuroophthalmol. 2013;33(4):322–329. | |
Schinzel J, Zimmermann H, Paul F, et al. Relations of low contrast visual acuity, quality of life and multiple sclerosis functional composite: a cross-sectional analysis. BMC Neurol. 2014;14:31. | |
Mowry EM, Loguidice MJ, Daniels AB, et al. Vision related quality of life in multiple sclerosis: correlation with new measures of low and high contrast letter acuity. J Neurol Neurosurg Psychiatry. 2009; 80(7):767–772. | |
Balcer LJ, Frohman EM. Evaluating loss of visual function in multiple sclerosis as measured by low-contrast letter acuity. Neurology. 2010;74 Suppl 3:S16–S23. | |
Walter SD, Ishikawa H, Galetta KM, et al. Ganglion cell loss in relation to visual disability in multiple sclerosis. Ophthalmology. 2012; 119(6):1250–1257. | |
Bock M, Brandt AU, Kuchenbecker J, et al. Impairment of contrast visual acuity as a functional correlate of retinal nerve fibre layer thinning and total macular volume reduction in multiple sclerosis. Br J Ophthalmol. 2012;96(1):62–67. | |
Villoslada P, Cuneo A, Gelfand J, Hauser SL, Green A. Color vision is strongly associated with retinal thinning in multiple sclerosis. Mult Scler. 2012;18(7):991–999. | |
Almarcegui C, Dolz I, Pueyo V, et al. Correlation between functional and structural assessments of the optic nerve and retina in multiple sclerosis patients. Neurophysiol Clin. 2010;40(3):129–135. | |
Tugcu B, Soysal A, Kilic M, et al. Assessment of structural and functional visual outcomes in relapsing remitting multiple sclerosis with visual evoked potentials and optical coherence tomography. J Neurol Sci. 2013;335(1–2):182–185. | |
Di Maggio G, Santangelo R, Guerrieri S, et al. Optical coherence tomography and visual evoked potentials: which is more sensitive in multiple sclerosis? Mult Scler. 2014;20(10):1342–1347. | |
Trip SA, Schlottmann PG, Jones SJ, et al. Retinal nerve fiber layer axonal loss and visual dysfunction in optic neuritis. Ann Neurol. 2005;58(3):383–391. | |
Pérez-Rico C, Ayuso-Peralta L, Rubio-Pérez L, et al. Evaluation of visual structural and functional factors that predict the development of multiple sclerosis in clinically isolated syndrome patients. Invest Ophthalmol Vis Sci. 2014;55(10):6127–6131. | |
Petzold A, Wattjes MP, Costello F, et al. The investigation of acute optic neuritis: a review and proposed protocol. Nat Rev Neurol. 2014; 10(8):447–458. | |
Gordon-Lipkin E, Chodkowski B, Reich DS, et al. Retinal nerve fiber layer is associated with brain atrophy in multiple sclerosis. Neurology. 2007;69(16):1603–1609. | |
Stricker S, Oberwahrenbrock T, Zimmermann H, et al. Temporal retinal nerve fiber loss in patients with spinocerebellar ataxia type 1. PLoS One. 2011;6(7):e23024. | |
Roth NM, Saidha S, Zimmermann H, et al. Photoreceptor layer thinning in idiopathic Parkinson’s disease. Mov Disord. 2014;29(9):1163–1170. | |
Roth NM, Saidha S, Zimmermann H, et al. Optical coherence tomography does not support optic nerve involvement in amyotrophic lateral sclerosis. Eur J Neurol. 2013;20(8):1170–1176. | |
Dörr J, Wernecke KD, Bock M, et al. Association of retinal and macular damage with brain atrophy in multiple sclerosis. PLoS One. 2011;6(4):e18132. | |
Frohman EM, Dwyer MG, Frohman T, et al. Relationship of optic nerve and brain conventional and non-conventional MRI measures and retinal nerve fiber layer thickness, as assessed by OCT and GDx: a pilot study. J Neurol Sci. 2009;282(1–2):96–105. | |
Pfueller CF, Brandt AU, Schubert F, et al. Metabolic changes in the visual cortex are linked to retinal nerve fiber layer thinning in multiple sclerosis. PLoS One. 2011;6(4):e18019. | |
Saidha S, Sotirchos ES, Oh J, et al. Relationships between retinal axonal and neuronal measures and global central nervous system pathology in multiple sclerosis. JAMA Neurol. 2013;70(1): 34–43. | |
Young KL, Brandt AU, Petzold A, et al. Loss of retinal nerve fibre layer axons indicates white but not grey matter damage in early multiple sclerosis. Eur J Neurol. 2013;20(5):803–811. | |
Zimmermann H, Freing A, Kaufhold F, et al. Optic neuritis interferes with optical coherence tomography and magnetic resonance imaging correlations. Mult Scler. 2013;19(4):443–450. | |
Sinnecker T, Oberwahrenbrock T, Metz I, et al. Optic radiation damage in multiple sclerosis is associated with visual dysfunction and retinal thinning – an ultrahigh-field MR pilot study. Eur Radiol. Epub August 17, 2014. | |
Gabilondo I, Martínez-Lapiscina EH, Martínez-Heras E, et al. Trans-synaptic axonal degeneration in the visual pathway in multiple sclerosis. Ann Neurol. 2014;75(1):98–107. | |
Balk LJ, Twisk JW, Steenwijk MD, et al. A dam for retrograde axonal degeneration in multiple sclerosis? J Neurol Neurosurg Psychiatry. 2014;85(7):782–789. | |
Wingerchuk DM, Lennon VA, Pittock SJ, Lucchinetti CF, Weinshenker BG. Revised diagnostic criteria for neuromyelitis optica. Neurology. 2006;66(10):1485–1489. | |
Jarius S, Wildemann B, Paul F. Neuromyelitis optica: clinical features, immunopathogenesis and treatment. Clin Exp Immunol. 2014;176(2): 149–164. | |
Pfueller CF, Paul F. Imaging the visual pathway in neuromyelitis optica. Mult Scler Int. 2011;2011:869814. | |
Schneider E, Zimmermann H, Oberwahrenbrock T, et al. Optical coherence tomography reveals distinct patterns of retinal damage in neuromyelitis optica and multiple sclerosis. PLoS One. 2013; 8(6):e66151. | |
Bichuetti DB, de Camargo AS, Falcão AB, Gonçalves FF, Tavares IM, de Oliveira EM. The retinal nerve fiber layer of patients with neuromyelitis optica and chronic relapsing optic neuritis is more severely damaged than patients with multiple sclerosis. J Neuroophthalmol. 2013;33(3):220–224. | |
Monteiro ML, Fernandes DB, Apóstolos-Pereira SL, Callegaro D. Quantification of retinal neural loss in patients with neuromyelitis optica and multiple sclerosis with or without optical neuritis using Fourier-domain optical coherence tomography. Invest Ophthalmol Vis Sci. 2012;53(7):3959–3966. | |
Merle H, Olindo S, Donnio A, Richer R, Smadja D, Cabre P. Retinal peripapillary nerve fiber layer thickness in neuromyelitis optica. Invest Ophthalmol Vis Sci. 2008;49(10):4412–4417. | |
Naismith RT, Tutlam NT, Xu J, et al. Optical coherence tomography differs in neuromyelitis optica compared with multiple sclerosis. Neurology. 2009;72(12):1077–1082. | |
Lange AP, Sadjadi R, Zhu F, Alkabie S, Costello F, Traboulsee AL. Spectral-domain optical coherence tomography of retinal nerve fiber layer thickness in NMO patients. J Neuroophthalmol. 2013;33(3): 213–219. | |
Fernandes DB, Raza AS, Nogueira RG, et al. Evaluation of inner retinal layers in patients with multiple sclerosis or neuromyelitis optica using optical coherence tomography. Ophthalmology. 2013;120(2): 387–394. | |
Sotirchos ES, Saidha S, Byraiah G, et al. In vivo identification of morphologic retinal abnormalities in neuromyelitis optica. Neurology. 2013;80(15):1406–1414. | |
Susac JO. Susac’s syndrome: the triad of microangiopathy of the brain and retina with hearing loss in young women. Neurology. 1994;44(4): 591–593. | |
Dörr J, Radbruch H, Bock M, et al. Encephalopathy, visual disturbance and hearing loss-recognizing the symptoms of Susac syndrome. Nat Rev Neurol. 2009;5(12):683–688. | |
Dörr J, Krautwald S, Wildemann B, et al. Characteristics of Susac syndrome: a review of all reported cases. Nat Rev Neurol. 2013;9(6): 307–316. | |
Kleffner I, Duning T, Lohmann H, et al. A brief review of Susac syndrome. J Neurol Sci. 2012;322(1–2):35–40. | |
Wuerfel J, Sinnecker T, Ringelstein EB, et al. Lesion morphology at 7 Tesla MRI differentiates Susac syndrome from multiple sclerosis. Mult Scler. 2012;18(11):1592–1599. | |
Jarius S, Kleffner I, Dörr JM, et al. Clinical, paraclinical and serological findings in Susac syndrome: an international multicenter study. J Neuroinflammation. 2014;11:46. | |
Rennebohm RM, Egan RA, Susac JO. Treatment of Susac’s Syndrome. Curr Treat Options Neurol. 2008;10(1):67–74. | |
Rennebohm R, Susac JO, Egan RA, Daroff RB. Susac’s Syndrome – update. J Neurol Sci. 2010;299(1–2):86–91. | |
O’Halloran HS, Pearson PA, Lee WB, Susac JO, Berger JR. Microangiopathy of the brain, retina, and cochlea (Susac syndrome). A report of five cases and a review of the literature. Ophthalmology. 1998;105(6):1038–1044. | |
Dörr J, Ringelstein M, Duning T, Kleffner I. Update on Susac syndrome: new insights in brain and retinal imaging and treatment options. J Alzheimers Dis. 2014;42 Suppl 3:S99–S108. | |
Brandt AU, Zimmermann H, Kaufhold F, et al. Patterns of retinal damage facilitate differential diagnosis between Susac syndrome and MS. PLoS One. 2012;7(6):e38741. | |
Jenkins TM, Toosy AT. Optical coherence tomography should be part of the routine monitoring of patients with multiple sclerosis: no. Mult Scler. 2014;20(10):1299–1301. | |
Saidha S, Calabresi PA. Optical coherence tomography should be part of the routine monitoring of patients with multiple sclerosis: yes. Mult Scler. 2014;20(10):1296–1298. | |
Dörr J, Ohlraun S, Skarabis H, Paul F. Efficacy of Vitamin D Supplementation in Multiple Sclerosis (EVIDIMS Trial): study protocol for a randomized controlled trial. Trials. 2012;13(1):15. | |
Sühs KW, Hein K, Sättler MB, et al. A randomized, double-blind, phase 2 study of erythropoietin in optic neuritis. Ann Neurol. 2012;72(2):199–210. |
 © 2014 The Author(s). This work is published and licensed by Dove Medical Press Limited. The full terms of this license are available at https://www.dovepress.com/terms.php and incorporate the Creative Commons Attribution - Non Commercial (unported, v3.0) License.
By accessing the work you hereby accept the Terms. Non-commercial uses of the work are permitted without any further permission from Dove Medical Press Limited, provided the work is properly attributed. For permission for commercial use of this work, please see paragraphs 4.2 and 5 of our Terms.
© 2014 The Author(s). This work is published and licensed by Dove Medical Press Limited. The full terms of this license are available at https://www.dovepress.com/terms.php and incorporate the Creative Commons Attribution - Non Commercial (unported, v3.0) License.
By accessing the work you hereby accept the Terms. Non-commercial uses of the work are permitted without any further permission from Dove Medical Press Limited, provided the work is properly attributed. For permission for commercial use of this work, please see paragraphs 4.2 and 5 of our Terms.