")
Back to Journals » Neuropsychiatric Disease and Treatment » Volume 10
Neurophysiological correlates of response inhibition predict relapse in detoxified alcoholic patients: some preliminary evidence from event-related potentials
Authors Petit G, Cimochowska A, Kornreich C , Hanak C, Verbanck P, Campanella S
Received 28 January 2014
Accepted for publication 3 March 2014
Published 9 June 2014 Volume 2014:10 Pages 1025—1037
DOI https://doi.org/10.2147/NDT.S61475
Checked for plagiarism Yes
Review by Single anonymous peer review
Peer reviewer comments 3
Géraldine Petit, Agnieszka Cimochowska, Charles Kornreich, Catherine Hanak, Paul Verbanck, Salvatore Campanella
Laboratory of Psychological Medicine and Addictology, ULB Neuroscience Institute (UNI), Université Libre de Bruxelles (ULB), Brussels, Belgium
Background: Alcohol dependence is a chronic relapsing disease. The impairment of response inhibition and alcohol-cue reactivity are the main cognitive mechanisms that trigger relapse. Despite the interaction suggested between the two processes, they have long been investigated as two different lines of research. The present study aimed to investigate the interaction between response inhibition and alcohol-cue reactivity and their potential link with relapse.
Materials and methods: Event-related potentials were recorded during a variant of a “go/no-go” task. Frequent and rare stimuli (to be inhibited) were superimposed on neutral, nonalcohol-related, and alcohol-related contexts. The task was administered following a 3-week detoxification course. Relapse outcome was measured after 3 months, using self-reported abstinence. There were 27 controls (seven females) and 27 patients (seven females), among whom 13 relapsed during the 3-month follow-up period. The no-go N2, no-go P3, and the “difference” wave (P3d) were examined with the aim of linking neural correlates of response inhibition on alcohol-related contexts to the observed relapse rate.
Results: Results showed that 1) at the behavioral level, alcohol-dependent patients made significantly more commission errors than controls (P<0.001), independently of context; 2) through the subtraction no-go P3 minus go P3, this inhibition deficit was neurophysiologically indexed in patients with greater P3d amplitudes (P=0.034); and 3) within the patient group, increased P3d amplitude enabled us to differentiate between future relapsers and nonrelapsers (P=0.026).
Conclusion: Our findings suggest that recently detoxified alcoholics are characterized by poorer response-inhibition skills that demand greater neural resources. We propose that event-related potentials can be used in conjunction with behavioral data to predict relapse; this would identify patients that need a higher level of neural resources when suppressing a response is requested.
Keywords: alcoholism, relapse, response inhibition, go/no-go task, ERPs, P3d
Introduction
Around 3%–8% of all global deaths and 4% of global disability-adjusted life years can be attributed to alcohol.1 Although the first step in the treatment of alcohol dependence (detoxification) is straightforward, the major problem faced by clinicians concerns the prevention of relapse. Between 40% and 70% of patients who undergo psychosocial therapies typically resume alcohol use within 1 year of treatment.2 Relapse is more likely to occur in the 3 months following the end of detoxification.3 Clinically, it is critical to identify mechanisms that can predict relapse to optimize postdetoxification treatments.4
Impaired inhibitory control is known to be a main variable that triggers relapse in alcohol-dependent individuals. Impairment of response inhibition (RI), the motor-behavior dimension of inhibitory control, defined as the inhibition of a preplanned motor response,5 makes it difficult for an individual to stop using alcohol and promotes the continuation of drinking.6 Assessing neural correlates of RI is useful, because RI is supported by the right prefrontal cortex in healthy individuals, a region known to be preferentially affected by alcohol ingestion.7 A common way to explore the neural processes underlying RI is the recording of event-related potentials (ERPs) during a “go/no-go” task. The task requires subjects to respond to frequent “go” trials, and to refrain from responding to rare “no-go” stimuli. This elicits two ERP components: the no-go N2, thought to reflect conflict monitoring,8 and the no-go P3, known to index the inhibition function.9 The “difference” wave (P3d) is calculated by subtracting go P3 from no-go P3, and is thought to express the “inhibitory” go/no-go effect.10,11 Previous findings suggest that no-go N2 seems to be unaffected by excessive alcohol intake,12–14 while effects on no-go P3 are more pronounced. Two types of abnormalities of inhibition-related neural substrates have been underlined in the alcohol-abuse field. On the one hand, a lack of inhibitory skills has been associated with decreased neural activation (indexed by decreased no-go P3 amplitudes) in alcohol abusers and their relatives compared with those of controls.13,15 On the other hand, successful inhibition responses in heavy drinkers have been linked to increased inhibition-related neural activity (indexed by increased no-go P3 amplitudes and higher prefrontal cortex activation) compared with controls, which reflect compensatory neurofunctional mechanisms allowing drinkers to achieve performance levels similar to those in controls.16,17 Recent studies have shown that electrophysiological recovery of inhibitory-control processes in drug abusers is a function of abstinence,18,19 strengthening the notion that disinhibition is a key process for maintaining alcohol addiction.20
Apart from RI impairment, alcohol-cue reactivity has also been suggested as a mechanism underlying the maintenance of alcohol dependence.21 Repeated alcohol consumption leads to alterations in dopamine levels and mesocorticolimbic sensitization, resulting in heightened incentive salience of stimuli associated with drinking.22 Contact with these attention-grabbing cues could guide patients to resume alcohol consumption after several years of abstinence.23 Accordingly, a few studies indicate that alcohol-cue reactivity is associated with relapse risk.4,24–26
Both cognitive mechanisms of behavioral control and alcohol-cue reactivity have long been investigated separately. However, numerous theories suggest that they interact with each other and act together to induce unreasonable consumption levels and reconsumption after abstinence.22,23,27 It is hypothesized that attention directed toward alcohol-related stimuli heightens the urge to drink, while impaired control mechanisms make it more difficult for alcoholics to resist these urges to consume alcohol.24 Therefore, alcohol consumption continues, despite well-known deleterious alcohol consumption-related consequences.28 To date, while this interaction has been demonstrated in heavy drinkers typically exhibiting more commission errors and differential brain activity in the presence of alcohol stimulations compared to light drinkers,14,29–32 evidence supporting decreased inhibitory skills while confronted with alcohol-related stimuli are mixed in alcohol-dependent patients,33,34 and data have not been linked with treatment outcomes. Evidence of the existence in relapsers (Rs) of these pathological cognitive features and their suggested interaction would have potential clinical impact, as it has been shown that training RI alters the evaluation of stimuli associated with a stopping response, and increases inhibitory control over these stimuli in heavy drinkers.35
We aimed to develop a technique for screening recently detoxified alcoholics to determine an individual’s risk of relapse. To achieve this, we used a variant of the go/no-go task,14 with long-lasting alcohol-related contexts or not (neutral, nonalcohol-related background), performed during an ERP recording known to be highly sensitive to even minor cognitive restrictions.36 We hypothesized that: 1) because of the imbalance between RI and alcohol-cue reactivity, patients would have a higher rate of commission errors than controls, particularly in the alcohol-related context; and 2) as patients would perform the inhibition task with greater difficulty than controls, correct inhibition responses would modulate the no-go P3 or the P3d component amplitudes compared to matched controls, while no-go N2 would be spared.12–14
Materials and methods
Participants
Inpatients diagnosed with alcohol dependence according to Diagnostic and Statistical Manual of Mental Disorders (DSM)-IV criteria were recruited as volunteers during the third week of their treatment from the Alcohol Detoxification Program of the Institute of Psychiatry, Brugmann Hospital (Brussels, Belgium). Healthy controls sex- and age-matched to alcohol-dependent patients were also recruited. Healthy individuals whose alcohol consumption exceeded 14 standard drinks/week (seven for women) or four drinks/day (three for women) were excluded because their consumption pattern placed them at risk for alcohol-related problems, according to the National Institute on Alcohol Abuse and Alcoholism.37 Exclusion criteria for both groups included current DSM-IV38 diagnosis of axis I disorders (other than alcohol dependence for patients) and of axis II, significant previous or current medical problems, visual impairment, head injury affecting the central nervous system, and current medical treatment that could interfere with and/or reduce the cognitive ability to perform the task. In our study, patients (n=27, seven females) were 20–68 years old, and controls (n=27, seven females) were 24–72 years old. Control participants abstained from alcohol consumption for at least 24 hours before testing. Participants in the patient group were tested prior to discharge, approximately 3 weeks after admission. The local ethics committee at Brugmann Hospital approved our study. Informed written consent was obtained from each participant.
Go/no-go task
We used the go/no-go task we previously developed14 to assess the modulation of inhibition by alcohol-related context. During the go/no-go task, participants were instructed to press a button with the thumb of their right hand, as fast and accurately as possible, whenever the letter M (go) was displayed, and to withhold pressing the button when the letter W (no-go) was displayed. Both letters were superimposed on pictorial backgrounds denoting three different emotional contexts. The neutral background (NC) was represented by a black screen, while two different alcohol-related pictures represented the alcohol background (AC), and two different nonalcohol-related pictures the nonalcohol background (NAC) (see Figure 1). The neutral background was displayed twice, and the order of all context presentation was counterbalanced across participants. Overall, the task comprised six separate stimulation blocks. In order to establish an ongoing response to be inhibited, each block contained 133 letters, divided into 93 go (70%) and 40 no-go (30%) letters. Go and no-go letters were displayed in a semirandom order to avoid the consecutive presentation of two no-go letters within each block. One to four go letters could precede no-go letters. Each task consisted of the presentation of a background screen (black for NC, or AC or NAC; 500 ms), then the letter M or W appeared on this background screen for 200 ms, followed by a return to the initial background screen (1,300 ms). Therefore, subjects had a maximum of 1,500 ms to press the button before the next letter appeared. Participants were asked to look at the center of the screen continuously and to refrain from moving and blinking during blocks to reduce interference caused by movements.
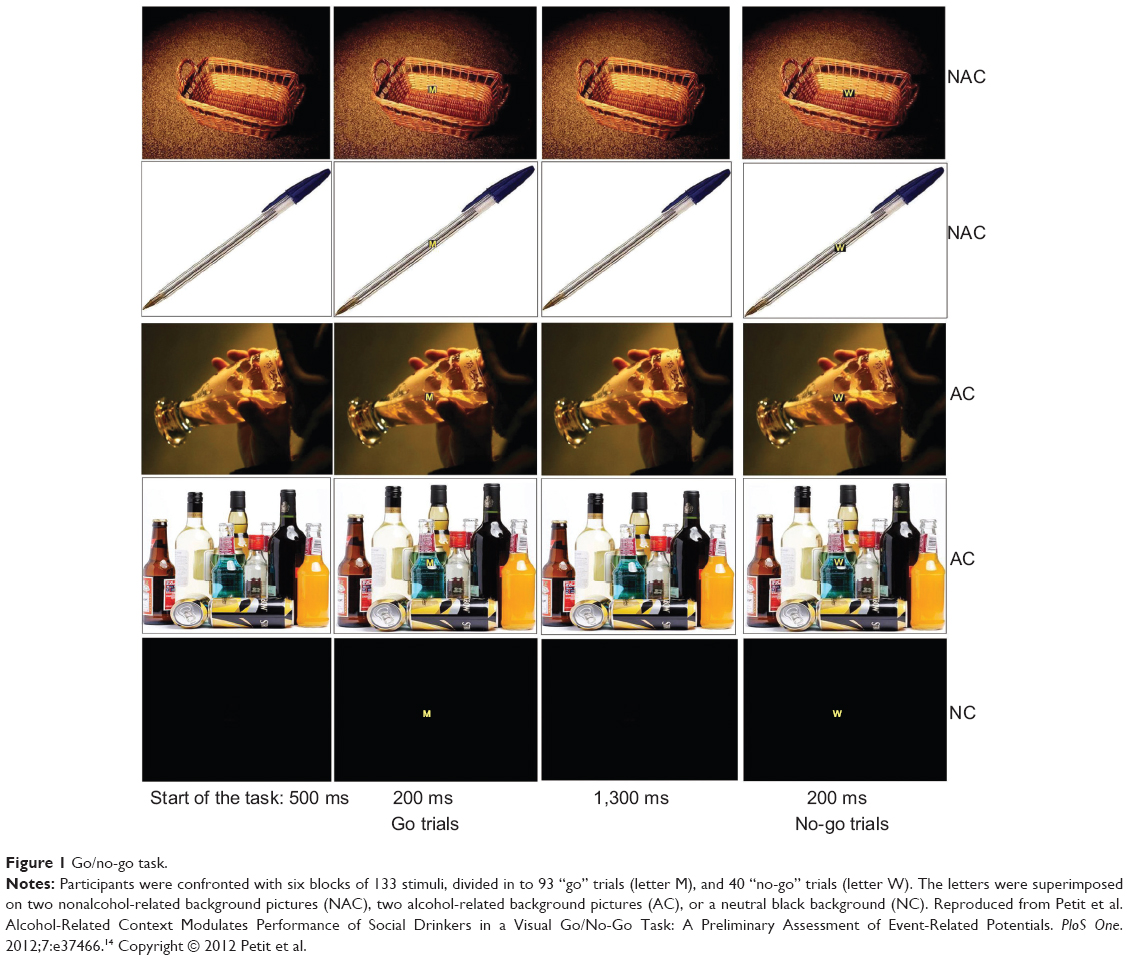 | Figure 1 Go/no-go task. |
Procedure
Participants were instructed to rate their urge to drink alcohol at the commencement of the study using a 100 mm visual analog scale.39 Next, participants sat in a darkened room on a chair approximately 1 m from a computer screen. The go/no-go task was administered after a practice block. Following the task, participants were asked to assess their craving scale and complete the following questionnaires: the Alcohol Use Disorder Identification Test (AUDIT40); the UPPS (urgency [lack of], premeditation, perseverance [lack of], sensation seeking) impulsive behavior scale,41 a measure of impulsivity as a personality trait; the State-Trait Anxiety Inventory (STAI42); the Beck Depression Inventory (BDI43); and a questionnaire about alcohol and other drug consumption (history, characteristics, and degree of family history of alcoholism [FHA], if any).
Relapse evaluation
For alcohol-dependent individuals, a 3-month follow-up was conducted to gather information about drinking behavior once the detoxification program had ceased. Relapse was defined as the reinstallation of a state of alcohol dependence according to DSM-IV criteria, and treated as a binary outcome variable.44,45 According to Wiers et al44 unique reconsumption that did not exceed 3 days and after which the patient recovered control without further negative consequences was not defined as proper relapse. Information was obtained by telephone, and supplied directly by patients, family members, or the patient’s regular doctor.
Electroencephalography recordings
Electric brain potentials were recorded during the go/no-go task using 32 electrodes mounted on a Quik-Cap (ANT® Neuro, Eenschede, the Netherlands) and placed in a standard 10–20 system at intermediate positions. A common physically linked mastoid reference was used; data were later re-referenced to the average value for this common reference.46 Battery-operated amplifiers with a gain of 30,000 and a band pass of 0.01–100 Hz (ANT Neuro, Enschede, the Netherlands) were used. The impedance of all electrodes was kept under 10 kV, with the ground electrode (AFz) positioned between the frontoparietal zero electrode (Fpz) and frontal zero electrode (Fz) along the midline. Electroencephalography was recorded continuously at a sampling rate of 1,024 Hz with eeprobe™ software (ANT® Neuro, Eenschede, the Netherlands). Trials disrupted by eye movements or muscular artifacts were manually eliminated offline using the procedure developed by Semlitsch et al.47 Epochs were created from −200 ms to 800 ms after the onset of stimuli (−200 to 0 was considered the prestimulus baseline). Data were filtered with a 30 Hz low-pass filter.
Data collection
Three stimulus aspects were recorded: trial type (go or no-go); context (NC, AC, or NAC); and the response (key press for go stimuli, no key press for no-go stimuli). For each participant and context, average ERP waves were separately calculated at sites for go and no-go tasks. Incorrect responses (miss for go, or false alarm for no-go) were excluded from electroencephalography analyses. The maximum peak amplitudes of the go and no-go N2 along with the go and no-go P3 components were recorded. The no-go N2 was defined as the greatest negative value within the 200–300 ms interval after stimulus onset, and was studied in a cluster of frontoparietocentral electrodes (FC1, FC2, Cz, CP1, CP2, and Pz).48–50 The no-go P3 was defined as the greatest positive value within the 300–500 ms interval after stimulus onset, and was studied at the same cluster of electrodes.48–50 To highlight the specific inhibitory no-go effect, difference waveforms were calculated by subtracting the average go waveform from the average no-go waveform (no-go – go waveform).11,49–51
Statistical analysis
We analyzed ERP and behavioral data using analysis of covariance (ANCOVA). Simple effects were explored, and interaction sources were systematically examined. Student’s t-tests and Bonferroni post hoc t-tests were used where appropriate. Logistic regression analyses were used to examine predictors of relapse within the follow-up period. All analyses were conducted with SPSS 17.02 (SPSS, Chicago, IL, USA), with the level of significance at 0.05.
Results
Demographic and clinical variables
We summarized the characteristics of all patients and controls in this study (Table 1). Patients reported higher degrees of impulsivity (ie, UPPS score) and FHA than controls. It is known that compared to individuals without FHA, individuals with FHA are more impulsive52 and show differential brain responses to stimuli associated with alcohol.53 So as not to confound the roles of the variables studied, we included the degree of FHA as a covariate in subsequent analyses of the inhibition task, along with impulsivity level.
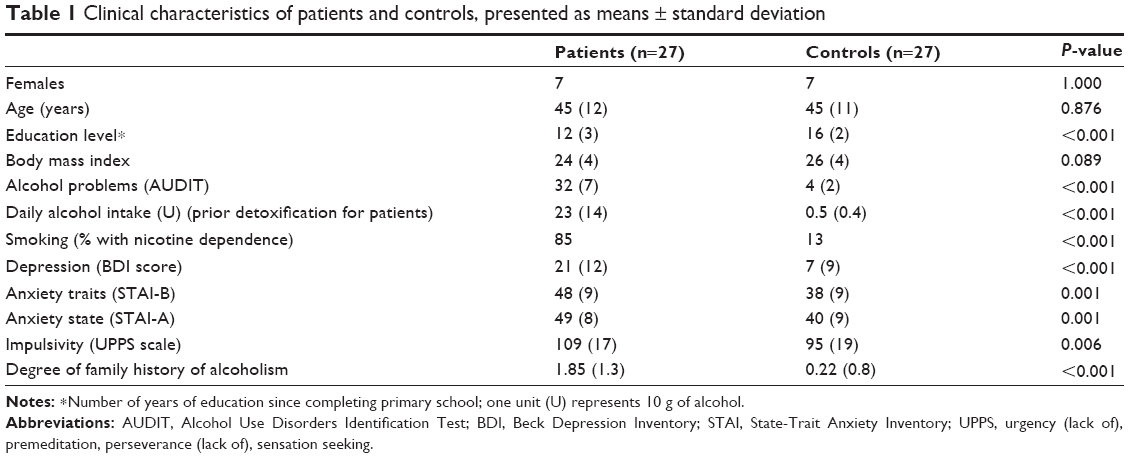 | Table 1 Clinical characteristics of patients and controls, presented as means ± standard deviation |
Inhibition task
The results of the go/no-go task will be presented in the form of questions related to the hypotheses presented in the Introduction section.
Do patients and controls differ in their performance in the go/no-go task?
We compared the inhibitory capacities of the patient and control groups for our modified go/no-go task. Behavioral outcomes of performance on the inhibition task included omission-error rates (no response in go trials), commission-error rates (key press in no-go trials), and reaction times (RTs) to go stimuli. Omission and commission errors were divided by the number of trials and converted into percentages. We conducted ANCOVAs separately on error rates and RTs using the patient and control groups as the between-subject factor. The two within-subject factors of interest were trial type (go versus no-go) and context (AC versus NAC versus NC). That is, a trial type × context × group ANCOVA with FHA and UPPS as covariates was used to analyze behavioral accuracy during the go/no-go task and a context × group ANCOVA with FHA and UPPS as covariates was used to analyze RTs in go trials (see Table 2).
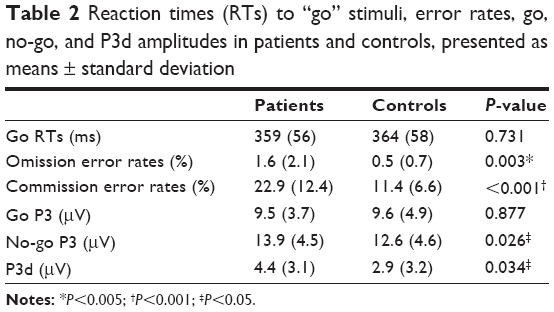 | Table 2 Reaction times (RTs) to “go” stimuli, error rates, go, no-go, and P3d amplitudes in patients and controls, presented as means ± standard deviation |
According to error rates, a main effect of the trial type was observed (F1,50=5.775, P=0.020; η2=0.104, observed power =0.654), showing that all participants were less accurate in no-go than go trials (17.2% versus 1.11%, respectively). There was also an effect for group (F1,50=16.834, P<0.001; η2=0.252, observed power =0.980), which indicated that overall task performance was less accurate in patients than in controls (error rates were 13.2% and 5.1%, respectively), independent of context. Finally, a significant trial type × group effect was found (F1,53=13.437, P=0.001; η2=0.212, observed power =0.949). To clarify this interaction, we performed two separate ANCOVAs for go and no-go accuracy scores. Analysis of go trials showed a main effect for group, indicating that patients made more omission errors than controls (F1,50=9.546, P=0.003; η2=0.160, observed power =0.858). Analysis of no-go trials showed a robust group effect, suggesting that patients also made more commission errors than controls (F1,50=15.501, P<0.001; η2=0.237, observed power =0.971). However, differences between patients and controls were more pronounced in no-go trials: the difference in error rates for no-go trials between patients and controls was significantly higher than that for go trials in both groups (11.48% versus 1.07%, t26=−4.248; P<0.001). No significant effect was observed for RTs in conjunction with any of the variables studied (P>0.293). Effects due to context, UPPS, and FHA were not observed in our analyses.
What is the neurophysiological counterpart of this behavioral difference?
To investigate whether poor inhibition capacity observed in patients was associated with abnormal electrophysiological activity, we conducted ANCOVAs similar to those for error rates, with an additional six-level within-subject factor, ie, electrode (FC1, FC2, Cz, CP1, CP2, Pz), on the classical electrophysiological correlates of the go/no-go task, N2 and P3 components.49
For P3 amplitudes, we observed a main effect of trial type (F1,50=8.97, P=0.004; η2=0.152, observed power =0.836), and a trial type × group interaction (F1,50=4.741, P=0.034; η2=0.087, observed power =0.570). In all participants, the more difficult (less accurately performed) inhibition-response process assessed in no-go trials was associated with higher no-go P3 peaks (mean 13.29 μV) compared to the easier activation-response process, linked to lower go P3 peaks (mean 9.60 μV). By collapsing data from contexts and electrodes, paired t-tests were secondly used in order to untangle the interaction. The patient and control groups did not differ with respect to amplitudes in go trials (P=0.877); however, the patient group demonstrated higher amplitudes in no-go trials compared with controls (t26=2.309, P=0.026). On this basis, in order to isolate the inhibition go/no-go process per se, referred to as P3d,11,50,51,54 we finally performed an analysis on NoGo minus Go waveform, in order to verify whether a group effect specifically affecting P3d was also observable. This showed a group effect indicating that the P3d was larger in patients compared to controls (F1,50=4.762, P=0.034; η2=0.087, observed power =0.572). In other words, we observed equal go P3 amplitudes between groups, combined with increased no-go P3 amplitudes in patients compared to controls, giving rise to a statistically different P3d waveform. Original go/no-go P3 and P3d waves are represented in Figure 2. Analysis of N2 amplitudes did not reveal any significant effects that could be attributed to any of the variables studied (P>0.140).
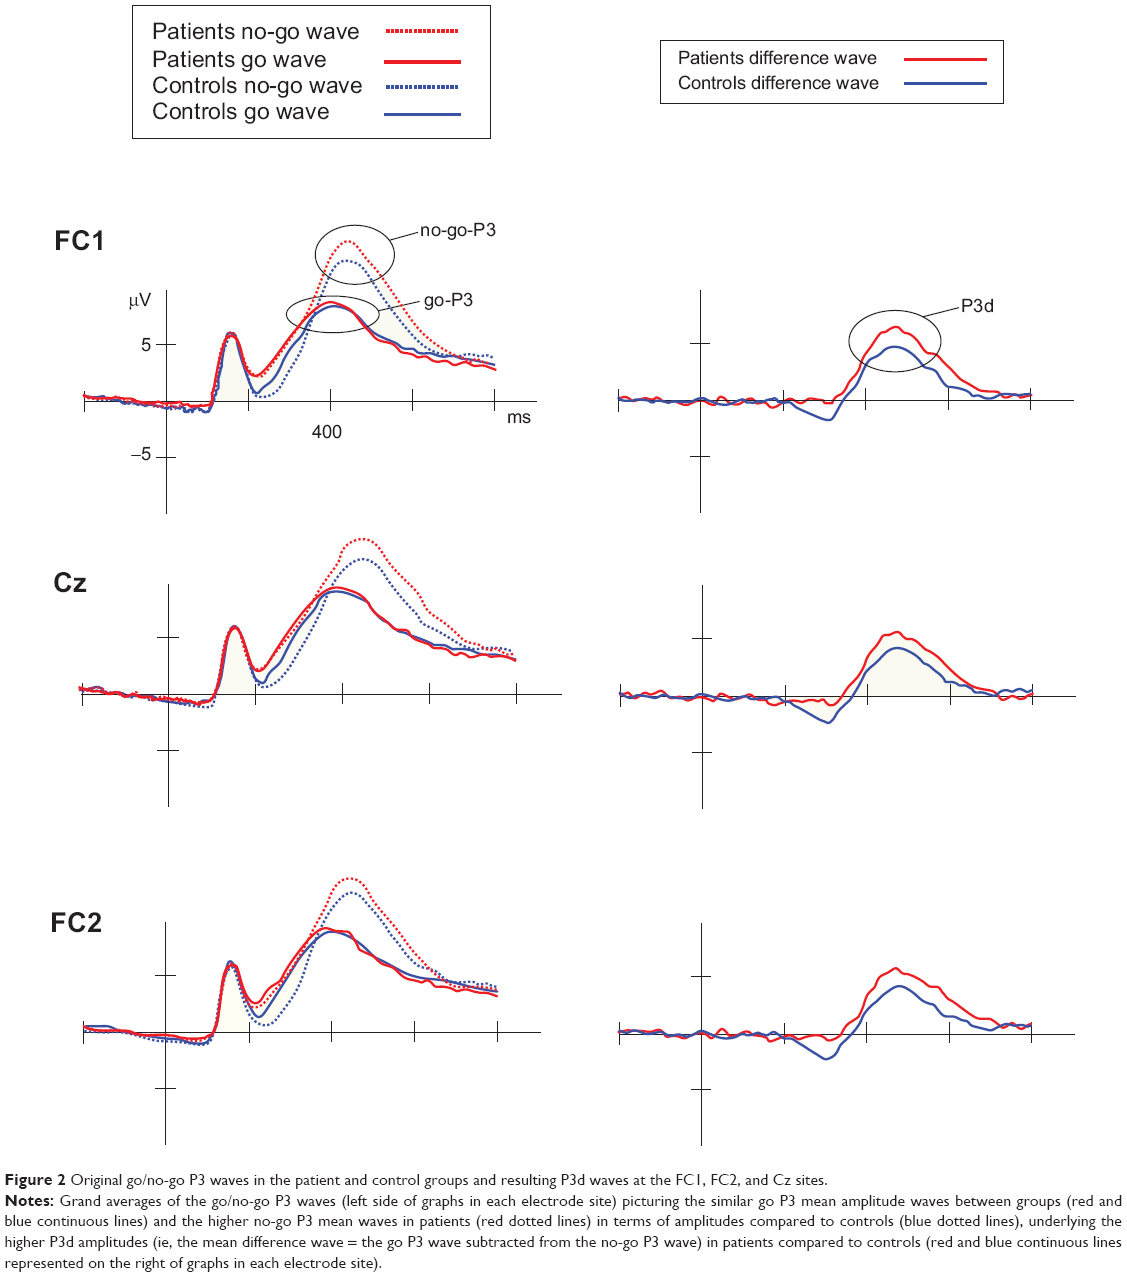 | Figure 2 Original go/no-go P3 waves in the patient and control groups and resulting P3d waves at the FC1, FC2, and Cz sites. |
Can we distinguish relapsers from nonrelapsers on the basis of response inhibition?
In this study, an RI deficit was assessed between patients and controls at two levels: behavioral and neurophysiological. Therefore, we wondered respectively whether patients who reported relapse to drinking within the 3-month follow-up period, ie, the Rs, would perform worse than patients who did not relapse, ie, the nonrelapsers (NRs), and whether the mean P3d amplitude would be even more important in Rs compared to NRs.
Within the 3-month follow-up period, 48% (13 of 27) of patients relapsed. Of the 27 patients, six reported consuming one or more sips of alcohol without losing control and without dropping back into a state of dependence. These six patients were then included in the group of NRs (n=14). The clinical and demographic characteristics of Rs and NRs are summarized in Table 3. Apart from age, variables were consistent between the two groups. ANCOVA analyses were thus systematically reconducted with age as an additional covariate, in order to check for a possible influence of age on the results.
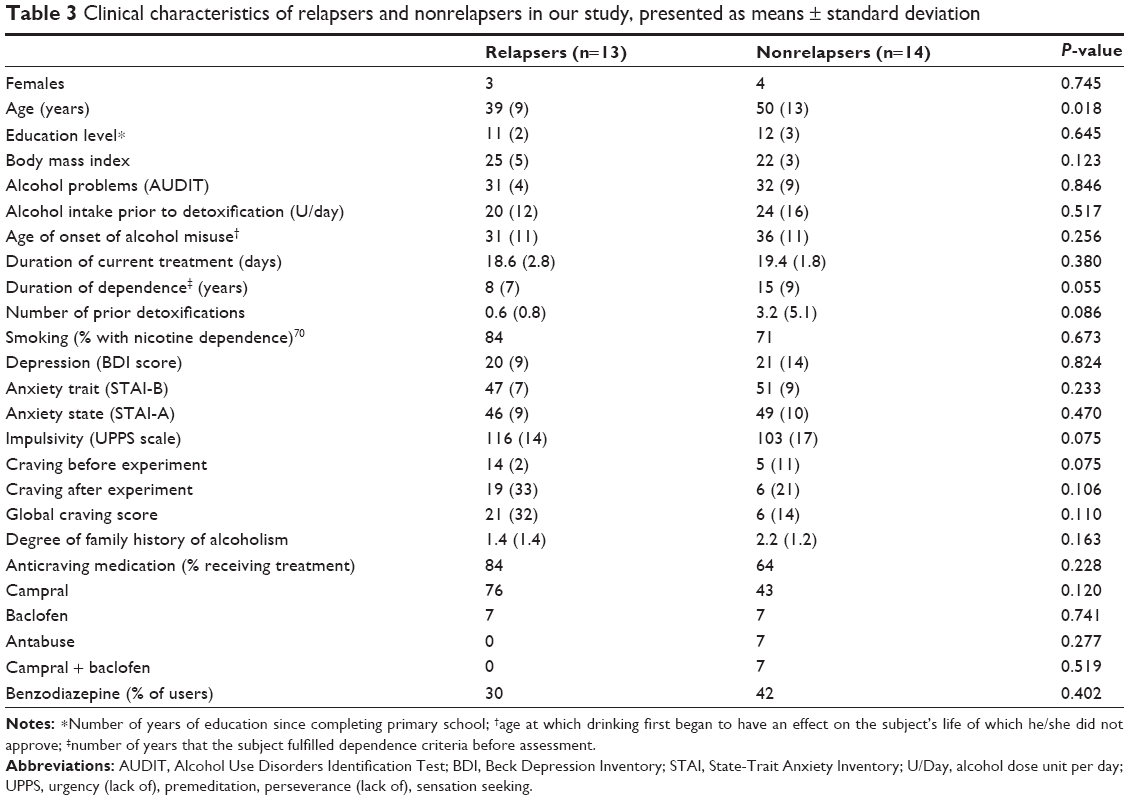 | Table 3 Clinical characteristics of relapsers and nonrelapsers in our study, presented as means ± standard deviation |
We first computed a trial × context × group ANCOVA on error rates and RTs with age, FHA, and UPPS as covariates (see Table 4). The results were negative, as no significant group effects were observed for either error rates (P=0.313) or RTs (P=0.530). Secondly, we conducted similar ANCOVAs on the P3d component, as this difference wave indexed the inhibition go/no-go deficit per se in patients. The context × group (Rs versus NRs) ANCOVA on P3d showed a group effect indicating that the P3d was larger in Rs compared to NRs (F1,23=5.673, P=0.026; η2=0.198, observed power =0.626). Accordingly, an ANCOVA on P3d amplitudes with a three-level group variable (control, R, NR) revealed that the Rs’ P3d amplitudes were significantly higher than those of the controls (P=0.012) whereas the NRs’ P3d amplitudes were not (P=0.1). P3d waves of the three groups are represented in Figure 3. Individually, ten of the 13 Rs showed mean P3d amplitudes that were higher than those of controls (2.9 μV). Effects due to context and other covariates (UPPS, FHA, and age) were not found in these analyses.
 | Table 4 Reaction times (RTs) to “go” stimuli, error rates, and P3d amplitudes in nonrelapsers and relapsers, presented as means ± standard deviation |
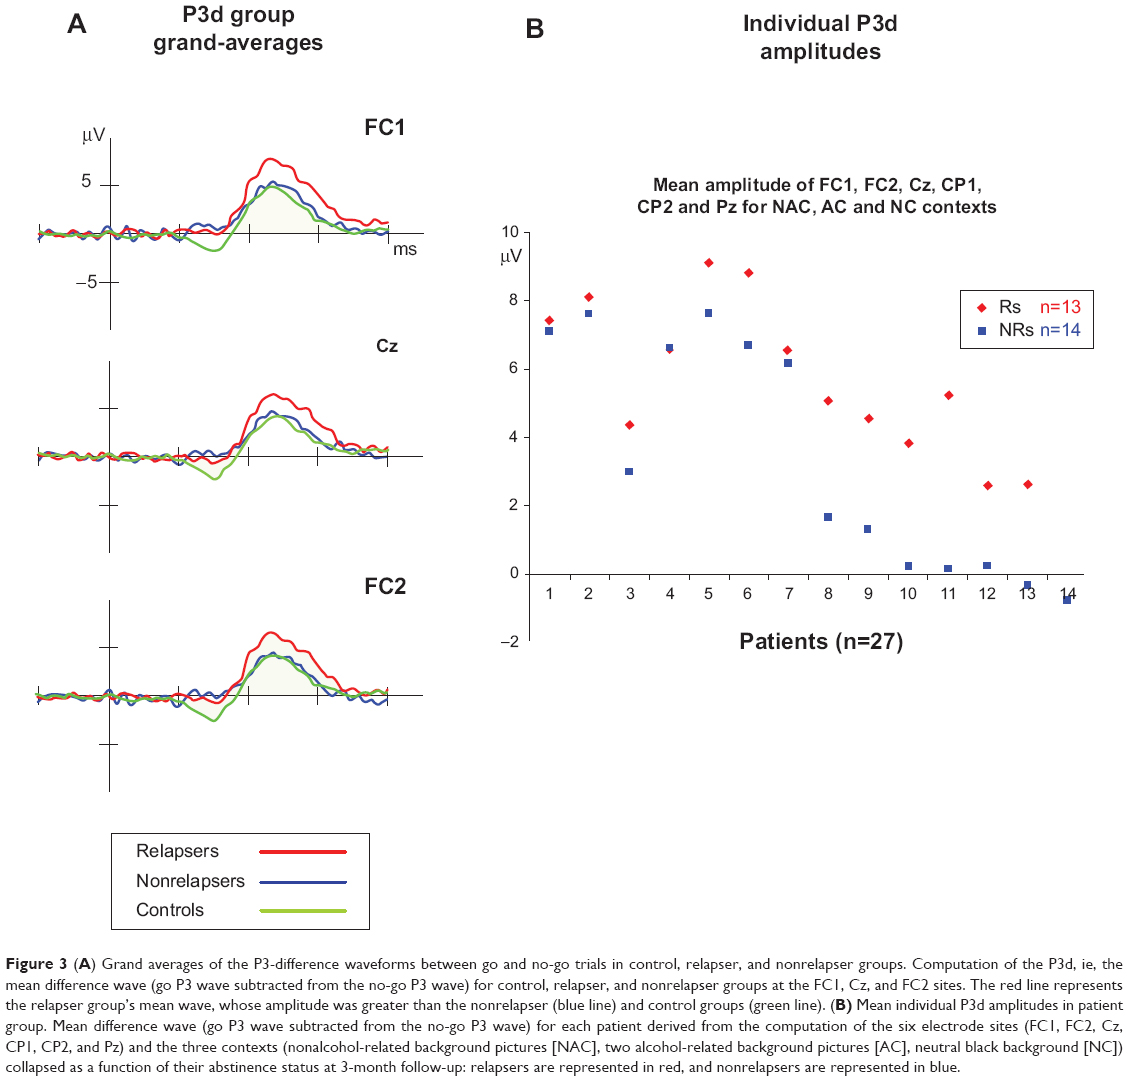 | Figure 3 (A) Grand averages of the P3-difference waveforms between go and no-go trials in control, relapser, and nonrelapser groups. Computation of the P3d, ie, the mean difference wave (go P3 wave subtracted from the no-go P3 wave) for control, relapser, and nonrelapser groups at the FC1, Cz, and FC2 sites. The red line represents the relapser group’s mean wave, whose amplitude was greater than the nonrelapser (blue line) and control groups (green line). (B) Mean individual P3d amplitudes in patient group. Mean difference wave (go P3 wave subtracted from the no-go P3 wave) for each patient derived from the computation of the six electrode sites (FC1, FC2, Cz, CP1, CP2, and Pz) and the three contexts (nonalcohol-related background pictures [NAC], two alcohol-related background pictures [AC], neutral black background [NC]) collapsed as a function of their abstinence status at 3-month follow-up: relapsers are represented in red, and nonrelapsers are represented in blue. |
Finally, logistic regression analyses were performed to ascertain to what extent electrophysiological substrates of RI (the P3d) predicted relapse and time to relapse to drinking within the 3-month follow-up. First, logistic regression revealed that P3d amplitude was the only variable that independently and significantly predicted the odds of relapse. This latter increased by a factor of 1.62 for each additional microvolt in the P3d amplitude. Table 5 depicts the logistic regression results.
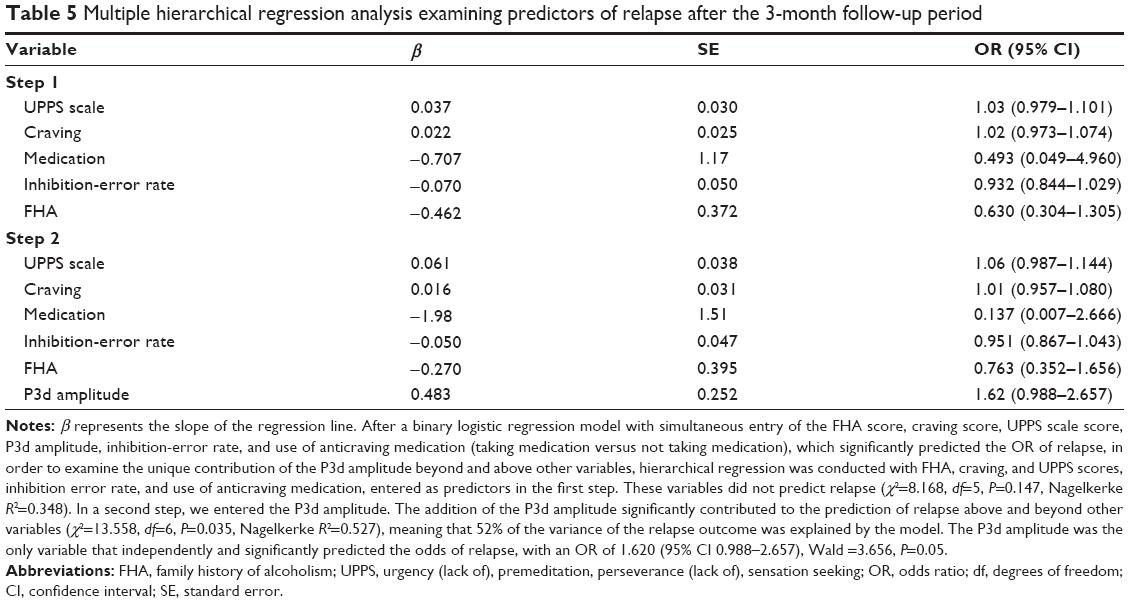 | Table 5 Multiple hierarchical regression analysis examining predictors of relapse after the 3-month follow-up period |
Secondly, the Cox regression model with a backward Wald stepwise elimination procedure for time to relapse using the same covariates as in the multiple regression analysis showed that P3d amplitude and the UPPS score constituted the best predictors of relapse, as they significantly predicted the timing of relapse. Patients with higher UPPS score and/or greater P3d amplitude were respectively 1.032 and/or 1.220 times more likely to relapse, and relapse sooner, than those with lower UPPS score and P3d amplitude. Table 6 depicts the Cox regression results.
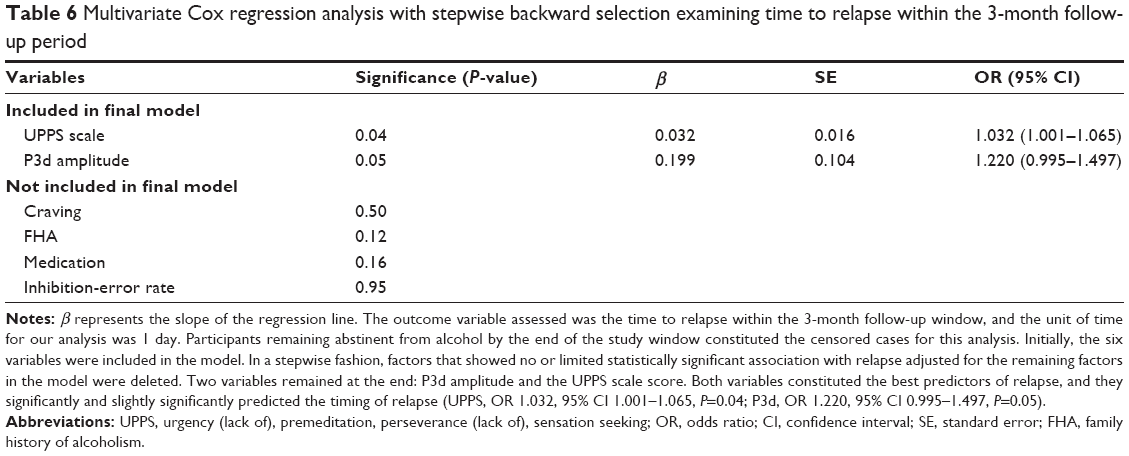 | Table 6 Multivariate Cox regression analysis with stepwise backward selection examining time to relapse within the 3-month follow-up period |
Discussion
In our work reported here, we confirmed that when confronted with a go/no-go task, recently detoxified alcoholic patients committed more commission errors than matched controls. However, this was independent of the context. Alcohol-related contexts did not increase the error rate in patients. This previously described observation55,56 corresponds with recent data suggesting that alcohol-cue reactivity might be reduced57 or even inverted25,45,58–60 through detoxification; therefore, its impacts upon inhibitory skills could be decreased. The reduction of alcohol-cue reactivity has been explained as the result of an active avoidance strategy of alcohol cues deployed in patients trying to remain abstinent and aware of the negative consequences of alcohol, rendering it undesirable.58 Overt, unrestrained bias toward alcohol-related stimuli58,60,61 and influence of alcohol cues on inhibition62–64 observed to the contrary in heavy and social drinkers would be explained by the fact that alcohol is not seen as a problem in this population, and no avoiding strategies are meant to be set up.
Our major aim was to complement findings on inhibitory neural processes with neural correlates obtained through ERPs, and to assess whether these could predict relapse during a 3-month follow-up period. When they correctly inhibited a response, patients required more neural resources than controls, as shown by increased P3d. Increases in P3 amplitude are commonly interpreted as indicators that increased cognitive resources are being recruited for inhibition.11,16,48,50,65,66 The larger P3d amplitude in patients may hence attest to the need for additional neural resources recruitment required to perform the task correctly. Kamarajan et al13 noted that alcoholics exhibited significantly lower P3 amplitudes under no-go and go conditions, implying deficient processing of both RI and activation. This divergence could be attributed to the clinical severity of alcohol dependence, to task differences, and/or to a positive effect of detoxification. Further research is required to assess inhibitory skills in alcohol-dependent patients.
Though evidence of a relationship between measures of impulsive action or choice and the propensity to relapse have been accumulating with regard to tobacco-smoking dependence,67–73 few previous studies have revealed indices of inhibitory control to be predictive of relapse in alcohol dependence. A pilot study by Bowden-Jones et al74 showed that recently detoxified alcoholics were more likely to relapse within 3 months if they scored higher in a behavioral task of impulsive choice. Evren et al75 found that impulsivity traits appeared to be somewhat related with craving and relapse. Any link so far has remained mainly speculative with respect to alcohol dependence, impulsive patients, and treatment outcomes.
In this study, we established a link between P3d increase in patients and relapse. A comparison of Rs and NRs revealed that both groups had similar error rates. The P3d generated by Rs was significantly higher than that produced by NRs. Predicted Rs needed to activate more cognitive resources during the inhibition process to perform RIs. P3d amplitude significantly predicted relapse above all other factors, with level of impulsivity and P3d magnitude predictive of time to relapse.
Our study results are preliminary, given the small number of subjects included and the resulting low power in our results, as well as the short time frame of the follow-up period. Besides RI, error processing represents another important dimension of impulsivity.76 It has also been found to be compromised in impulsive populations and in addictive pathologies in particular, as indexed by reduced error-related negativity and/or error-positivity amplitude.76–79 These components thus certainly deserve to be investigated in further studies focusing on inhibition in relapse prediction. Analysis of failed inhibition trials will also help us to confirm our present hypothesis of enhanced P3d amplitudes as the reflection of an increased recruitment of resources to perform inhibition. Provided that attention, focus and motivation are correlated with good completion of the task, increased P3d in successful trials would suggest that an enhanced P3d amplitude indexes a necessity of increased resources being recruited as compared to healthy controls. Therefore, for instance when the task is more complex, too many resources will be needed in relapsing patients, and will prevent them from accurately performing the task. To this aim, the use of paradigms enabling the observation of a more significant amount of errors (high enough to permit ERP analyses with a good signal-to-noise ratio), eg, through time pressure, will be necessary.
In conclusion, our findings provide new evidence of altered neuronal activity during inhibition processes that are associated with heightened proneness to relapse, and highlight the fundamental usefulness of neuroimaging techniques to appropriately appraise underlying neural processes of a cognitive function.80 We suggest conducting more comprehensive studies in future to confirm that increased P3d amplitudes after detoxification are reliable biological indicators of relapse. Obviously, a crucial next step before our measures can be applied in a clinical setting will be to establish normal P3d values and move from links between group-level with treatment outcomes/relapse to individual-level prediction. Also, in real life, life events, environmental triggers, and motivational factors have an influence on inhibition fluctuation, and their interaction with inhibition capacities may contribute to substance use. Future research should include other factors that may interact with poor inhibitory control in order to be more ecological. Clinically, individuals identified as particularly at risk of relapse could be directed to postdetoxification treatments, with the aim of improving cognitive control through neuropsychological rehabilitation programs.35
Acknowledgment
Géraldine Petit and Salvatore Campanella are Research Fellow and Research Associate, respectively, at the Belgian Fund of Scientific Research (FRS-FNRS).
Disclosure
The authors report no conflicts of interest in this work.
References
Prince M, Patel V, Saxena S, et al. No health without mental health. Lancet. 2007;370:859–877. | ||
Finney JW, Hahn AC, Moos RH. The effectiveness of inpatient and outpatient treatment for alcohol abuse: the need to focus on mediators and moderators of setting effects. Addiction. 1996;91:1773–1796. | ||
Pelc I, Verbanck P, Le Bon O, et al. Efficacy and safety of acamprosate in the treatment of detoxified alcohol-dependent patients. A 90-day placebo-controlled dose-finding study. Br J Psychiatry. 1997;171: 73–77. | ||
Garland EL, Franken IH, Howard MO. Cue-elicited heart rate variability and attentional bias predict alcohol relapse following treatment. Psychopharmacology (Berl). 2012;222:17–26. | ||
Eagle DM, Bari A, Robbins TW. The neuropsychopharmacology of action inhibition: cross-species translation of the stop-signal and go/no-go tasks. Psychopharmacology (Berl). 2008;199:439–456. | ||
Field M, Kiernan A, Eastwood B, Child R. Rapid approach responses to alcohol cues in heavy drinkers. J Behav Ther Exp Psychiatry. 2008;39: 209–218. | ||
Oscar-Berman M, MarinkovićK. Alcohol: effects on neurobehavioral functions and the brain. Neuropsychol Rev. 2007;17:239–257. | ||
Zhang W, Lu J. Time course of automatic emotion regulation during a facial Go/NoGo task. Biol Psychol. 2012;89:444–449. | ||
Smith JL, Johnstone SJ, Barry RJ. Movement-related potentials in the Go/NoGo task: the P3 reflects both cognitive and motor inhibition. Clin Neurophysiol. 2008;119:704–714. | ||
Kopp B, Mattler U, Goertz R, Rist F. N2, P3 and the lateralized readiness potential in a NoGo task involving selective response priming. Electroencephalogr Clin Neurophysiol. 1996;99:19–27. | ||
Yang B, Yang S, Zhao L, Yin L, Liu X, An S. Event-related potentials in a Go/NoGo task of abnormal response inhibition in heroin addicts. Sci China C Life Sci. 2009;52:780–788. | ||
Ridderinkhof KR, de Vlugt Y, Bramlage A, et al. Alcohol consumption impairs detection of performance errors in mediofrontal cortex. Science. 2002;298:2209–2211. | ||
Kamarajan C, Porjesz B, Jones KA, et al. Alcoholism is a disinhibitory disorder: neurophysiological evidence from a Go/NoGo task. Biol Psychol. 2005;69:353–373. | ||
Petit G, Kornreich C, Noël X, Verbanck P, Campanella S. Alcohol-related context modulates performance of social drinkers in a visual Go/NoGo task: a preliminary assessment of event-related potentials. PloS One. 2012;7:e37466. | ||
Kamarajan C, Porjesz B, Jones KA, et al. Spatial-anatomical mapping of NoGo-P3 in the offspring of alcoholics: evidence of cognitive and neural disinhibition as a risk for alcoholism. Clin Neurophysiol. 2005;116:1049–1061. | ||
López-Caneda E, Cadaveira F, Crego A, et al. Hyperactivation of right inferior frontal cortex in young binge drinkers during response inhibition: a follow-up study. Addiction. 2012;107:1796–1808. | ||
Wetherill RR, Squeglia LM, Yang TT, Tapert SF. A longitudinal examination of adolescent response inhibition: neural differences before and after the initiation of heavy drinking. Psychopharmacology (Berl). 2013;230:663–671. | ||
Bell RP, Foxe JJ, Ross LA, Garavan H. Intact inhibitory control processes in abstinent drug abusers (I): A functional neuroimaging study in former cocaine addicts. Neuropharmacology. Epub 2 013 Mar 6. | ||
Morie KP, Garavan H, Bell RP, De Sanctis P, Krakowski MI, Foxe JJ. Intact inhibitory control processes in abstinent drug abusers (II): A high-density electrical mapping study in former cocaine and heroin addicts. Neuropharmacology. Epub 2013 Mar 16. | ||
Noël X, Van der Linden M, Schmidt N, et al. Supervisory attentional system in nonamnesic alcoholic men. Arch Gen Psychiatry. 2001;58:1152–1158. | ||
Field M, Cox WM. Attentional bias in addictive behaviors: a review of its development, causes, and consequences. Drug Alcohol Depend. 2008;97:1–20. | ||
Robinson TE, Berridge KC. Incentive-sensitization and addiction. Addiction. 2001;96:103–114. | ||
Robinson TE, Berridge KC. Addiction. Annu Rev Psychol. 2003; 54:25–53. | ||
Cox WM, Hogan LM, Kristian MR, Race JH. Alcohol attentional bias as a predictor of alcohol abusers’ treatment outcome. Drug Alcohol Depend. 2002;68:237–243. | ||
Townshend JM, Duka T. Avoidance of alcohol-related stimuli in alcohol-dependent inpatients. Alcohol Clin Exp Res. 2007;31:1349–1357. | ||
Fryer SL, Jorgensen KW, Yetter EJ, et al. Differential brain response to alcohol cue distractors across stages of alcohol dependence. Biol Psychol. 2013;92:282–291. | ||
Goldstein RZ, Volkow ND. Drug addiction and its underlying neurobiological basis: neuroimaging evidence for the involvement of the frontal cortex. Am J Psychiatry. 2002;159:1642–1652. | ||
Noël X, Bechara A, Brevers D, Verbanck P, Campanella S. Alcoholism and the loss of willpower: a neurocognitive perspective. J Psychophysiol. 2010;24:240–248. | ||
Weafer J, Fillmore MT. Comparison of alcohol impairment of behavioral and attentional inhibition. Drug Alcohol Depend. 2012;126:176–182. | ||
Zack M, Woodford TM, Tremblay AM, Steinberg L, Zawertailo LA, Busto UE. Stress and alcohol cues exert conjoint effects on go and stop signal responding in male problem drinkers. Neuropsychopharmacology. 2011;36:445–458. | ||
Muraven M, Shmueli D. The self-control costs of fighting the temptation to drink. Psychol Addict Behav. 2006;20:154–160. | ||
Nikolaou K, Field M, Duka T. Alcohol-related cues reduce cognitive control in social drinkers. Behav Pharmacol. 2013;24:29–36. | ||
Noël X, Van der Linden M, d’Acremont M, et al. Alcohol cues increase cognitive impulsivity in individuals with alcoholism. Psychopharmacology (Berl). 2007;192:291–298. | ||
Mainz V, Drüke B, Boeker M, Kessel R, Gauggel S, Forkmann T. Influence of cue exposure on inhibitory control and brain activation in patients with alcohol dependence. Front Hum Neurosci. 2012;6: 1–13. | ||
Houben K, Nederkoorn C, Wiers RW, Jansen A. Resisting temptation: decreasing alcohol-related affect and drinking behavior by training response inhibition. Drug Alcohol Depend. 2011;116:132–136. | ||
Rugg MD, Coles MGH. The ERP and cognitive psychology: conceptual issues. In: Rugg MD, Coles MGH, editors. Electrophysiology of Mind: Event-Related Potentials and Cognition. Oxford: Oxford University Press; 1995:27–39. | ||
Office of Applied Studies, Substance Abuse and Mental Health Services Administration. Figure 7.3: Illicit drug or alcohol dependence or abuse, by age group and substance: 2002–2004. 2005. Available from: http://www.oas.samhsa.gov/NSDUH/2k4NSDUH/2k4results/2k4results.htm#fig7.3. Accessed May 5, 2014. | ||
American Psychiatric Association. Diagnostic and Statistical Manual of Mental Disorders. 4th ed. Washington: APA; 1994. | ||
van den Wildenberg E, Wiers RW, Dessers J, et al. A functional polymorphism of the μ-opioid receptor gene (OPRM1) influences cue-induced craving for alcohol in male heavy drinkers. Alcohol Clin Exp Res. 2007;31:1–10. | ||
Saunders JB, Aasland OG, Babor TF, de la Fuente JR, Grant M. Development of the Alcohol Use Disorders Identification Test (AUDIT): WHO Collaborative Project on Early Detection of Persons with Harmful Alcohol Consumption – II. Addiction. 1993;88:791–804. | ||
Whiteside SP, Lynam DR. Understanding the role of impulsivity and externalizing psychopathology in alcohol abuse: application of the UPPS impulsive behavior scale. Exp Clin Psychopharmacol. 2003;11: 210–217. | ||
Spielberger CD, Gorsuch RL, Lusthene RE. Manual for the State and Trait Anxiety Inventory. Palo Alto (CA): Consulting Psychologist; 1983. | ||
Beck AT, Steer RA, Brown GK. Manuel de l’Inventaire de Depression de Beck. 2nd ed. Toronto: Psychological Corporation; 1998. | ||
Wiers RW, Eberl C, Rinck M, Becker ES, Lindenmeyer J. Retraining automatic action tendencies changes alcoholic patients’ approach bias for alcohol and improves treatment outcome. Psychol Sci. 2011;22:490–497. | ||
Spruyt A, De Houwer J, Tibboel H, et al. On the predictive validity of automatically activated approach/avoidance tendencies in abstaining alcohol-dependent patients. Drug Alc Depend. 2013;127:81–86. | ||
Bertrand O, Perrin F, Pernier J. A theoretical justification of the average reference in topographic evoked potential studies. Electroencephalogr Clin Neurophysiol. 1985;62:462–464. | ||
Semlitsch HV, Anderer P, Schuster P, Presslich O. A solution for reliable and valid reduction of ocular artifacts, applied to the P300 ERP. Psychophysiology. 1986;23:695–703. | ||
Pfefferbaum A, Ford JM, Weller BJ, Kopell BS. ERPs to response production and inhibition. Electroencephalogr Clin Neurophysiol. 1985;60:423–434. | ||
Falkenstein M, Koshlykova NA, Kiroj VN, Hoormann J, Hohnsbein J. Late ERP components in visual and auditory Go/NoGo tasks. Electroencephalogr Clin Neurophysiol. 1995;96:36–43. | ||
Kiefer M, Marzinzik F, Weisbrod M, Hoormann J, Hohnsbein J. The time course of brain activations during response inhibition: evidence from event-related potentials in a go/no go task. Neuroreport. 1998;9:765–770. | ||
Falkenstein M, Hoormann J, Hohnsbein J. ERP components in Go/NoGo tasks and their relation to inhibition. Acta Psychol (Amst). 1999;101: 267–291. | ||
Acheson A, Richard DM, Mathias CW, Dougherty DM. Adults with a family history of alcohol related problems are more impulsive on measures of response initiation and response inhibition. Drug Alcohol Depend. 2011;117:198–203. | ||
Kareken DA, Bragulat V, Dzemidzic M, Cox C, Talavage T, Davidson D. Family history of alcoholism mediates the frontal response to alcoholic drink odors and alcohol in at-risk drinkers. Neuroimage. 2010;50: 267–276. | ||
Hatem SM, Plaghki L, Mouraux A. How response inhibition modulates nociceptive and non-nociceptive somatosensory brain-evoked potentials. Clin Neurophysiol. 2007;118:1503–1516. | ||
Mainz V, Drüke B, Boecker M, Kessel R, Gauggel S, Forkmann T. Influence of cue exposure on inhibitory control and brain activation in patients with alcohol dependence. Front Hum Neurosci. 2012;6:92. | ||
Luijten M, Littel M, Franken IHA. Deficits in inhibitory control in smokers during a Go/Nogo task: an investigation using event-related brain potentials. PLoS One. 2011;6:1–7. | ||
Flaudias V, Brousse G, de Chazeron I, Planche F, Brun J, Llorca PM. Treatment in hospital for alcohol-dependent patients decreases attentional bias. Neuropsychiatr Dis Treat. 2013;9:773–779. | ||
Noël X, Colmant M, Van Der Linden M, et al. Time course of attention for alcohol cues in abstinent alcoholic patients: the role of initial orienting. Alcohol Clin Exp Res. 2006;30:1871–1877. | ||
Stormark KM, Field NP, Hugdahl K, Horowitz M. Selective processing of visual alcohol cues in abstinent alcoholics: an approach-avoidance conflict? Addict Behav. 1997;22:509–519. | ||
Vollstädt-Klein S, Loeber S, von der Goltz C, Mann K, Kiefer F. Avoidance of alcohol-related stimuli increases during the early stage of abstinence in alcohol-dependent patients. Alcohol Alcohol. 2009;44:458–463. | ||
Field M, Eastwood B. Experimental manipulation of attentional bias increases the motivation to drink alcohol. Psychopharmacology (Berl). 2005;183:350–357. | ||
Rose AK, Duka T. Effects of alcohol on inhibitory processes. Behav Pharmacol. 2008;19:284–291. | ||
Kreusch F, Vilenne A, Quertemont E. Response inhibition toward alcohol-related cues using an alcohol go/no-go task in problem and non-problem drinkers. Addict Behav. 2013;38:2520–2528. | ||
Muraven M, Shmueli D. The self-control costs of fighting the temptation to drink. Psychol Addict Behav. 2006;20:154–160. | ||
Albert J, López-Martín S, Carretié L. Emotional context modulates response inhibition: neural and behavioral data. Neuroimage. 2010;49:914–921. | ||
Dong G, Zhou H, Zhao X. Impulse inhibition in people with Internet addiction disorder: electrophysiological evidence from a Go/NoGo study. Neurosci Lett. 2010;485:138–142. | ||
Doran N, Spring B, McChargue D, Pergadia M, Richmond M. Impulsivity and smoking relapse. Nicotine Tob Res. 2004;6:641–647. | ||
Krishnan-Sarin S, Reynolds B, Duhig AM, Pergadia M, Richmond M. Behavioral impulsivity predicts treatment outcome in a smoking cessation program for adolescent smokers. Drug Alcohol Depend. 2007;88:79–82. | ||
Yoon JH, Higgins ST, Heil SH, Sugarbaker RJ, Thomas CS, Badger GJ. Delay discounting predicts postpartum relapse to cigarette smoking among pregnant women. Exp Clin Psychopharmacol. 2007;15:176–186. | ||
MacKillop J, Kahler CW. Delayed reward discounting predicts treatment response for heavy drinkers receiving smoking cessation treatment. Drug Alcohol Depend. 2009;104:197–203. | ||
Powell J, Dawkins L, West R, Powell J, Pickering A. Relapse to smoking during unaided cessation: clinical, cognitive and motivational predictors. Psychopharmacology (Berl). 2010;212:537–549. | ||
Billieux J, Gay P, Rochat L, Khazaal Y, Zullino D, Van der Linden M. Lack of inhibitory control predicts cigarette smoking dependence: evidence from a non-deprived sample of light to moderate smokers. Drug Alcohol Depend. 2010;112:164–167. | ||
Wegmann L, Buhler AO, Strunk M, Lang P, Nowak D. Smoking cessation with teenagers: the relationship between impulsivity, emotional problems, program retention and effectiveness. Addict Behav. 2012;37:463–468. | ||
Bowden-Jones H, McPhillips M, Rogers R, Hutton S, Joyce E. Risk-taking on tests sensitive to ventromedial prefrontal cortex dysfunction predicts early relapse in alcohol dependency: a pilot study. J Neuropsychiatry Clin Neurosci. 2005;17:417–420. | ||
Evren C, Durkaya M, Evren B, Dalbudak E, Cetin R. Relationship of relapse with impulsivity, novelty seeking and craving in male alcohol-dependent inpatients. Drug Alcohol Rev. 2012;31:81–90. | ||
Littel M, van den Berg I, Luijten M, van Rooij AJ, Keemink L, Franken IH. Error processing and response inhibition in excessive computer game players: an event-related potential study. Addict Biol. 2012;17: 934–947. | ||
Franken IH, van Strien JW, Franzek EJ, van de Wetering BJ. Error-processing deficits in patients with cocaine dependence. Biol Psychol. 2007;5:45–51. | ||
Sokhadze E, Stewart C, Hollifield M, Tasman A. Event-related potential study of executive dysfunctions in a speeded reaction task in cocaine addiction. J Neurother. 2008;12:185–204. | ||
Luijten M, Van Meel CS, Franken IH. Diminished error processing in smokers during smoking cue exposure. Pharmacol Biochem Behav. 2011;97:514–520. | ||
Wilkinson D, Halligan P. The relevance of behavioural measures for functional-imaging studies of cognition. Nat Rev Neurosci. 2004;5: 67–73. |
 © 2014 The Author(s). This work is published and licensed by Dove Medical Press Limited. The full terms of this license are available at https://www.dovepress.com/terms.php and incorporate the Creative Commons Attribution - Non Commercial (unported, v3.0) License.
By accessing the work you hereby accept the Terms. Non-commercial uses of the work are permitted without any further permission from Dove Medical Press Limited, provided the work is properly attributed. For permission for commercial use of this work, please see paragraphs 4.2 and 5 of our Terms.
© 2014 The Author(s). This work is published and licensed by Dove Medical Press Limited. The full terms of this license are available at https://www.dovepress.com/terms.php and incorporate the Creative Commons Attribution - Non Commercial (unported, v3.0) License.
By accessing the work you hereby accept the Terms. Non-commercial uses of the work are permitted without any further permission from Dove Medical Press Limited, provided the work is properly attributed. For permission for commercial use of this work, please see paragraphs 4.2 and 5 of our Terms.