")
Back to Journals » International Journal of Nanomedicine » Volume 9 » Issue 1
Nanouric acid or nanocalcium phosphate as central nidus to induce calcium oxalate stone formation: a high-resolution transmission electron microscopy study on urinary nanocrystallites
Authors Gao J, Xue J, Xu M, Gui B, Wang F, Ouyang J
Received 11 April 2014
Accepted for publication 4 July 2014
Published 16 September 2014 Volume 2014:9(1) Pages 4399—4409
DOI https://doi.org/10.2147/IJN.S66000
Checked for plagiarism Yes
Review by Single anonymous peer review
Peer reviewer comments 2
Jie Gao,1 Jun-Fa Xue,2 Meng Xu,2 Bao-Song Gui,1 Feng-Xin Wang,2 Jian-Ming Ouyang2
1Department of Nephrology, the Second Hospital of Xi’an Jiaotong University, Xi’an, People’s Republic of China; 2Institute of Biomineralization and Lithiasis Research, Jinan University, Guangzhou, People’s Republic of China
Purpose: This study aimed to accurately analyze the relationship between calcium oxalate (CaOx) stone formation and the components of urinary nanocrystallites.
Method: High-resolution transmission electron microscopy (HRTEM), selected area electron diffraction, fast Fourier transformation of HRTEM, and energy dispersive X-ray spectroscopy were performed to analyze the components of these nanocrystallites.
Results: The main components of CaOx stones are calcium oxalate monohydrate and a small amount of dehydrate, while those of urinary nanocrystallites are calcium oxalate monohydrate, uric acid, and calcium phosphate. The mechanism of formation of CaOx stones was discussed based on the components of urinary nanocrystallites.
Conclusion: The formation of CaOx stones is closely related both to the properties of urinary nanocrystallites and to the urinary components. The combination of HRTEM, fast Fourier transformation, selected area electron diffraction, and energy dispersive X-ray spectroscopy could be accurately performed to analyze the components of single urinary nanocrystallites. This result provides evidence for nanouric acid and/or nanocalcium phosphate crystallites as the central nidus to induce CaOx stone formation.
Keywords: nanocrystallites, calcium oxalate stones, heterogeneous nucleation, HRTEM, EDS
Introduction
Calcium oxalate (CaOx) stone formation is the most common cause of urolithiasis.1–3 Most CaOx stones lack definite causes, making it difficult to prevent. Currently, it is considered to be the result of multiple factors. The urine excretion of high oxalate, high calcium, high uric acid, and low citrate are all important risk factors of renal stone formation.
Regardless of urine pH, CaOx crystals can still be formed. A previous study has shown that calcium oxalate monohydrate (COM) formation was closely related with hyperoxaluria, whereas calcium oxalate dihydrate (COD) formation was closely related with hypercalciuria.4
The formation process of CaOx stones involves nucleation, growth, agglomeration, and cell adhesion.5,6 The properties of urinary crystallites were found to be closely related to renal stone formation in the urine.7–9 In addition, COM content was found to be greater in urinary crystallites of patients with renal stones, while COD was found to be greater in control subjects.
Scanning electron microscopy (SEM) and transmission electron microscopy (TEM) have been widely used to study and simulate in vitro the biominerals involved in urolithiasis.10–13 For instance, SEM–energy dispersive X-ray spectroscopy (EDS) was used to analyze the chemical element distribution in the surface and interior layers of CaOx stones.
CaOx stones often have a core–shell structure. Previous reports detected the components and elements on the surface and interior layer of stones by using Fourier transform infrared spectroscopy (FT-IR), SEM-EDS, and thermogravimetric analysis (TGA) and then predicted the formation mechanism of stones based on the difference of these two components. For example, Fazil Marickar et al10 studied chemical element distribution on the surface and interior layer of CaOx–calcium phosphate (CaP) mixed stones by SEM-EDS, indicating that the main component in its interior layer was CaOx and CaP, whereas that on the surface was CaOx. Thus, they deduced that CaP crystals maybe induced the development of COM crystals by heterogeneous nucleations. The in vitro simulation experiment showed that CaP and uric acid (UA) crystals induced the development of COM crystals through heterogeneous nucleation.14,15
Lee et al13 performed TGA and EDS to identify the components in the surface and interior layers of magnesium ammonium phosphate calculi. The results showed that the major elements in the surface layer were primarily composed of C (43.75%), O (50.31%), and Ca (5.24%); P (0.07%) and Mg (0.24%) were present in low amounts, whereas no traces of N were found. By contrast, the major elements found in the interior layer were C (28.72%), N (7.01%), O (49.16%), P (6.51%), Mg (4.12%), and Ca (4.48%). These results were confirmed by TGA, which showed that the components in the interior layer of the sample contained 64% magnesium ammonium phosphate and 36% apatite, while its surface layer contained CaOx. This can be explained by the combination of PO43−, CO32−, and NH4+ in the urine with Mg2+ in the surface of a bacterial capsule, then precipitated struvite CaP in the presence of bacterial capsule, which served as nucleation, growth, and aggregation sites for struvite crystals, whereas CaP crystals could induce the development of CaOx crystals by heterogeneous nucleations.16
For UA stones, EDS detected the prominent absorption peaks of C (41.92%), N (38.64%), and O (19.62%).13 In addition, the prominent peaks of S, C, O, and Ca were observed by EDS for cystine calculi.12 These findings, combined with the results from FT-IR, showed that the sample contained COM and cystine.
High-resolution transmission electron microscopy (HRTEM), selected area electron diffraction (SAED), fast Fourier transformation (FFT), and EDS were performed to study the components of urinary nanocrystallites in urine of nine patients with CaOx calculi, and the influence of components of urinary crystallites on stone formation was discussed.
Materials and methods
Reagents and instruments
Absolute ethanol and sodium azide (NaN3) were of analytical purity. Glass vessels were cleaned with double-distilled water.
TEM was conducted on an HRTEM (JEOL 2100F) with a maximum acceleration voltage of 200 kV and lattice resolution of 0.19. To determine the morphology, component, element, and crystal structure of urinary nanocrystallites, we performed HRTEM, FFT, SAED, and EDS of the HRTEM. FFT analysis in the Digital Micrograph software was also conducted to obtain the patterns. X-ray diffraction (XRD) results were recorded using a D/max 2,400 X-ray diffractometer (Rigaku, Tokyo, Japan) with Ni-filtered Cu Ka radiation (k=1.54 A°) at a scanning rate of 2° min−1 (40 kV, 30 mA). The divergence and scattering slit was 1° for the range of 5°<2θ<60°.
Collection, treatment, and component detection of stones
CaOx stones were collected from nine patients with calculi after surgery, disinfected with 75% alcohol, cleared with distilled water, and placed in a dust-free incubator at 45°C to dry. The urinary stones were then ground to powder by an agate mortar for XRD characterization. It was shown that the main component of these nine stones was CaOx.
Collection and treatment of urinary nanocrystallites
Fasting morning urine samples were collected. The pH value was detected, and 2% NaN3 solution (10 mL/L urine sample) was added to these urine samples as antiseptic. Anhydrous alcohol was added to the urine sample [V(urine):V(ethanol) =3:2]. Ethanol can provide hydrogen and oxygen groups of hydroxyl to form hydrogen bonds with proteins and then destroy the original hydrogen bonds in proteins. This process caused the denaturation and precipitation of proteins. After the urine proteins and insoluble substances (such as cell debris and red blood cells) were removed by centrifugation at 4,000 r/m for 15 minutes, the urine sample was filtered by a microporous membrane with a pore size of 1.2 μm to eliminate the influence of large-sized urinary crystallites. After large-sized crystals were filtered out, the filtrated urine was suitable for the study of nanocrystallites.
HRTEM, SAED, FFT, and EDS analyses of urinary nanocrystallites
After the filtered urine sample was subjected to ultrasound treatment for 5 minutes, approximately 5 μL of urine was submerged in a copper mesh by a microsyringe, and the urine was preliminarily dried using absorbent paper from the back of the mesh so as to remove most of the water in urine. After such a treatment, most of the soluble salts (such as NaCl and urea) in urine were sucked off with the urine by the paper. Then the mesh was stored in a desiccator for 2 days prior to HRTEM, SAED, FFT, and EDS analyses.
Determination of urinary biochemical parameters
The main urinary biochemical parameters of all these patients and healthy people were detected by standard methods reported.17 The data are listed in Table 1. The concentrations of Ca2+ and Mg2+ were measured by flame atomic absorption spectrometry.18 Urine oxalate was detected by a classic permanganate–oxalate oxidation reduction reaction method.19 UA content was detected by spectrophotometry by exploiting the ability of UA to reduce Fe (III) into Fe (II) and the ability of Fe (II) to coordinate with phenanthroline yielding orange–red complexes.20 Citrate content was detected using the oxidation of citrate in urine to pentabromoacetone by nascent Br of pentabromoacetone in petroleum ether and reaction with thiourea–borax solution,21 and the golden yellow-colored layer is measured with a blue–violet filter (Klett No 42) in a spectrophotometer at 445 nm. Glycosaminoglycan (GAG) content was detected by Alcian Blue colorimetric method.22 Phosphate was measured by colorimetric method (molybdate) using a spectrum automated analyzer.23 Urine creatinine was determined using a modified Jaffé method performed on an automated analyzer.24
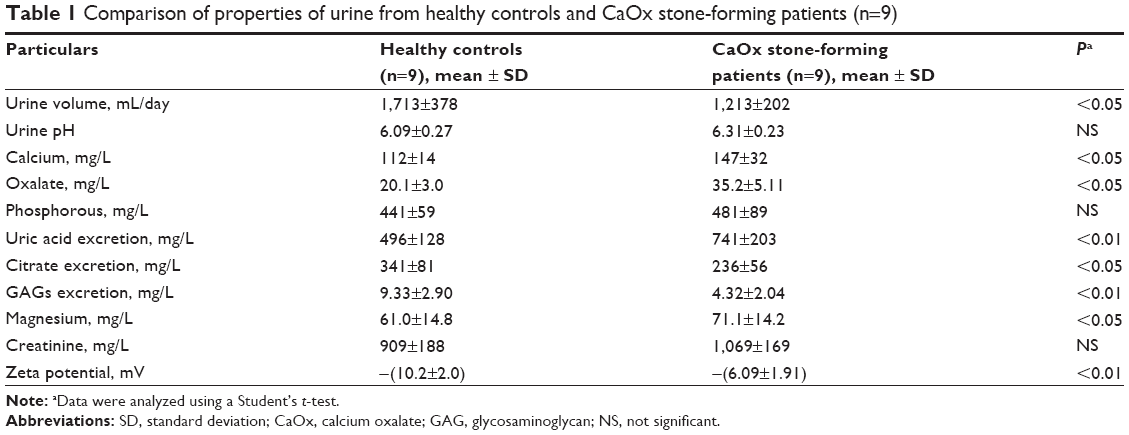 | Table 1 Comparison of properties of urine from healthy controls and CaOx stone-forming patients (n=9) |
Results
XRD analysis of CaOx stones
Figure 1 shows the XRD spectra of the stones from two representative patients with CaOx stones. We detected the peaks at d=5.93, 3.65, 2.97, 2.49, 2.35, 2.26, 2.07, and 1.98 Å, which were assigned to ( 01), (020), (
 02), (112), (130), (202), (321), and (
 03) planes of COM crystal (powder diffraction file (PDF) card number 20-0231),25 respectively. We also detected the peaks at d=6.18 and 2.24 Å, which were assigned to (200) and (213) planes of COD (PDF card number 17-0541), respectively. That is, the main components of CaOx stones were found to be COM and a small amount of COD.
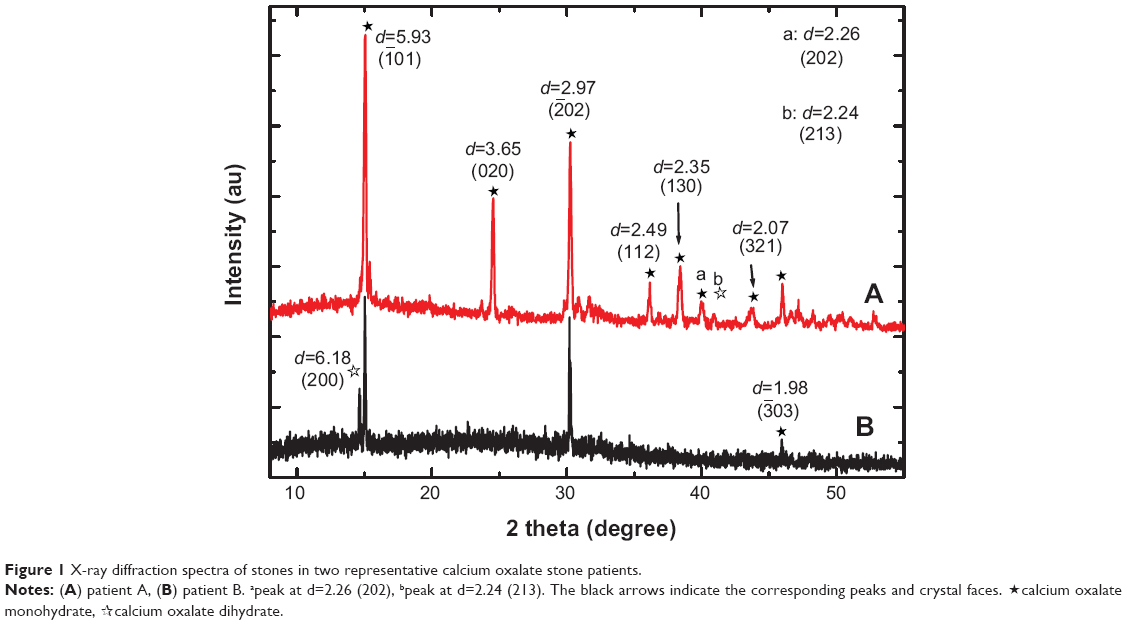 | Figure 1 X-ray diffraction spectra of stones in two representative calcium oxalate stone patients. |
Urinary biochemical parameters in patients with CaOx calculi
Table 1 shows the main biochemical parameters in the urine of nine patients with CaOx calculi and nine healthy subjects. The concentrations of calcium, oxalate, phosphorus, UA, magnesium, and creatinine in the urine of the patients were significantly higher than those of the controls. In contrast, the citrate and GAG excretions of the patients were significantly lower than those of the controls. These results indicated that the formation of CaOx calculi was closely related to hyperuricosuria, hyperoxaluria, and the lack of crystallization inhibitors such as citrate and GAGs in urine also increased the risk of renal calculi formation.
Furthermore, the absolute value of zeta potential of the patients with CaOx stones was smaller than that of the controls. This result indicated that the urinary crystallites of the patients were easier to aggregate than those of the controls. The increase of creatinine concentration in the urine of the patients also indicated that the renal function of the patients was abnormal.
HRTEM observation of urinary nanocrystallites
The morphology of urinary nanocrystallites in patients with CaOx stones was observed by HRTEM (Figure 2). Their particle sizes were <100 nm, and some crystallites were evidently aggregated. In our previous study with urinary nanocrystallites,26 we observed classic hexagonal COM and bipyramidal COD for the urinary crystallites with a size of a few hundred nanometers. However, in the present study, we have only observed spherical COM and COD for the urinary crystallites with a size of dozens of nanometers. These small-sized particles have high interface energy; therefore, they appeared spherical in shape and were easy to aggregate.
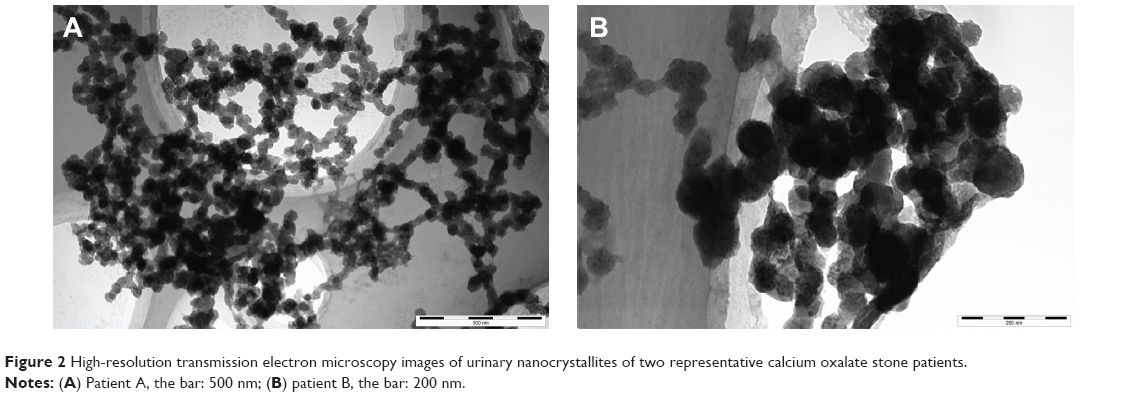 | Figure 2 High-resolution transmission electron microscopy images of urinary nanocrystallites of two representative calcium oxalate stone patients. |
FFT analysis of urinary nanocrystallites
Figure 3 shows the images obtained from HRTEM and FFT in different areas of the urinary nanocrystallites. To analyze the clear lattice fringes, we simultaneously detected the presence of UA and COM (Figure 3A). In the interior region, the submaximal diffraction peak of UA crystal (d=3.23 Å) was detected and was assigned to the (021) plane of UA (PDF card number 31-1982).25 In the surrounding area, the submaximal diffraction peak of COM (d=3.65 Å) was detected and was assigned to the (020) plane of COM.
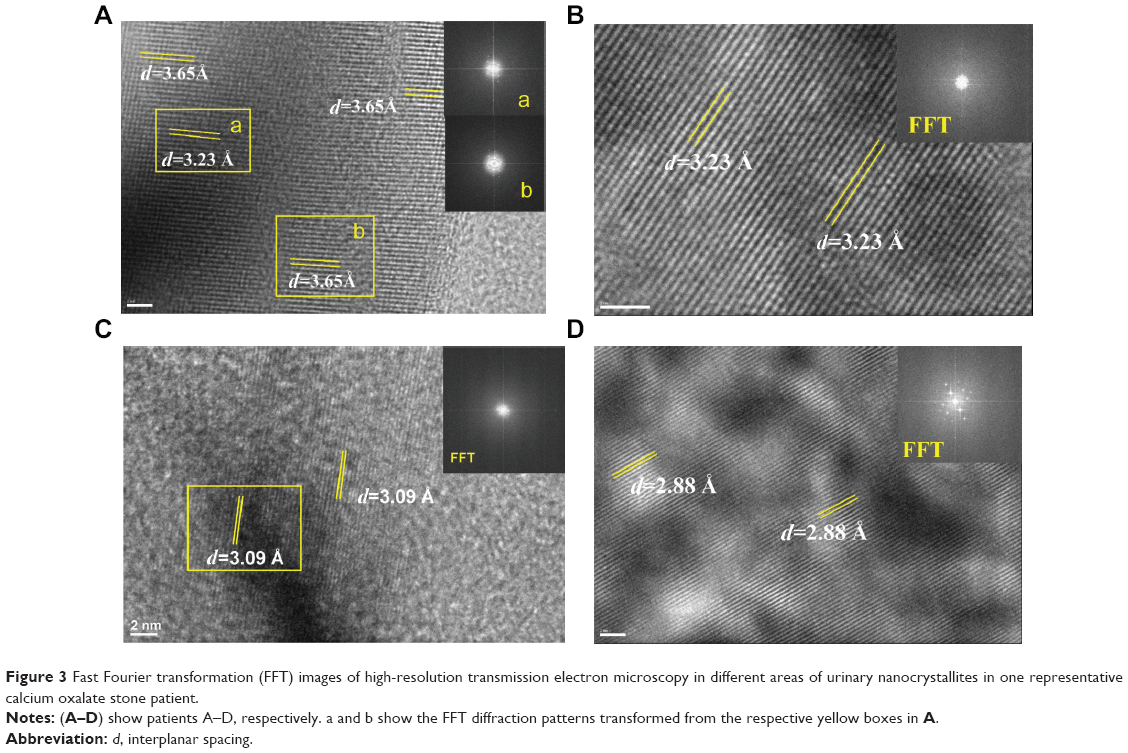 | Figure 3 Fast Fourier transformation (FFT) images of high-resolution transmission electron microscopy in different areas of urinary nanocrystallites in one representative calcium oxalate stone patient. |
We detected the strongest diffraction peaks of UA crystal in Figure 3B and C, respectively. The peaks at d=3.23 and 3.09 Å were assigned to the (021) and (21) planes of UA, respectively. The strongest diffraction peak of CaP crystal was detected in Figure 3D. The peak at d=2.88 Å was assigned to the (0210) plane of CaP. Therefore, the main components of urinary nanocrystallites found in patients with CaOx stones were UA, COM, and CaP.
SAED analysis of urinary nanocrystallites
SAED was carried out to further characterize the components of urinary nanocrystallites (Figure 4). The appearance of a series of diffraction points or diffraction rings demonstrated that the sample was either a single crystal or a multicrystal.27,28 The diffraction data were indexed and compared with the PDF card.25 The attributes of the diffraction points or diffraction rings are listed in Table 2.
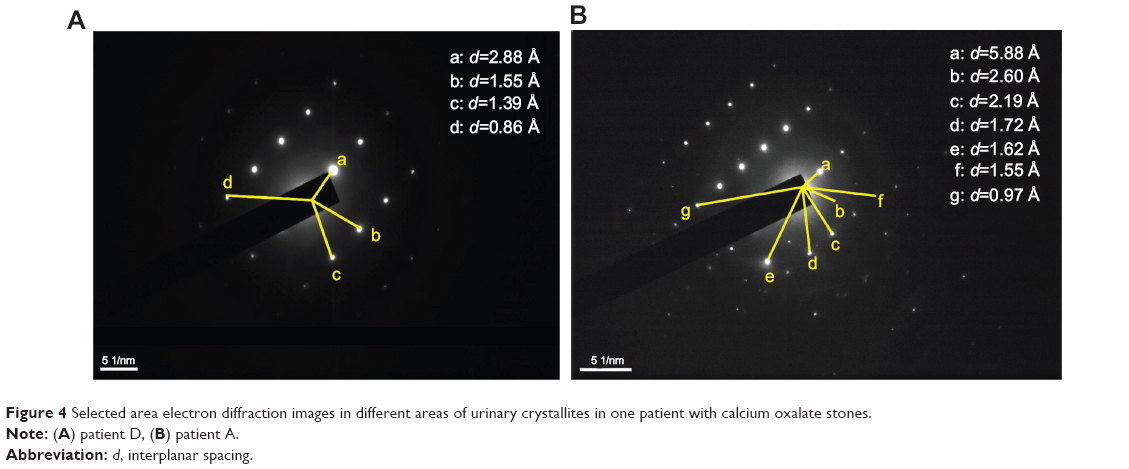 | Figure 4 Selected area electron diffraction images in different areas of urinary crystallites in one patient with calcium oxalate stones. |
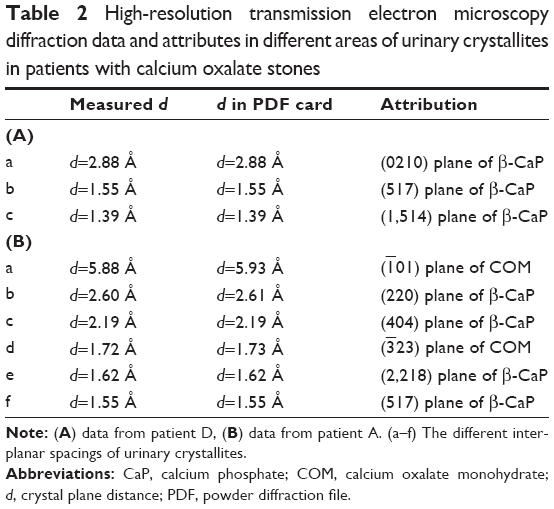 | Table 2 High-resolution transmission electron microscopy diffraction data and attributes in different areas of urinary crystallites in patients with calcium oxalate stones |
In the SAED pattern, we detected an interplanar spacing of d=2.88 Å, which was assigned to the strongest plane (0210) of CaP (PDF card number 09-0169).25 We also detected interplanar spacings of d=2.60, 2.19, 1.62, 1.55, and 1.39 Å, which were assigned to the (220), (404), (2,218), (517), and (1,514) planes of CaP. Interplanar spacings of d=5.88 and 1.72 Å were also detected and assigned to the (01) and (23) planes of COM, respectively.
Different components of urinary crystallites in the interior region and surrounding region
In order to further study the influence of urinary nanocrystallite components on CaOx calculi formation, the components of the interior region and surrounding region of a urinary crystallite of about 100 nm (Figure 5) were comparatively studied. In the FFT image of the surrounding region of urinary crystallite (Figure 5B), we detected interplanar spacings of d=2.96, 2.49 Å, which were assigned to the (02) and (112) planes of COM, whereas in the interior region (Figure 5C), we detected an interplanar spacing of d=2.88 Å, which was assigned to the (0210) plane of CaP. A series of diffraction rings appeared in the SAED of the crystallite (Figure 5D). We detected interplanar spacings of d=2.75 and 2.96 Å, which were assigned to the (420) and (02) planes of COM; interplanar spacings of d=1.93, 1.73, and 1.55 Å were assigned to the (4,010), (2,020), and (517) planes of CaP. Figure 5 shows that the main components in the interior region of urinary crystallite were CaP and COM, whereas in the surrounding region it was mainly COM.
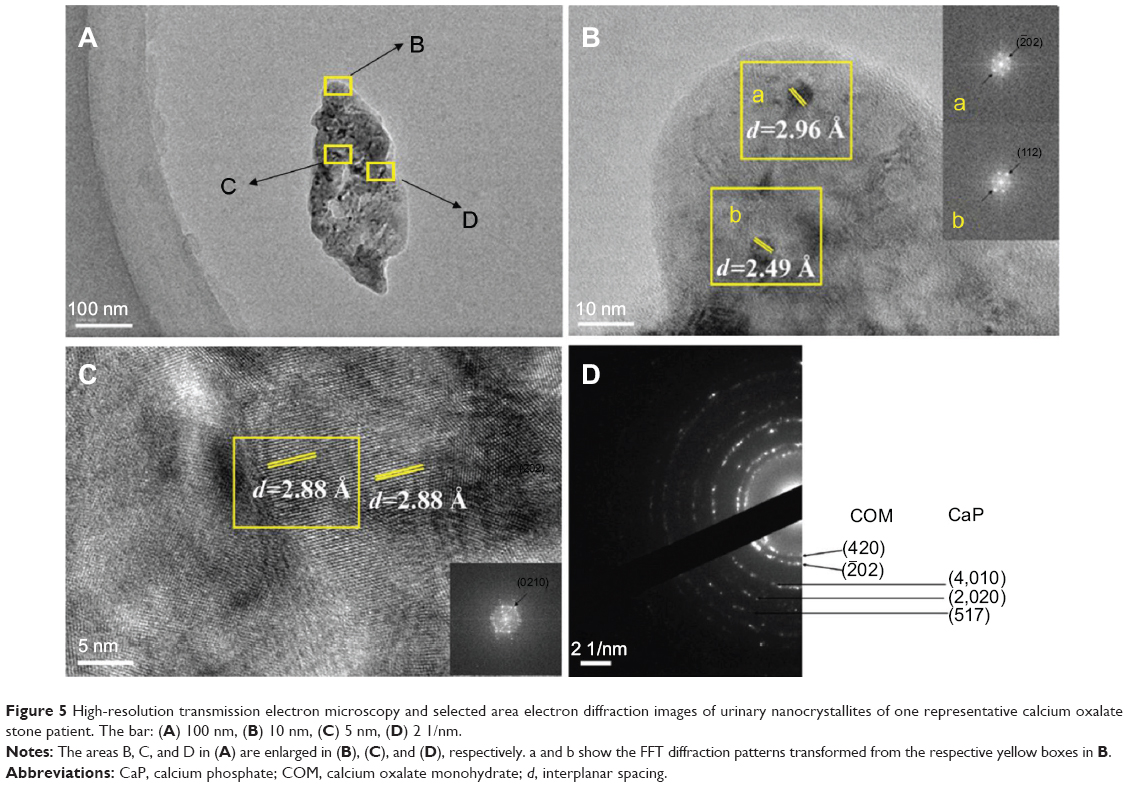 | Figure 5 High-resolution transmission electron microscopy and selected area electron diffraction images of urinary nanocrystallites of one representative calcium oxalate stone patient. The bar: (A) 100 nm, (B) 10 nm, (C) 5 nm, (D) 2 1/nm. |
EDS analysis of urinary crystallites
To further study the components of urinary crystallites, EDS of the urinary crystallites was performed. Given the effect of carbon membrane as background, we collected EDS data from ten different places in the central and surrounding regions of urinary crystallites. The main elements C, O, Ca, P, Mg, and Si were observed as shown in Figure 6. This result revealed that the main component of the urinary crystallites of COM calculi patients was CaOx and that these crystallites contained a small amount of CaP and UA. Figure 7 shows an EDS distribution of urinary crystallite in a representative CaOx stone patient.
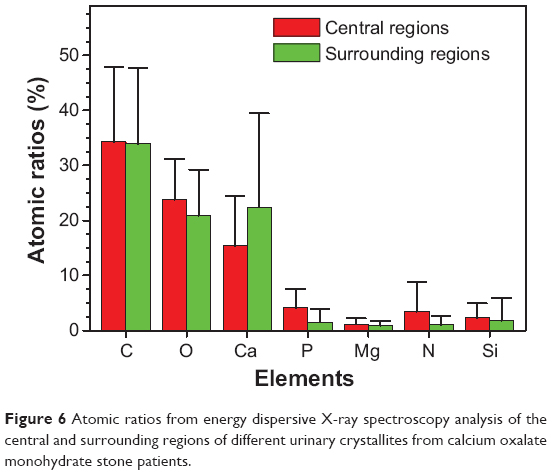 | Figure 6 Atomic ratios from energy dispersive X-ray spectroscopy analysis of the central and surrounding regions of different urinary crystallites from calcium oxalate monohydrate stone patients. |
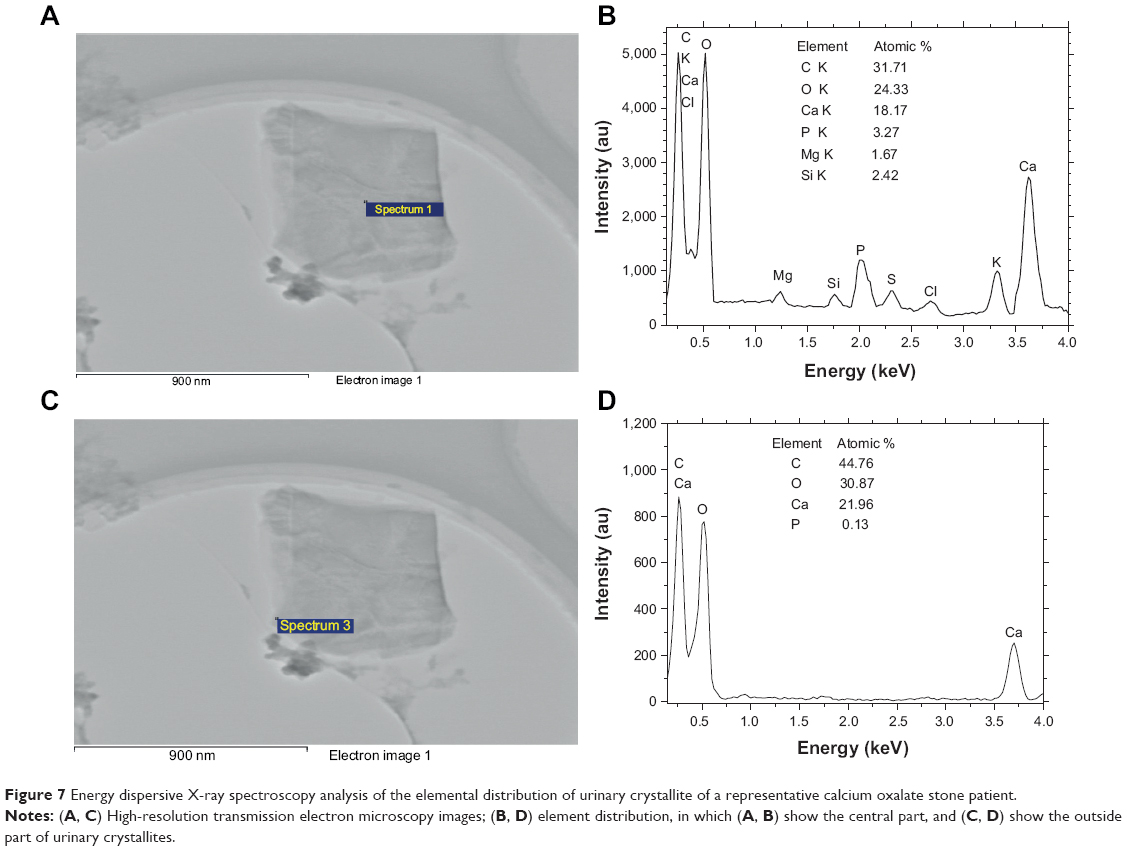 | Figure 7 Energy dispersive X-ray spectroscopy analysis of the elemental distribution of urinary crystallite of a representative calcium oxalate stone patient. |
Urine microcrystallites have numerous components. Data errors from EDS detection are significant, and light elements (such as nitrogen) are sometimes undetected.29–31 Thus, the difference of element distributions among different areas is quite large. However, statistical results showed that the average Ca element content (22.4%±17.1% for the surrounding region and 15.4%±9.0% for the central region) was significantly higher than that of P (1.57%±2.42% and 4.09%±3.44% respectively); the ratio of Ca to P was <1 (Figure 6). Further analysis showed that P content in the central region of the urinary crystallite (4.09%±3.44%) was apparently higher than that in the surrounding region (1.57%±2.42%), while Ca content in the central region (15.4%±9.0%) was lower than that in the surrounding region (22.4%±17.1%). This indicated that CaP may act as a nidus to induce COM development. The presence of Si was caused by the machine probe.
Discussion
Relationship between urinary crystallite components and stone components
FFT (Figures 3 and 5C) and SAED spectra (Figures 4 and 5D) of urinary crystallites show the strongest diffraction planes of UA and CaP, respectively. EDS analysis (Figure 6) shows the presence of the elements C, O, Ca, and P. These results indicate that the main components of urinary nanocrystallites in patients with CaOx calculi were CaOx, UA, and CaP.
However, only COM and COD were detected in the XRD spectra of the stones (Figure 1); UA and CaP were not detected. This can be attributed, on one hand, to the difference between stones and urinary crystallites and, on the other hand, to the UA and CaP contents (<5%). The XRD spectra provide comprehensive analyses of all components. When COM content was too high and UA and CaP content was too low (eg, <5%), the diffraction peaks of UA and CaP were overlapped by the strong diffraction peaks of COM.
By contrast, we can separately detect a single nanocrystallite by performing SAED, FFT, and EDS. Thus, the components of urinary nanocrystallites, especially those <5% (such as phosphate), can be more accurately analyzed. These low-content components are difficult to detect using XRD and FT-IR. This new method facilitates understanding of the mechanism of renal stone formation.
UA and CaP nanocrystallites as nidus induced the development of COM
FFT (Figure 3) and SAED (Figure 4) showed that the main components of urinary crystallites were CaOx, UA, and CaP. EDS analysis (Figure 6) showed that P content (4.09%±3.44%) in the central region of the urinary crystallites was higher than that in the surrounding region (1.57%±2.42%). Therefore, the component of urinary crystallite in the central region was CaP (Figure 5C) or UA (Figure 3), whereas that in the surrounding region was COM (Figure 5B) or a CaP–COM mixture (Figure 5D). This result provided evidence for UA or CaP crystals as nidus to induce CaOx stone formation in nanoscale.
The main components of urinary nanocrystallites in COM stone patients were COM, UA, and CaP. This result provided direct evidence of nano-UA and/or nano-CaP crystallites as central nidus to induce COM stone formation. This finding is different from the deduced results in references10–13 based on the component and element analysis of the surface and interior layer of stones.
The formation of CaOx stones is closely related with that of hyperuricosuria.32,33 The presence of UA crystals could induce the development of COM through heterogeneous nucleation.33–35 UA could function as a nidus to induce the generation, precipitation, and aggregation of CaOx crystals.36 Moreover, UA crystals, which are better nucleating agents than mucoproteins (glycoprotein) and cell debris, can induce the development of COM as a heterogeneous nucleating agent.14 Grover et al37 studied the concentration of dissolved urate that promoted the crystallization of CaOx from urine. Their research demonstrated that the effect of the urate on the crystallization was attributed to the salting out of CaOx from the solution. Hyperuricosuria was considered as a predisposing factor to CaOx stone pathogenesis.
Various phosphates are present in urine, such as CaP, amorphous calcium phosphate, hydroxyapatite, and carbapatite.15,38,39 All of them can function as nidus to induce the development of COM calculi.40 The main components in the interior layer of CaOx stones were CaOx and CaP, whereas in the surrounding region it was CaOx.41 Thus, CaP induced the development of COM calculi through heterogeneous nucleation, which has been evidenced by this paper in nanoscale.
Formation mechanism of COM stones
Table 1 shows that the concentrations of calcium, oxalate, phosphorus, UA, magnesium, and creatinine in the urine of patients with CaOx calculi were significantly higher than those of the controls. In contrast, citrate and GAG excretions of the patients were significantly lower than those of the controls. These results indicated that the formation of CaOx calculi was closely related to hyperuricosuria and hyperoxaluria. The lack of crystallization inhibitors such as citrate and GAGs also increased the risk of renal calculi formation. Daudon et al42 and Donsimoni et al43 showed that COM formation was closely related with hyperoxaluria, whereas COD formation was closely related with hypercalciuria.
The formation of CaOx calculi closely related to high concentrations of UA, oxalate, and calcium as well as low concentration of citrate and GAGs in the urine. Such formation also related to the properties of urinary nanocrystallites.5,7 The component difference of urinary nanocrystallites is one of the important factors for the formation of various types of kidney stones.
Figure 8 shows the schema of the formation process of papillary COM calculi. The existence of high concentrations of UA, oxalate, phosphorous, and calcium in urine and the lack of citrate and GAGs in urine could cause the formation of CaP, UA, COM, and COD crystallites.44 These formed crystallites would attach to the walls of the renal papilla in which the GAG layer was damaged, destroyed, or reduced.45–48 These crystallites can act as heterogeneous nucleants of COM and induce the formation of loosely arranged twinned and intergrown plate-like COM crystals, thereby constituting the “core” of a COM calculus.45 In a certain developing stage, the organic material presented in urine covered the “core” surface. As an effective substrate for nucleation of COM crystals, these organic materials can induce the formation of columnar COM crystals at the “core” surface. Successive layers of such a compact structure increase the calculus size and constitute the shell. When conditions prevailing in the kidney become favorable for stone formation, a new calculus stratum of columnar crystals develops.47 Finally, this stratum develops into the papillary COM stone.
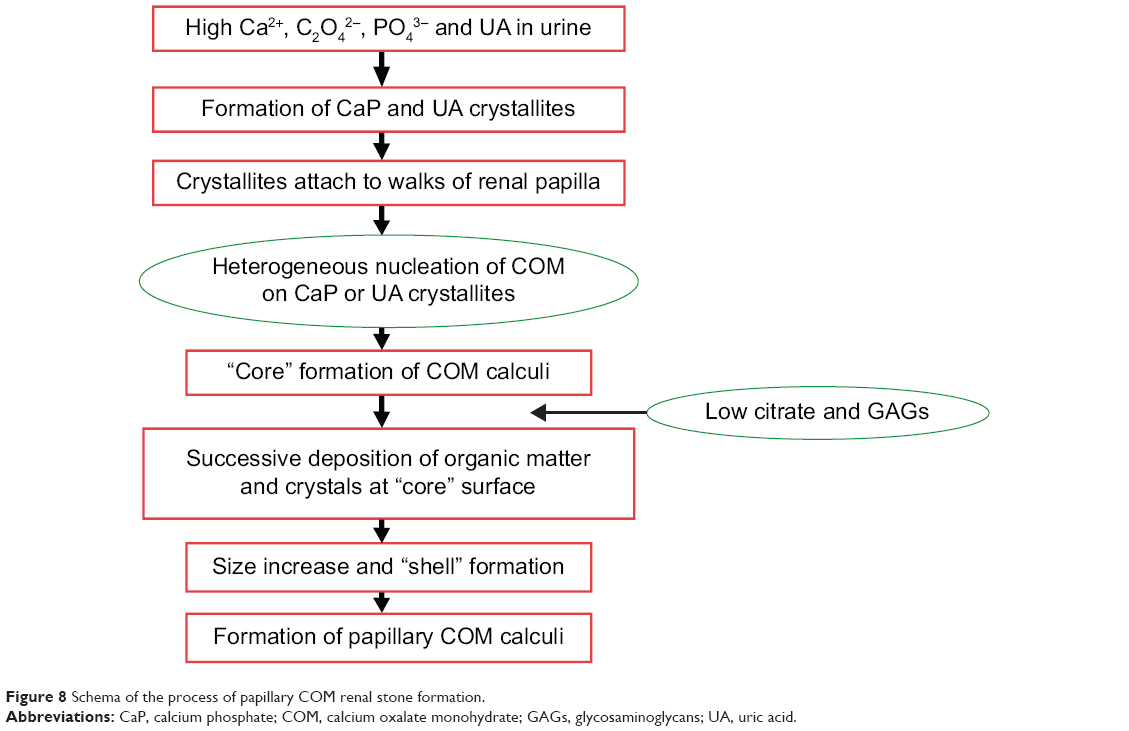 | Figure 8 Schema of the process of papillary COM renal stone formation. |
The small absolute value of zeta potential of the crystallites in the urine of the patients (Table 1) caused the much easier aggregation of these crystallites. The increased concentration of creatinine also indicated that the kidney of the patients may be damaged, which would promote the adhesion of urinary crystallites to cells (Figure 8).
The formation of COM and COD crystals is not dependent on urine pH, because the change in urine pH does not correspond to a proportional change in the solubility of these salts.33 However, at urine pH <5.5, anhydrous UA or dihydrate UA crystals will precipitate, and these crystals can act as heterogeneous nucleating agents that induce the formation of COM–UA mixed stones.40 A slight imbalance and change in urine pH can result in the rapid growth of amorphous calcium phosphate,49 and at urine pH >6.0, CaP crystals can precipitate; these can lead to the formation of mixed CaOx–CaP stones.16
Conclusion
A combination of HRTEM, SAED, FFT, and EDS was performed to detect the components, especially if they were <5% (such as phosphate), of any single urinary nanocrystallite in patients with CaOx stones, accurately. These low content components are difficult to detect using XRD and FT-IR. This new method facilitates understanding of the mechanism of renal stone formation. The formation of COM calculi closely related to high concentrations of UA, oxalate, and calcium as well as low concentration of citrate and GAGs in the urine. Such formation also related to the properties of urinary nanocrystallites. The main components of CaOx stones were found to be COM and a small amount of COD, while the main components of urinary crystallites were COM, UA, and CaP. EDS detected the characteristic absorption peaks of C, O, Ca, and P, and the ratio of Ca to P was <1. The results provided direct evidence of nano-UA and/or nano-CaP crystallites as central nidus to induce COM stone formation. The component difference of urinary nanocrystallites is one of the important factors for the formation of various types of kidney stones.
Acknowledgment
This research work was supported by the Natural Science Foundation of China (81170649).
Disclosure
The authors declare that there are no conflicts of interest regarding the publication of this article.
References
Prasongwatana V, Bovornpadungkitti S, Chotikawanich E, Pachitrat K, Suwanatrai S, Sriboonlue P. Chemical components of urinary stones according to age and sex of adult patients. J Med Assoc Thai. 2008; 91(10):1589–1594. | ||
Sun XZ, Shen LM, Cong XM, Zhu HZ, He L, Lu JL. Infrared spectroscopic analysis of 5,248 urinary stones from Chinese patients presenting with the first stone episode. Urol Res. 2011;39:339–343. | ||
Zhang J, Wang GZ, Jiang N, Yang JW, Gu Y, Yang F. Analysis of urinary calculi composition by infrared spectroscopy: a prospective study of 625 patients in eastern China. Urol Res. 2010;38:111–115. | ||
Trinchieri A, Castelnuovo C, Lizzano R, Zanetti G. Calcium stone disease: a multiform reality. Urol Res. 2005;33(3):194–198. | ||
Duan C-Y, Xia Z-Y, Zhang G-N, Gui B-S, Xue J-F, Ouyang J-M. Changes in urinary nanocrystallites in calcium oxalate stone formers before and after potassium citrate intake. Int J Nanomed. 2013;8: 909–918. | ||
Peng H, Ouyang J-M, Yao X-Q, Yang R-E. Interaction between sub-micron COD crystals and African green monkey renal epithelial cell. Int J Nanomed. 2012;7(8):4727–4737. | ||
Zhang G-N, Ouyang J-M, Xue J-F, Shang Y-F. Property changes of urinary nanocrystallites and urine of uric acid stone formers after taking potassium citrate. Mater Sci Eng C-Mater Biol Appl. 2013;33: 4039–4045. | ||
Blaschko SD, Miller J, Chi T, et al. Microcomposition of human urinary calculi using advanced imaging techniques. J Urol. 2013;189 (2): 726–734. | ||
Khan SR, Hackett RL. Identification of urinary stone and sediment crystals by scanning electron microscopy and X-ray microanalysis. J Urol. 1986;135(4):818–825. | ||
Fazil Marickar YM, Lekshmi PR, Varma L, Koshy P. EDAX versus FTIR in mixed stones. Urol Res. 2009;37(5):271–276. | ||
Fazil Marickar YM, Lekshmi PR, Varma L, Koshy P. Elemental distribution analysis of urinary crystals. Urol Res. 2009;37(5):277–282. | ||
Fazil Marickar YM, Lekshmi PR, Varma L, Koshy P. Problem in analyzing cystine stones using FTIR spectroscopy. Urol Res. 2009;37(5): 263–269. | ||
Lee HP, Leong D, Heng CT. Characterization of kidney stones using thermogravimetric analysis with electron dispersive spectroscopy. Urol Res. 2012;40(3):197–204. | ||
Grases F, Sanchis P, Isern B, Perello J, Costa-Bauza A. Uric acid as inducer of calcium oxalate crystal development. Scand J Urol Nephrol. 2007;41:26–31. | ||
Lee T, Lin YC. Mimicking the initial development of calcium urolithiasis by screening calcium oxalate and calcium phosphate phases in various urinelike solutions, time points, and pH values at 37°C. Cryst Growth Des. 2011;11(7):2973–2992. | ||
Grases F, Costa-Bauza A, Ramis M, Montesinos V, Conte A. Simple classification of renal calculi closely related to their micromorphology and etiology. Clin Chim Acta. 2002;322:29–36. | ||
Srinivasan S, Kalaiselvi P, Sakthivel R, Pragasam V, Muthu V, Varalakshmi P. Uric acid: an abettor or protector in calcium oxalate urolithiasis? Biochemical study in stone formers. Clin Chim Acta. 2005;353(1–2):45–51. | ||
Bai Y, Ouyang J-M, Bai Y, Chen M-L. Simultaneous determination of calcium and magnesium in urines by flame atomic absorption spectrometry. Spectros Spetral Anal. 2004;24(8):1016–1019. | ||
Kalbus GE, Lieu VT, Kalbus LH. A spectrophotometric study of the permanganate-oxalate reaction: an analytical laboratory experiment. J Chem Edu. 2004;81(1):100–102. | ||
Kuswandi B, Ratnasari I, Gani AA. Optical Detection of Uric Acid Based on Immobilized Ferritin onto Modified PVA Membrane: Proceedings of the Asian Conference on Sensors and the International Conference on New Techniques in Pharmaceutical and Biomedical Research. Ghodgaonkar DK, ed. New York, NY: Institute of Electrical and Electronics Engineers Publisher; 2005:107–110. | ||
Rajagopal G. A simple colorimetric procedure for estimation of citric acid in urine. Ind J Exp Biol. 1984;22:391–392. | ||
Whiteman P. The quantitative determination of glycosaminoglycans in urine with Alcian Blue 8GX. Biochem J. 1973;131:351–357. | ||
Negri AL, Spivacow R, Valle ED, et al. Clinical and biochemical profile of patients with “pure” uric acid nephrolithiasis compared with “pure” calcium oxalate stone formers. Urol Res. 2007;35(5):247–251. | ||
Liotta E, Gottardo R, Bonizzato L, Pascali JP, Anna Bertaso, Tagliaro F. Rapid and direct determination of creatinine in urine using capillary zone electrophoresis. Clin Chim Acta. 2009;409:52–55. | ||
King M, McClure WF, Andrews LC. Powder Diffraction File Alphabetic Index: Inorganic Phases/Organic Phases. Newtown Square, PA: International Center for Diffraction Data; 1992. | ||
He J-Y, Deng S-P, Ouyang J-M. Morphology, size distribution, aggregation, and crystal phase of nanocrystallites in urines of healthy persons and lithogenic patients. IEEE Trans Nanobiosci. 2010;9(2):156–163. | ||
Pouget EM, Bomans PH, Goos JA, Frederik PM, With GD, Sommerdijk NA. The initial stages of template-controlled CaCO3 formation revealed by cryo-TEM. Science. 2009;323(5920):1455–1458. | ||
Marszaiek M. Application of optical microscopy and scanning electron microscopy to the study of stone weathering: a Cracow case study. Int J Archit Herit. 2008;2(1):832. | ||
Thurgood LA, Ryall RL. Proteomic analysis of proteins selectively associated with hdroxyapatite, brushite, and uric acid crystals precipitated from human urine. J Proteome Res. 2010;9(10):5402–5412. | ||
Mandel I, Mandel N. Structure and compositional analysis of kidney stones. In: Urinary Stone Disease: The Practical Guide to Surgical Management. Stoller ML, Meng MV, eds. New York, NY: Spinger; 2007. | ||
Kuo KH. [A brief history of metallography. VI: Application of electron microscopy in materials science]. Mater Sci Eng. 2002;20(1):5–9. Chinese. | ||
Öhman S, Larsson L, Tiselius HG. Clinical significance of phosphate in calcium oxalate renal stones. Ann Clin Biochem. 1992;29(1):59–63. | ||
Grases F, Sanchis P, Perello J, Costa-Bauza A. Role of uric acid in different types of calcium oxalate renal calculi. Int J Urol. 2006;13: 252–256. | ||
Bouropoulos C, Vagenas N, Klepetsanis P, Stavropoulos N, Bouropoulos N. Growth of calcium oxalate monohydrate on uric acid crystals at sustained supersaturation. Cryst Res Technol. 2004;39(8): 699–704. | ||
Pak CY, Arnold LH. Heterogeneous nucleation of calcium oxalate by seeds of monosodium urate. Proc Soc Exp Biol Med. 1975;149(4): 930–932. | ||
Sorensen CM, Chandhoke PS. Hyperuricosuric calcium nephrolithiasis. Endocrinol Metab Clin North Am. 2002;31(4):915–925. | ||
Grover PK, Marshall VR, Ryall RL. Dissolved urate salts out calcium oxalate in undiluted human urine in vitro: implications for calcium oxalate stone genesis. Chem Biol. 2003;10:271–278. | ||
Grases F, Soehnel O, Vilacampa, March JG. Phosphates precipitating from artificial urine and fine structure of phosphate renal calculi. Clin Chim Acta. 1996;244:45–67. | ||
Daudon M, Bouzidi H, Bazin D. Composition and morphology of phosphate stones and their relation with etiology. Urol Res. 2010;38: 459–467. | ||
Grases F, Costa-Bauzá A, Gomila I, Ramis M, García-Raja A, Prieto RM. Urinary pH and renal lithiasis. Urol Res. 2012;40:41–46. | ||
Ebrahimpour A, Perez L, Nancollas GH. Induced crystal growth of calcium oxalate monohydrate at hydroxyapatite surfaces. The influence of human serum albumin, citrate, and magnesium. Langmuir. 1991;7(3): 577–583. | ||
Daudon M, Donsimoni R, Hennequin C, et al. Sex and age-related composition of 10,617 calculi analyzed by infrared spectroscopy. Urol Res. 1995;23:319. | ||
Donsimoni R, Hennequin C, Fellahi S, et al. New aspects of urolithiasis in France. Eur Urol. 1997;31:17. | ||
Ha YS, Tchey DU, Kang HW, et al. Phosphaturia as a promising predictor of recurrent stone formation in patients with urolithiasis. Korean J Urol. 2010;51(1):54–59. | ||
Grases F, Costa-Bauá A, Conte A. Studies on structure of calcium oxalate monohydrate renal papillary calculi. Mechanism of formation. Scan Microsc. 1993;7(3):1067–1074. | ||
Grases F, Costa-Bauzá A, March JG, Söhnel O. Artificial simulation of renal stone formation. Influence of some urinary components. Nephron. 1993;65(1):77–81. | ||
Söhnel O, Grases F. Calcium oxalate monohydrate renal calculi. Formation and development mechanism. Adv Coll Interf Sci. 1995:1–17. | ||
Tsujihata M. Mechanism of calcium oxalate renal stone formation and renal tubular cell injury. Int J Urol. 2008;15:115–120. | ||
Al-Atar U, Bokov AA, Marshall D, et al. Mechanism of calcium oxalate monohydrate kidney stones formation: layered spherulitic growth. Chem Mater. 2010;22(4): 1318–1329. |
 © 2014 The Author(s). This work is published and licensed by Dove Medical Press Limited. The full terms of this license are available at https://www.dovepress.com/terms.php and incorporate the Creative Commons Attribution - Non Commercial (unported, v3.0) License.
By accessing the work you hereby accept the Terms. Non-commercial uses of the work are permitted without any further permission from Dove Medical Press Limited, provided the work is properly attributed. For permission for commercial use of this work, please see paragraphs 4.2 and 5 of our Terms.
© 2014 The Author(s). This work is published and licensed by Dove Medical Press Limited. The full terms of this license are available at https://www.dovepress.com/terms.php and incorporate the Creative Commons Attribution - Non Commercial (unported, v3.0) License.
By accessing the work you hereby accept the Terms. Non-commercial uses of the work are permitted without any further permission from Dove Medical Press Limited, provided the work is properly attributed. For permission for commercial use of this work, please see paragraphs 4.2 and 5 of our Terms.