")
Back to Journals » International Journal of Nanomedicine » Volume 9 » Issue 1
Nanostructured lipid carriers as a novel oral delivery system for triptolide: induced changes in pharmacokinetics profile associated with reduced toxicity in male rats
Authors Zhang C, Peng F, Liu W, Wan J, Wan C, Xu H, Lam CWK, Yang X
Received 29 September 2013
Accepted for publication 24 November 2013
Published 20 February 2014 Volume 2014:9(1) Pages 1049—1063
DOI https://doi.org/10.2147/IJN.S55144
Checked for plagiarism Yes
Review by Single anonymous peer review
Peer reviewer comments 4
Cong Zhang,1 Fan Peng,1 Wei Liu,1 Jiangling Wan,1 Chunxi Wan,1 Huibi Xu,1,2 Christopher Waikei Lam,2 Xiangliang Yang1,2
1National Engineering Research Center for Nanomedicine, College of Life Science and Technology, Huazhong University of Science and Technology, Wuhan, 2State Key Laboratory of Quality Research in Chinese Medicine, Macau Institute for Applied Research in Medicine and Health, Macau University of Science and Technology, Macau, People's Republic of China
Abstract: After oral administration in rodents, triptolide (TP), a diterpenoid triepoxide compound, active as anti-inflammatory, immunosuppressive, anti-fertility, anti-cystogenesis, and anticancer agent, is rapidly absorbed into the blood circulation (from 5.0 to 19.5 minutes after dosing, depending on the rodent species) followed by a short elimination half-life (from about 20 minutes to less than 1 hour). Such significant and rapid fluctuations of TP in plasma likely contribute to its toxicity, which is characterized by injury to hepatic, renal, digestive, reproductive, and hematological systems. With the aim of prolonging drug release and improving its safety, TP-loaded nanostructured lipid carriers (TP-NLCs), composed of Compritol® 888 ATO (solid lipid) and Capryol™ 90 (liquid lipid), were developed using a microemulsion technique. The formulated TP-NLCs were also characterized and in vitro release was evaluated using the dialysis bag diffusion technique. In addition, the pharmacokinetics and toxicology profiles of TP-NLCs were compared to free TP and TP-loaded solid lipid nanoparticles (TP-SLNs; containing Compritol 888 ATO only). Results demonstrate that TP-NLCs had mean particle size of 231.8 nm, increased drug encapsulation with a 71.6% efficiency, and stable drug incorporation for over 1-month. TP-NLCs manifested a better in vitro sustained-release pattern compared to TP-SLNs. Furthermore, TP-NLCs prolonged mean residence time (MRT)0–t (P<0.001, P<0.001), delayed Tmax (P<0.01, P<0.05) and decreased Cmax (P<0.01, P<0.05) compared to free TP and TP-SLNs, respectively, which was associated with reduced subacute toxicity in male rats. In conclusion, our data suggest that TP-NLCs are superior to TP-SLNs and could be a promising oral delivery system for a safer use of TP.
Keywords: triptolide, microemulsion technique, in vivo pharmacokinetics, sustained-release, rat subacute toxicity
Introduction
Triptolide (TP), a diterpenoid triepoxide, is a major active and toxic component of extracts derived from the traditional Chinese medicine Tripterygium wilfordii Hook F (TWHF). TP has been demonstrated to possess a unique bioactive spectrum of anti-inflammatory, immunosuppressive, antifertility, anticystogenesis, and anticancer activities.1 However, the clinical utility of TP has been limited by its narrow therapeutic window and high toxicities on the hepatic, renal, digestive, reproductive, and hematological systems.2–4
TP is a moderately lipophilic molecule with low n-octanol/water partition coefficient of 0.58.5–7 After oral administration in rats, TP is absorbed rapidly. The time of maximum plasma concentration (Tmax) ranges from 10.0 to 19.5 minutes, with an elimination half-life (t1/2) from 16.8 to 50.6 minutes.8,9 Similarly, the reported Tmax and t1/2 of TP in mice are 5.0 and 13.7 minutes, respectively.2 These pharmacokinetic behaviors of TP indicate that it gains fast access into the blood circulation with a very short stay. This phenomenon can be explained by the combined effects of efficient gastrointestinal permeability,6 rapid metabolism by cytochrome P4503A system in the liver,4,10,11 and extensive tissue distribution.2,9 The significant and rapid fluctuations of TP in plasma likely contribute to the toxicity of TP following oral administration. Therefore, a formulation with extended delivery potential and decreased fluctuations of plasma drug concentration is highly desirable for TP.
Nanostructured lipid carriers (NLCs), formulated with biocompatible solid and liquid lipids, are an improved generation of solid lipid nanoparticles (SLNs), providing a delivery system for various active drugs with controlled-release characteristic.12–14 It has been well documented that NLCs were developed for overcoming some SLN limitations to their highly ordered crystalline structure. The addition of a liquid lipid to a solid lipid creates a less-ordered crystal lattice with an increased number of imperfections, attaining high drug encapsulation and stable drug incorporation during storage.15,16
The aim of this work was to develop TP encapsulated NLCs with prolonged release properties and improved safety. Solid and liquid lipids were screened and TP-loaded NLCs (TP-NLCs) were then prepared using a microemulsion technique. Earlier studies have indicated that reduced toxicity of drugs was associated with pharmacokinetic alteration.17,18 In addition, we investigated the influence of SLNs on the toxicity of TP previously.19,20 Thus, in this work, the characteristics of TP-NLCs (particle size, morphology, encapsulation efficiency, and stability), in vitro release, in vivo pharmacokinetics, and subacute toxicity in male rats were examined and compared, using the optimized TP-loaded SLNs (TP-SLNs) as a contrast.
Materials and methods
Chemicals and reagents
TP was purchased from Nanjing Zelang Medical Technology Co, Ltd (Nanjing, People’s Republic of China) (purity >98% by high-performance liquid chromatography [HPLC]). Prednisolone was obtained from the National Institutes for Food and Drug Control (purity >99% by HPLC; Beijing, People’s Republic of China). Palmitic acid (solid lipid), stearic acid (solid lipid), oleic acid (liquid lipid), and ethyl oleate (liquid lipid) were purchased from Sinopharm Chemical Reagent Co, Ltd (Beijing, People’s Republic of China). Soybean oil (liquid lipid) was obtained from Huanye Pharmaceutical Co, Ltd (Guangzhou, People’s Republic of China). Compritol® 888 ATO (glyceryl behenate, solid lipid), Precirol® ATO 5 (glyceryl palmitostearate, solid lipid), Geleol™ (glyceryl monostearate, solid lipid), Maisine™ 35-1 (glyceryl monolinoleate, liquid lipid), Peceol™ (glyceryl monooleate, liquid lipid), Labrafac™ Lipophile WL1349 (medium-chain triglycerides, liquid lipid), Capryol™ 90 (propylene glycol monocaprylate, liquid lipid), Lauroglycol™ 90 (propylene glycol monolaurate, liquid lipid), Labrafil® M1944CS (oleoyl macrogol-6 glycerides, liquid lipid), Plurol Oleique® CC 497 (polyglyceryl-3 dioleate, liquid lipid), and Transcutol® HP (diethylene glycol monoethyl ether) were supplied by Gattefossé SAS (Saint Priest Cedex, France). Medium chain triglycerides (MCT; liquid lipid) and Lipoid® E 80 (egg lecithin) were purchased from Lipoid GmbH (Ludwigshafen, Germany). Cremophor® RH40 (polyoxyl 40 hydrogenated castor oil) was obtained from BASF (Ludwigshafen, Germany). Solvents were of HPLC grade and water was obtained from a Milli-Q water purification system (Millipore, Bedford, MA, USA). Other chemicals were of analytical grade.
Animals
Male Sprague Dawley (SD) rats (270–300 g) were purchased from the Laboratory Animals Center of Tongji Medical College of Huazhong University of Science and Technology (Wuhan, People’s Republic of China). They were housed in an air conditioned room under a 12 hour light/dark cycle with free access to food and water. They were acclimatized for 1-week before experiments. The protocol of this study was approved by the Ethical Committee of Huazhong University of Science and Technology. Every effort was made to minimize the stress on the rats.
Preparation of TP- NLCs
Solubility and partitioning behavior of TP in solid lipids
For examining the solubility of TP in solid lipids,21 4.0 mg of TP was dispersed in a test tube, the lipid was added in increments of 0.40 g, and the test tube was heated with a water bath kept at 85°C and shaken reciprocally. The qualitative solubility of TP in the molten lipid was estimated visually. In order to study the partitioning behavior of TP in different lipids,22 TP (100 μg) was dispersed in a mixture of melted lipid (1 g) and hot water (1 mL). The mixture was shaken reciprocally for 1-hour in a water bath at 85°C. Aqueous phase was then separated after cooling by centrifugation at a speed of 5,500 rpm, and filtered through 0.45 μm membrane filters. TP content was analyzed by Agilent 1100 HPLC (Agilent Technologies, Palo Alto, CA, USA) as follows.
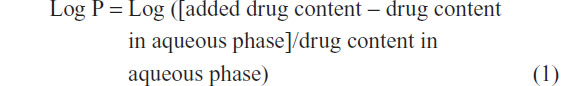
ZORBAX Eclipse Plus C18 analytical column (Agilent Technologies) (250 mm × 4.6 mm, 5 μm) with an Agilent guard cartridge was used at 25°C. The flow rate was kept at 1.0 mL/minute and an ultraviolet (UV) detector operated at 218 nm. A mixture of ethanol and water (45:55, volume [v]/v) was chosen as the mobile phase. In the concentration range of TP from 0.4 to 20 μg/mL (n=6), the calibration curve showed good linearity with a correlation of y=21.49x + 2.504 (R2=0.999). The partition coefficient (Log P) was calculated as:
Solubility of TP in liquid lipids
The saturation solubility of TP in different liquid lipids was determined after shaking a liquid lipid containing an excess of TP (>8 mg/g) at 250 rpm at 37°C for 48 hours23 using an incubator shaker (CIMO Medical Instrument, Shanghai, People’s Republic of China). The oil-TP mixtures were centrifuged at 5,500 rpm for 10 minutes, and the amount of TP solubilized in liquid lipids was analyzed using the HPLC method described above.
Selection of a binary mixture of solid and liquid lipids
The selected solid and liquid lipids (for details, see Results section) were mixed in different ratios. Lipid mixtures were agitated at 200 rpm at 85°C for 1-hour and subsequently cooled with cold water (2°C–4°C), which aimed to mimic the production process of lipid nanoparticles by microemulsion technique. Differential scanning calorimetry (DSC) was employed to investigate the blending behavior of solid lipid after inclusion with increasing amounts of liquid lipid, using a Diamond DSC apparatus (Perkin-Elmer Corporation, Waltham, MA, USA). A heating rate of 10°C/minute was employed in the temperature range of 20°C–100°C. An empty aluminum pan was used as reference standard. Analysis was carried out under nitrogen purge.
Preparation of TP-NLCs and TP-SLNs using microemulsion technique
TP-NLCs were prepared using microemulsion technique.13 Briefly, TP, lipids (selected solid and liquid lipids, for details, see Results section), Cremophor RH40, Lipoid E 80, and Transcutol HP were mixed at a ratio of 1:55:42:6.5:6.5 (weight [w]/w). Upon heating together at 85°C under magnetic stirring, water (85°C) was added. An optically transparent microemulsion was formed and dispersed into cold water (2°C–4°C) under vigorous stirring using a 1:5 ratio (microemulsion:water), and subsequently filtered through 1 μm membrane filters to form TP-NLCs dispersions. The samples were stored in a refrigerator at 4°C. TP-SLNs were prepared using the same method (containing the same filtration step) with the pure solid lipid.
Characteristics of TP- NLCs and TP- SLNs
Particle size and transmission electron microscopy analysis
Mean particle size and polydispersity index (PDI) as a measure of the width of particle size distribution were assessed by photon correlation spectroscopy (Nano-ZS90 zetasizer, Malvern Instruments Corp, Worcestershire, UK). Prior to the measurements, all samples were diluted using Milli-Q water until a count rate of 200–300 Kcps (1,000 counts per second) was achieved aiming to eliminate multiple scattering. The data was analyzed at 25°C with a 90° scattering angle. Freshly prepared lipid nanoparticles (TP-NLCs and TP-SLNs) were diluted 50-fold with water, and a sample drop was placed on a copper grid coated with carbon film. The excess was drawn off with a filter paper letting it dry overnight. Samples were then quickly stained with phosphotungstic acid solution (2%, w/v, pH =6.0) and dried in air. Finally, samples were examined by the Hitachi H-7000FA transmission electron microscope at 75 kV (Hitachi Ltd, Tokyo, Japan).
Encapsulation efficiency
Free TP was removed from 0.5 mL of freshly prepared lipid nanoparticles by ultrafiltration at 4°C using centrifugal filter tubes with a 10 kDa molecular weight cut-off (Amicon® Ultra, Millipore Co, Bedford, MA, USA) at 4,000 g for 40 minutes. The removed free TP in the aqueous phase was detected by HPLC. To examine the total TP amount in lipid nanoparticles, another 0.5 mL of nanoparticles were first diluted with a mixed solvent composed of dichloromethane and methanol (1:10) for lipid disruption, followed by vortexing for 5 minutes, and then filtered through 0.45 μm membrane before being subjected to HPLC analysis.
Encapsulation efficiency (EE) was calculated according to the following equation:14

where WTotal and WFree were the weights of total drug and the unencapsulated drug, respectively.
Stability study
TP-NLCs and TP-SLNs were stored in a dark place at 4°C for 1-month. Changes in mean particle size and EE were monitored during the storage period (0, 7, 15 and 30 days).
Thermal analysis
DSC was employed to investigate the thermal behavior of the lipid nanoparticles using the method described in selection of a binary mixture of solid and liquid lipids section, except for a different temperature range (30°C–250°C). TP-NLCs and TP-SLNs were frozen at −20°C overnight and the temperature was reduced to −72°C for 24 hours. The frozen sample was dried in a freeze dryer (Labconco Corp, Kansas, MO, USA) for 72 hours to obtain a powder. A physical mixture (TP:Compritol 888 ATO =1:55) was also prepared.
In vitro release
In vitro release was evaluated using the dialysis bag diffusion technique. Phosphate buffered saline (PBS; pH 6.8) containing 10% (v/v) ethanol was selected as the release medium.24 The dialysis bag with a 8–14 kDa molecular weight cut-off was soaked in water for 12 hours before use. Lipid nanoparticles containing 0.5 mg of TP were transferred into the bag, then both ends were tightly sealed and immersed into 50 mL medium in a conical flask. The conical flask was placed into an incubator shaker with a speed of 100 rpm and maintained at a temperature of 37°C. At predetermined time intervals (0.17, 0.33, 0.50, 0.75, 1, 2, 4, 6, 8, 10, 12, 24, and 48 hours), 0.5 mL of aliquots were taken and immediately replaced with an equal volume of fresh medium and TP concentration was analyzed using HPLC. The experiments were performed in triplicate.
In vivo pharmacokinetics
Male SD rats were fasted for 12 hours prior to dosing with free access to water. They were divided randomly into three groups with six rats in each. They were orally administered TP-NLCs, TP-SLNs, or free TP (TP dispersed in 0.5% sodium carboxymethyl cellulose solution) at a dose of 500 μg/kg (10 mL/kg body weight). Blood samples were collected from the retro-orbital plexus into heparinized tubes at designated time intervals (0.08, 0.17, 0.25, 0.33, 0.50, 0.75, 1, 1.5, 2, 3, 4, and 6 hours),9,25 and separated immediately by centrifugation (4,000 rpm for 15 minutes). The plasma obtained was stored at −20°C until analysis. Rat plasma was mixed with 10 μL of internal standard solution (prednisolone, 4 μg/mL) and 1 mL of methanol and vortexed for 5 minutes. Then, 2 mL of ethyl acetate was added and the mixture was vortexed for 10 minutes. After centrifugation (11,000 rpm for 10 minutes at 4°C), the organic layer was transferred to a new tube and evaporated under a stream of nitrogen. The residue was reconstituted in 100 μL of methanol:water (42:58, v/v), and centrifuged (15,000 rpm for 10 minutes at 4°C) after vortexing for 10 minutes. Twenty μL of supernatant was injected into the LC-mass spectrometer (MS).
LC-MS analysis was performed with a Finnigan HPLC system equipped with a TSQ Quantum Access Max mass spectrometer (Thermo Fisher Scientific, Waltham, MA, USA). The analytical operations as well as acquisition and analysis of data were controlled by Xcalibur 2.1 software (Thermo Fisher Scientific). The LC separation was achieved at 25°C on a Hypersil GOLD™ C18 column (150 mm × 2.1 mm, 5 μm); the mobile phase consisted of methanol and 2 mM ammonium acetate (42:58, v/v) with a flow rate of 0.25 mL/minute. The mass spectrometer was operated in positive atmospheric pressure chemical ionization (APCI) mode with discharge current 4.0 μA, vaporizer temperature 410°C, sheath gas pressure 30 arbitrary units (au), auxiliary gas pressure 8 au, capillary temperature 200°C, tube lens offset 96 V, and skimmer offset 22 V. Quantification was carried out using selected ion monitoring (SIM) mode that monitored m/z 361 ([M+H]+) for both TP and prednisolone with a scan width (m/z) of 1.00.
The pharmacokinetic parameters were calculated by a non-compartmental method using DAS software 2.0 (Mathematical Pharmacology Professional Committee of China, Shanghai, People’s Republic of China).
Subacute toxicity study
Male SD rats were randomly divided into seven groups: control group (0.5% sodium carboxymethyl cellulose solution), and free TP, TP-NLCs, and TP-SLNs groups treated with two dosages (650 and 500 μg/kg for high and low doses, respectively under a dosing volume of 10 mL/kg body weight). Each group consisted of six rats. Treated groups were administered the drug by gavage once daily for 28 days, control rats were given the same volume of vehicle. During the test, an increase in body weight was recorded weekly. At the end of the treatment, animals were fasted overnight but with water ad libitum. They were then anesthetized and blood samples were collected via cardiac puncture for measurement of serum biochemical parameters, including alanine aminotransferase (ALT), aspartate aminotransferase (AST), creatinine (Crea), blood urea nitrogen (BUN), superoxide dismutase (SOD), and malonyldialdehyde (MDA). These serum parameters were determined by reagent kits (Nanjing Jiancheng Biotechnology Institute, Nanjing, People’s Republic of China) according to the manufacturer’s protocols. Organs (heart, liver, spleen, lung, and kidney) were weighed at necropsy. The relative organ weights were calculated as organ-to-body-weight ratio. The tissues (liver, spleen, and kidney) were immediately rinsed with physiological saline, fixed overnight in 4% paraformaldehyde, and processed for paraffin sectioning followed by hematoxylin and eosin (H&E) staining for microscopic examination.
Statistical analysis
Particles size values and encapsulation efficiency during storage period were determined for repeated measures and compared by general linear model with repeated measures analysis. Statistical significances in Log P, pharmacokinetics, and subacute toxicity were evaluated using one-way analysis of variance (ANOVA) followed by Tukey’s test for multiple comparisons. Results were presented as mean ± standard deviation. P<0.05 was considered significant.
Results
Preparation of TP-NLCs
Screening of lipids
Sufficiently high solubility in the melted lipid is the requisite for achieving high encapsulation efficiency for TP. Although a systematic and standard procedure of selecting an appropriate solid lipid has not been published yet, some criteria have been defined in the literature, such as qualitative solubility21,26 and partitioning behavior.22,27
Among the screened solid lipids, four lipids (palmitic acid, stearic acid, Precirol ATO 5, and Geleol) showed similar ability to dissolve TP (1.0–1.25 mg/g), with a relatively higher solubility that was found in Compritol 888 ATO (1.4 mg/g). The partition coefficients of TP between the lipids and water are shown in Table 1 (data of Geleol was lost because the lipid had been substantially emulsified during the partitioning behavior test). All Log P values were <1, indicating not very extensive partitioning of TP into the lipid phase. A higher Log P was observed with Compritol 888 ATO (P<0.01, compared to other three lipids), which was then selected as the best solid lipid. In addition, although TP was poorly soluble in all liquid lipids tested, significantly higher solubility of TP was found in Capryol 90 followed by Lauroglycol 90 (Table 2). Capryol 90 has shown better solubilization capacity for poorly water-soluble compounds among the various hydrophobic oils.28 It also afforded the best-solubilizing potential for TP and therefore was chosen as a liquid lipid for the formulation of TP-NLCs.
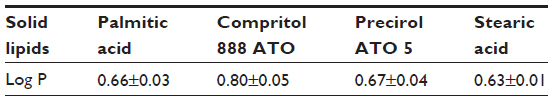 | Table 1 Partition coefficients (Log P) of TP between solid lipids and water |
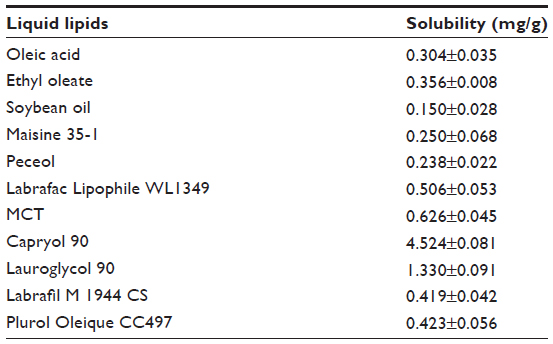 | Table 2 Solubility of TP in different liquid lipids |
Table 3 summarizes the calculated DSC parameters. Decreasing onset temperature and melting point were observed with increasing liquid lipid content, which was nearly linear up to 20% in the lipid blends, indicating good miscibility. Distortion of the lattice and reduced crystallinity were clearly seen from the decreased enthalpy (from 127.13 to 84.88 J/g), and were also characterized by the increased width of the melting event (from 6.44°C to 16.21°C). The onset temperature and melting point did not further decrease when oil content increased from 20% to 40%, which suggested that the limitation of the oil in the mixture might be approached and miscibility gap emerged.29 Additionally, mixing more than 40% of oil with solid lipid appeared to have no significant effects on the melting temperature and width of the melting event. Taken together, in order to enhance the solubility of TP and ensure the good miscibility of solid and liquid lipid, a binary mixture consisting of 20% (w/w) Capryol 90 and 80% (w/w) Compritol 888 ATO would be the most suitable combination of liquid and solid lipid for the formulation of TP-NLCs.
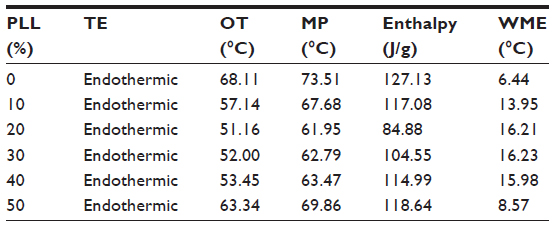 | Table 3 DSC parameters of the lipid blends with different liquid lipid contents |
Preparation and characteristics of TP- NLCs and TP-SLNs
TP-NLCs and TP-SLNs were successfully prepared by microemulsion technique. In a preliminary study, the critical variables (fraction of lipid, surfactant to co-surfactant ratio, and lipid to drug ratio) influencing the particle size and EE of TP-SLNs were adjusted, and the optimal condition was established for approaching the maximum EE using central composite design.20 TP-NLCs were developed from the optimized TP-SLNs.
The size of the TP-NLCs (231.8±4.3 nm) measured by photon correlation spectroscopy (PCS) was significantly larger (P<0.001) than the TP-SLNs (179.8±5.7 nm). Figure 1 shows transmission electron microscopy photographs and size distribution of the lipid nanoparticles. The particle shape appeared close to spherical (Figure 1A and C), and the size correlated well with PCS results. TP-NLCs had a smaller PDI (0.143±0.012 versus 0.283±0.012, P<0.001), which was verified by the presence of a certain amount of particles below 100 nm in TP-SLNs (Figure 1B and D). Moreover, the presence of Capryol 90 in TP-NLCs was useful to increase the EE from 56.5 to 71.6% compared to TP-SLNs.
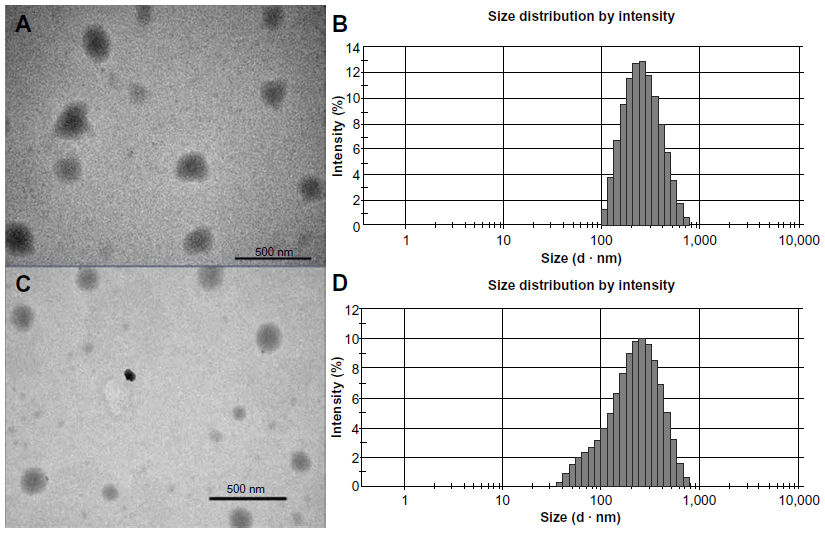 | Figure 1 Transmission electron microscopy photographs and size distribution measured by photon correlation spectroscopy. |
The particle growth of TP-NLCs was negligible (P>0.05), but the size of TP-SLNs significantly increased from 179.8±5.7 nm to 200.2±7.4 nm after 1-month storage (P<0.05; Figure 2). TP-NLCs exhibited good ability to reduce drug expulsion during storage, the EE only reduced from 71.6% to 69.1% (P>0.05; about 2.5% TP was expulsed). In contrast, 8.2% TP was expulsed from TP-SLNs under the same storage conditions (P<0.01).
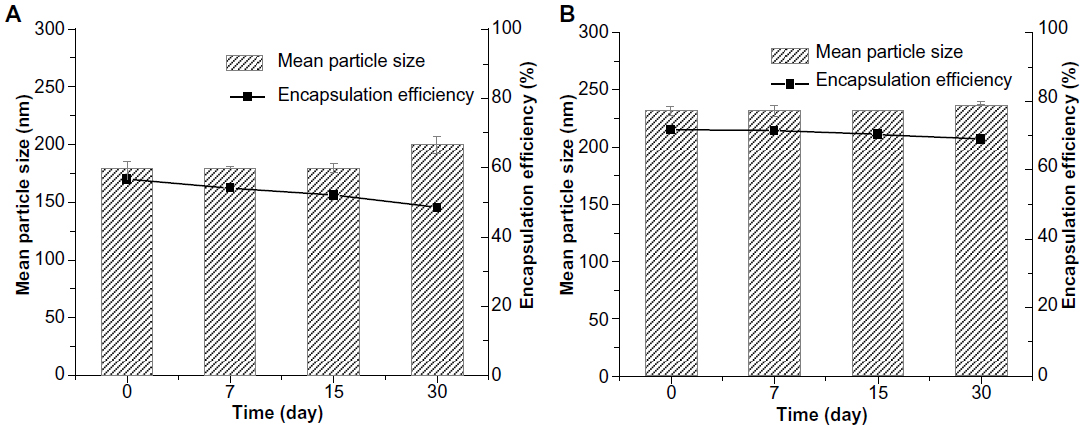 | Figure 2 The mean particle size and encapsulation efficiency of (A) TP-SLNs and (B) TP-NLCs against storage time at 4°C. Results are expressed as mean ± standard deviation (n=3). |
Thermal analysis
As shown in Figure 3, a very small peak was found in the physical mixture of TP and bulk lipid (1:55) at about 237°C (Figure 3B). In addition, the presence of TP in the bulk lipid was confirmed by depression in enthalpy of Compritol 888 ATO from 121.02 to 114.67 J/g. These results indicated that TP was not completely dissolved in the Compritol 888 ATO and therefore remained in a crystalline state in the solid lipid. However, the TP peak was lost in both TP-NLCs and TP-SLNs (Figure 3C and D). It could be deduced that TP in NLCs or SLNs was in an amorphous state.14 When Compritol was formulated as TP-SLNs, a depression in the melting point (3.75°C) and a 1.6-fold increase in peak width was observed (7.96°C versus 4.98°C). This phenomenon could be explained by the colloidal size effect as predicted by the Thomson equation30 and adsorption of an amphiphilic molecule (surfactant) on particle surface.31 The DSC diagrams showed a distinct peak shift to lower temperatures (68.83°C to 61.12°C) between TP-SLNs and TP-NLCs with a wider peak width (7.96°C versus 12.68°C) and lower enthalpy (95.13 versus 75.07 J/g), suggesting that miscible liquid lipid (Capryol 90) had an additional and greater effect with respect to colloidal size and surfactant to promote disordered arrangement and lattice defects.
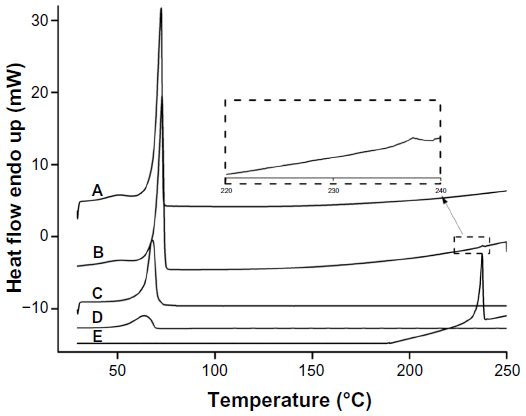 | Figure 3 Differential scanning calorimetry curves. (A) Compritol 888 ATO; (B) Physical mixture of TP and Compritol 888 ATO (1:55); (C) TP-SLNs; (D) TP-NLCs; (E) TP. |
In vitro release
The in vitro release profile of TP from the lipid nanoparticles in PBS (pH =6.8) is presented in Figure 4. A biphasic release was observed in both cases with rapid release up to 2 hours followed by sustained release until 48 hours. However, the retardation was prominent in the case of NLCs compared to SLNs. Only 39.6% of drug release was detected with NLCs, in contrast to 56.9% from SLNs after 2 hours (P<0.05). The accumulated drug release at 48 hours of TP-NLCs and TP-SLNs were 71.2% and 91.3%, respectively (P<0.001). These results are similar to those in some studies reporting that drugs incorporated in NLCs exhibited lower release behavior compared to SLNs.13,31,32
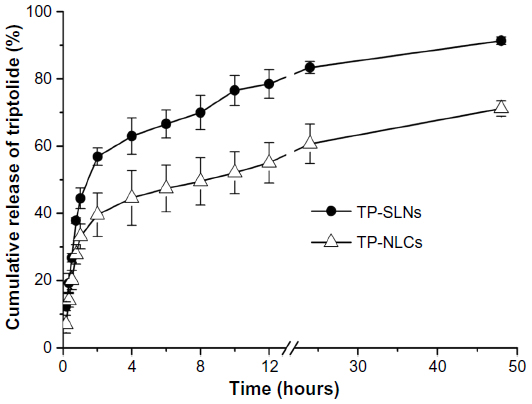 | Figure 4 In vitro release profile of TP-SLNs and TP-NLCs. |
In vivo pharmacokinetics
Validation of analytical methods
TP and internal standard (prednisolone) separated well from impurities in the plasma extracts, and the typical chromatograms showed a retention time of 4.4 and 12.2 minutes for TP and the internal standard, respectively (Figure 5). Validation of analytical methods was conducted following the US Food and Drug Administration (FDA) Guidance for Industry Bioanalytical Method Validation (2001). Over the range of 0.4–40 ng/mL, TP concentrations were linearly proportional to their chromatographic peak area/internal standard area (R2=0.999). The lower limit of quantification (LLOQ) of TP was 0.4 ng/mL (S/N >10). The intra- and inter-day precision, as defined by the relative standard deviation, ranged from 2.5% to 8.0%. Analytical accuracy, expressed as the percentage difference between the mean of measured value and the known concentration, varied from 2.3% to 7.6%. The methodology recoveries were greater than 85%.
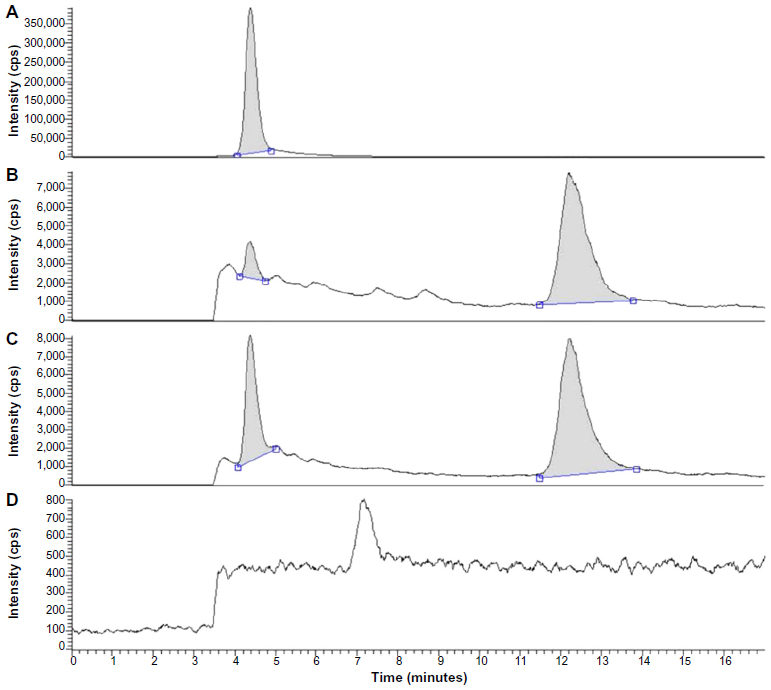 | Figure 5 Chromatograms for plasma. (A) Triptolide; (B) plasma added with 4 ng/mL triptolide and 4 μg/mL internal standard (prednisolone); (C) plasma sample after administration of TP-NLCs; (D) blank plasma. |
Pharmacokinetics
The plasma concentration-time profiles of TP after single oral administration of test formulations (free TP, TP-SLNs, and TP-NLCs) in rats are shown in Figure 6, and the pharmacokinetic parameters are tabulated in Table 4. The Tmax and t1/2z of free TP were 0.200 hours and 0.706 hours, respectively, similar to results reported in previous studies.8,9 In this study, the time to achieve maximum concentration of TP was delayed to 0.717 hours and 0.450 hours in the case of TP-NLCs (P<0.01) and TP-SLNs (P>0.05), respectively. MRT0–t and t1/2z were markedly longer (P<0.001, P<0.01, respectively) for both TP-NLCs and TP-SLNs compared to free TP. Interestingly, a significant decrease was found in the Cmax from 8.656 μg/L for free TP to 3.361 μg/L for TP-NLCs (P<0.01) and to 5.794 μg/L for TP-SLNs (P<0.05). Apparent clearance (CLz/F) was also found to be reduced in TP-NLCs (P<0.01) and TP-SLNs (P<0.05) compared to free TP. In addition, TP-NLCs and TP-SLNs gave mean values of the area under the curve from the time of dosing to the last observation (AUC0–t) 9.012 and 7.318 μg*hour/L, which were 1.54- and 1.25-fold higher, than that of free TP, respectively. These results showed the superiority of TP-NLCs over TP-SLNs, as also supported by prominent difference on MRT0–t (P<0.001), Tmax (P<0.05), and Cmax (P<0.05).
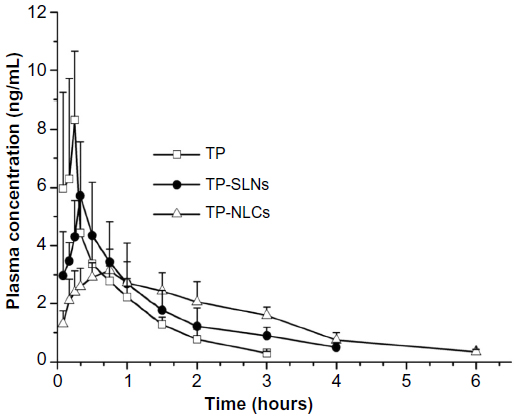 | Figure 6 Plasma concentration-time profiles. |
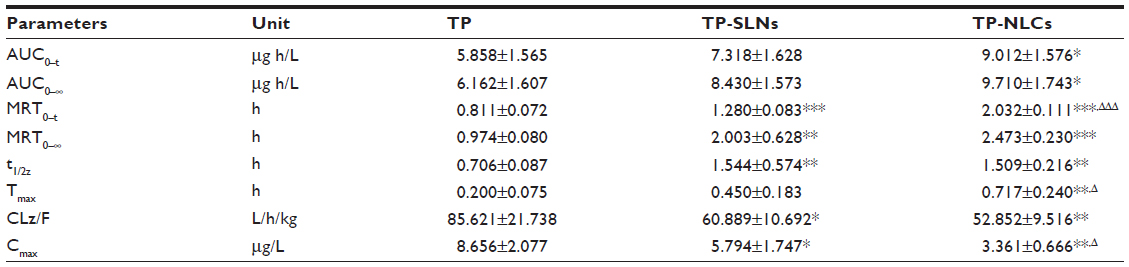 | Table 4 Pharmacokinetic parameters of free TP, TP-SLNs, and TP-NLCs after a single oral administration (500 μg/kg) in male rats |
Subacute toxicity study
Abnormal symptoms including piloerection and emaciation were observed in the two TP groups and high dose TP-SLNs group. An increase in body weight in rats from each test group during the 4-week drug administration period is shown in Figure 7, which is commonly used to evaluate the gastrointestinal toxicity of TP.33,34 In our study, statistically significant decreases in weight gains were found with high doses of free TP and TP-SLNs groups in the second week (P<0.01 and P<0.05, respectively). For the following week, the TP-NLCs group showed larger weight gains than the TP-SLNs group at the high dose level (P<0.05). After the last week, the decrease in weight gains in the TP-NLCs group was still markedly suppressed compared to the free TP group (P<0.01) and was much smaller than that of the TP-SLNs group (P<0.05) at the high dose level.
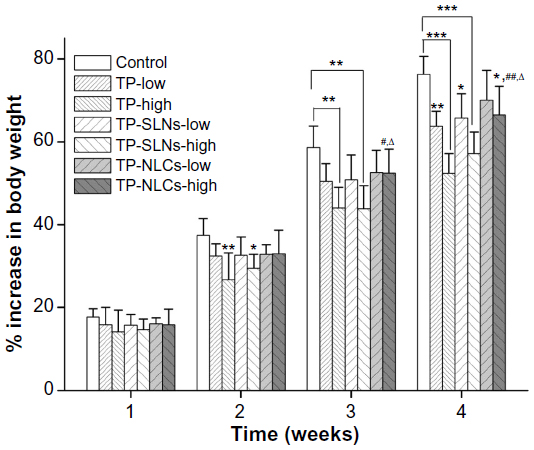 | Figure 7 Effects of TP, TP-SLNs, and TP-NLCs on the increase in body weight in male rats after a 4-week treatment period. |
Figure 8 displays the relative organ weights to body weight in rats of each test group after gavages for 4 weeks. It was reported that in male SD rats with a 400 μg/kg dose (orally administrated with TP for 28 days), relative weights of the hearts were increased.11 In this study, low dose of free TP (500 μg/kg) also increased relative heart weights of male rats exclusively (P<0.05). Relative weights of the heart (P<0.001), lung (P<0.05), liver (P<0.01), spleen (P<0.05), and kidney (P<0.05) were significantly increased in the high dose free TP group (600 μg/kg). There were no increases in relative weights of heart and lung in either TP-NLCs or TP-SLNs groups (P>0.05). At high dose levels, relative weights of the liver, spleen, and kidneys were close to control (P>0.05) in the TP-NLCs group only.
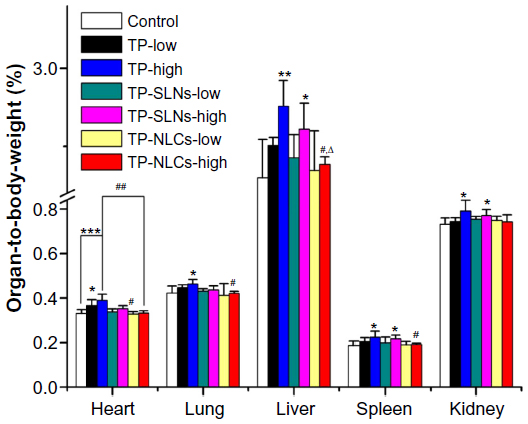 | Figure 8 Relative organ weights to body weight of male rats administered with low and high dose of TP, TP-SLNs, and TP-NLCs by gavage after a 4-week treatment period. |
Serum ALT and AST activities were used as biochemical markers of liver function.35 Figure 9A and B demonstrate that compared to the control group, both ALT and AST were significantly elevated by increasing the dose of free TP, indicating the occurrence of liver injury. For TP-NLCs and TP-SLNs, both groups showed no marked elevation at a dose of 500 μg/kg (P>0.05). However, by increasing the dose to 650 μg/kg, the two markers in the TP-SLNs group both showed no significant difference from the TP group. Notably, reduced ALT and AST were observed in the TP-NLCs group (P<0.01 and P<0.05, respectively).
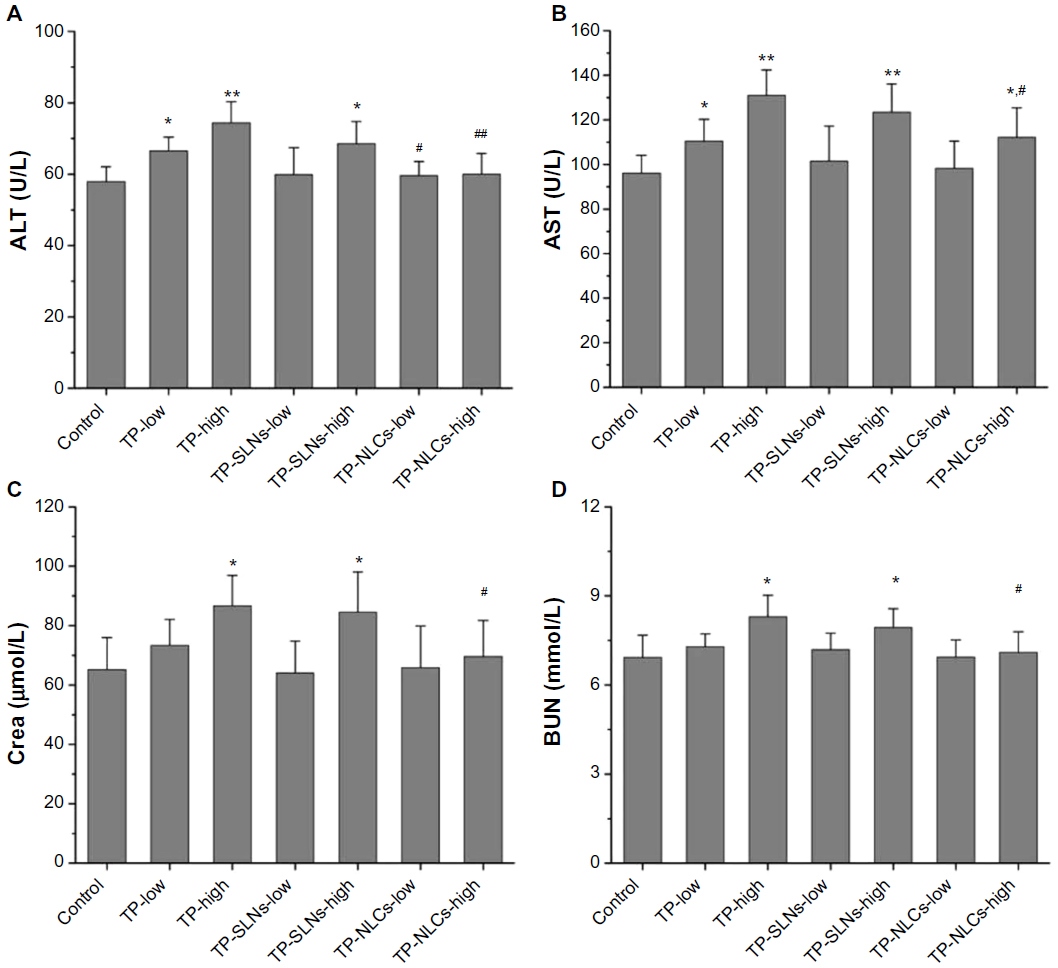 | Figure 9 Effects of TP, TP-SLNs, and TP-NLCs on (A) ALT and (B) AST activities, and (C) Crea and (D) BUN levels in the serum of male rats after a 4-week treatment period. |
Increased serum Crea and BUN concentrations suggest kidney dysfunction.36 A previous study indicated that nephrotoxicity in male SD rats was detected after oral administration with TP (600 μg/kg) for 15 days. BUN was significantly increased along with the histomorphological changes (including dilation of kidney proximal tubules).37 In our study, no significant differences in Crea and BUN were found between low dose of free TP and control groups (P>0.05). At a high dose of 650 μg/kg, both TP and TP-SLNs groups had higher Crea and BUN than the control group (P<0.05), while TP-NLCs showed no significant effects on Crea and BUN (Figure 9C and D).
MDA as an indicator of lipid peroxidation and SOD as the antioxidant enzyme are important markers of oxidative stress,38,39 which were assayed in the study. As shown in Figure 10, at the high dose level, in contrast with free TP, TP-NLCs showed significantly decreased oxidative stress as indicated by the increase in SOD activity and reduction of MDA formation (P<0.05), while the differences did not reach statistical significance in TP-SLNs.
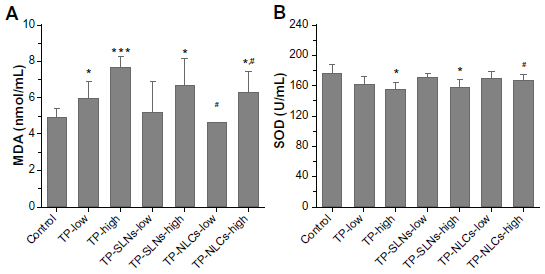 | Figure 10 Effects of TP, TP-SLNs, and TP-NLCs on (A) MDA level and (B) SOD activity in the serum of male rats after a 4-week treatment period. |
Microscopically, histopathological changes in liver, spleen, and kidneys were discovered in the high dose TP and TP-SLNs groups (650 μg/kg). Fatty degeneration in the hepatocytes, dead cells in the macrophages manifested as a starry sky appearance in the spleen, and obvious kidney proximal tubular dilation were seen (Figure 11), which were also observed in male mice after oral administration of TP.2 However, in the TP-NLCs group at the same dose, no apparent changes were found.
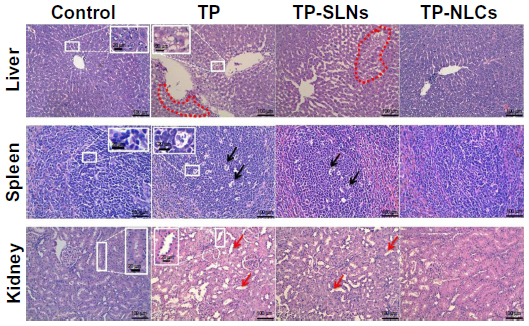 | Figure 11 Histopathologic changes in tissues of male rats after a 4-week treatment period. |
Discussion
TP has a high melting point (>200°C) and low n-octanol/water partition coefficient of 0.58,6 which may belong to the brick dust molecule. This kind of molecule possesses high lattice energy and its solubility is limited by solid-state, in which the strong intermolecular bonds within the crystal structure restrict the solubility of the molecule in water and in oils.40,41 Features of brick dust molecules could be the reason for the poor solubility of TP in lipids and low partition coefficients of TP between the solid lipids and water, which would result in difficulty to encapsulate TP into SLNs since the drug tended to partition toward the aqueous phase during the production process. We found that the microemulsion technique was more effective in solving this problem compared to the classic high pressure homogenization method.20 Lipid nanoparticles prepared by microemulsion technique were reported to have high EE even for hydrophilic drugs.13
NLCs were developed as a novel vehicle for TP in our present study. TP-NLCs (containing Compritol 888 ATO [solid lipid] and Capryol 90 [liquid lipid]) resulted in a larger mean particle size than TP-SLNs (containing Compritol 888 ATO only). The difference might be partly due to the fact that distances between fatty acid chains could be increased by using glycerides composed of fatty acids of different length, resulting in large spaces between the particles.12,32 As we know, Compritol 888 ATO contains relatively pure and long-chain fatty acids, while Capryol 90 is a medium-chain monoglyceride.42 In addition, Cremophor RH40 is polyoxyl 40 hydrogenated castor oil commonly utilized as an efficient hydrophilic emulsifier in preparation of lipid nanoparticles.21,43 The lipophilic segments (hydrogenated castor oil) partially inserted into lipid cores, whereas the hydrophilic polyoxyethylene chains protruded towards the external water phase to form stereospecific blockades and effectively reduced interfacial tension. Therefore, bulk lipids could be well homogenized in the aqueous phase and then become nano-sized particles. In the case of TP-NLCs formation, hydrophilic-lipophilic balance (HLB) value of Cremophor RH 40 might be adjusted owing to the presence of liquid lipid Capryol 90, which was a lipophilic surfactant with a HLB value of 6.28 The property of Capryol 90 affected the emulsifying capacity of Cremophor RH 40 leading to the production of larger particles. Furthermore, it has been suggested that surface active partial glycerides, such as Compritol 888 ATO, facilitated emulsification.30 The emulsifier system stabilized the particles below 100 nm in the case of SLNs, resulting in a larger size distribution (Figure 1B and D). The relative low content of Compritol 888 ATO in TP-NLCs compared to TP-SLNs might cause insufficient emulsification to form particles below 100 nm, making the PDI of TP-NLCs smaller than TP-SLNs.
TP-NLCs had a lower melting point with wider peak width and smaller enthalpy than TP-SLNs as shown by DSC analysis (Figure 3). These data explained and supported results of EE and storage stability that demonstrated a substantial difference in drug entrapment and expulsion between TP-NLCs and TP-SLNs (Figure 2).
In the in vitro release test, both TP-NLCs and TP-SLNs showed an initial burst release in the first 2 hours (Figure 4), which could be ascribed to the drug solubilized in surfactant micelles (unencapsulated drug) and incorporated at the surface of the lipid nanoparticles.23 The later sustained-release stage indicated that TP was stably retained in the lipid matrix for a determined duration followed by its slow release into the external phase.22 Less drug release from NLCs than SLNs was observed. Some possible reasons can explain this difference. For instance, in general, a higher load of the drug into nanoparticles allows a slower and more prolonged release.22 NLCs had more encapsulated TP located near the inner layer or in the tiny liquid nanocompartments contained by the solid matrix,12 and a long diffusion distance was obtained27 for TP. Another possibility for the higher release from SLNs is that its smaller size enlarged total surface area of nanoparticles, and an increased release rate would therefore be expected.27,32
After oral administration of free TP, the drug would dissolve in the gastrointestinal fluid and be absorbed rapidly because of its good permeability.6,9 As a result, relatively high Cmax and short Tmax were observed (Table 4). However, due to their small particle size, lipid nanoparticles could exhibit bioadhesion to the gastrointestinal tract wall thereby achieving a longer retention time,44 and a sustained release of TP as indicated by the in vitro release studies consequently led to lower Cmax and longer Tmax (Table 4). Similar results were found in a study of TP-SLNs.25 In addition, previous literature reports indicate that TP could be metabolized by cytochrome P4503A in human and rat liver microsomes (with cytochrome P4503A4 as the primary isoform responsible for hydroxylation).2,4 Thus, incorporation of TP in lipid nanoparticles might advantageously protect it from enzymatic degradation in the liver, resulting in reduced hepatic clearance, which was confirmed by reduced CLz/F and prolonged MRT and t1/2z (Table 4). On the other hand, these changes in pharmacokinetic profile could also be attributable to cytochrome P4503A4 inhibition by Cremophor RH 4045 and the fact that Compritol 888 ATO-based lipid nanoparticles were capable of going through lymphatic transport pathway and bypassing first-pass metabolism.14,46 This benefit is likely the result of the improved pharmacokinetic properties of both TP-NLCs and TP-SLNs after oral administration. In addition, more desirable pharmacokinetic parameters of TP-NLCs and smoother plasma concentration-time profile than TP-SLNs (Figure 6) might make TP-NLCs more effective at a lower dose and for a longer period of time (frequency and dose being the major considerations for TP associated toxicity) with reduced possibility of toxicity of overexposure of TP in plasma.
Changes in toxicokinetics and tissue distribution were considered as major reasons for the decreased reproductive toxicity observed with TP-SLNs.25 In the current study, toxicological profiles of TP-NLCs and TP-SLNs were further assessed after oral administration to male rats for 4 weeks. NLCs were found to be more effective in reducing toxicity induced by TP at a high dose of 650 μg/kg. Long-term oral administration of TP (100–400 μg/kg) would result in slower weight gain and changes in relative organ weight in male rats.11,34 Our data suggests that TP-NLCs could significantly inhibit the decrease of weight gain caused by TP in rats, showing better performance than TP-SLNs, especially at high doses (Figure 7). Relative weights of heart, lungs, liver, spleen, and kidneys in the TP-NLCs group were also significantly improved at high doses (Figure 8). We have previously studied the protective effect of TP-SLNs against the liver toxicity of TP (400 μg/kg) in male mice.19 TP-NLCs and TP-SLNs can also reduce the liver toxicity of TP (500 μg/kg) in male rats (Figure 9). However, at high doses (650 μg/kg), only TP-NLCs had a significant protective effect on the liver, spleen, and kidneys (Figures 9 and 11). Oxidative stress is related to the hepatotoxicity19,33 and nephrotoxicity3,47 induced by TP. Compared to free TP, TP-NLCs exhibited significantly reduced oxidative stress, which was verified by decreased MDA and improved SOD activity in rats serum at high doses (Figure 10), indicating better safety than TP-SLNs.
Hepatotoxicity and nephrotoxicity are the two most severe adverse reactions induced by TP leading to death in animals.1,3 These were not obviously observed when male SD rats were orally administrated with TP (400 μg/kg) for 28 days.11 An earlier study indicated that nephrotoxicity in male SD rats was detected after oral administration with TP (600 μg/kg) for 15 days.37 We investigated the effects of lipid nanoparticles on reducing the two most severe adverse reactions of TP. Results demonstrated that at a dose of 500 μg/kg, TP caused hepatotoxicity in rats was effectively reduced by TP-SLNs, whereas when the dose increased to 650 μg/kg, TP-SLNs failed to reduce both hepatotoxicity and nephrotoxicity induced by TP. In contrast, TP-NLCs still played a role and showed its superiority over TP-SLNs. It is noteworthy that in the high dose TP-NLCs group, weight gain was relatively low in the last week compared to the control group (Figure 7), and AST was slightly higher than in normal rats (Figure 10) though no obvious histopathologic changes in the liver were discovered (Figure 11). Therefore, 650 μg/kg would be the maximum safe dose of TP-NLCs when long-term oral administration is applied. We selected the two near dose levels considering the historical control data and the goal of determining the maximum safe dose of TP-NLCs, which were obtained based on experimental exploration.
The molecular toxic mechanism of TP is postulated to be its epoxide structure; this deficient electron donor in the body serves as the material basis of its toxicity, which occurs when covalently bound to biological macromolecules (such as deoxyribonucleic acid [DNA], ribonucleic acid [RNA], or some important enzymes containing rich electronic groups), and subsequently breaks these molecules.48 The reduced exposure of drug to physiological constituents due to the slower drug release and encapsulation in the carrier system could account for decreased toxicity profile of TP-NLCs. This effect has been also reported in the case of amphotericin B.49,50 We identified that the maximum safe dose of TP-NLCs was significantly increased compared to that of TP. In addition, the enhanced bioavailability would reduce the minimum effective dose of TP-NLCs in pharmacodynamic experiments, thus enlarging the therapeutic window of TP. In fact, the efficacy of TP-NLCs on chronic glomerulonephritis is underway in our laboratory.
We think that it would be meaningful and fruitful to conduct toxicokinetic experiments during the 4-week toxicity study for the three different formulations to correlate the kinetic behavior of the three formulations over time with the associated toxicology effects. These supplementary experiments would be of added value to our study and offer us insight into the correlation between pharmacokinetic alteration and reduced toxicity; we plan to do this work in a future study.
Conclusion
In the present study, we report the incorporation of TP into NLCs (TP-NLCs), and the feasibility of the resultant nanoparticles as a novel delivery system for solving the problems encountered in oral administration of free TP. Experimental results showed that TP-NLCs offered some unique characteristics, including relatively high encapsulation efficiency, good physical stability, and prolonged release profile. Furthermore, TP-NLCs decreased fluctuations of TP in plasma, resulting in the enhanced safety of TP. Thus, TP-NLCs should be considered a more promising carrier of TP compared to TP-SLNs.
Acknowledgments
The authors thank the Science and Technology Development Fund of Macau Special Administration Region (Grant No 040/2009/A2) and the National Basic Research Program of China (Grant No 2012CB932500) for the financial support.
Disclosure
The authors report no conflicts of interest in this work.
References
Zhou ZL, Yang YX, Ding J, Li YC, Miao ZH. Triptolide: structural modifications, structure-activity relationships, bioactivities, clinical development and mechanisms. Nat Prod Rep. 2012;29(4):457–475. | |
Xue X, Gong L, Qi X, et al. Knockout of hepatic P450 reductase aggravates triptolide-induced toxicity. Toxicol Lett. 2011;205(1):47–54. | |
Li J, Jin J, Li M, et al. Role of Nrf2 in protection against triptolide-induced toxicity in rat kidney cells. Toxicol Lett. 2012;213(2):194–202. | |
Ye X, Li W, Yan Y, et al. Effects of cytochrome P4503A inducer dexamethasone on the metabolism and toxicity of triptolide in rat. Toxicol Lett. 2010;192(2):212–220. | |
Chen H, Chang X, Weng T, et al. A study of microemulsion systems for transdermal delivery of triptolide. J Control Release. 2004;98(3):427–436. | |
Xue J, Jia XB, Tan XB, Jia DS, Jiang J, Zhang LY. Determination of apparent oil/water partition coefficient and absorption prediction of triptolide. Chin Pharm J. 2009;44(20):1560–1563. | |
Chessari G, Woodhead AJ. From fragment to clinical candidate – a historical perspective. Drug Discov Today. 2009;14(13–14):668–675. | |
Mao Y, Tao X, Lipsky PE. Pharmacokinetics of triptolide. Development and application of a high performance liquid chromatographic method for quantitation of triptolide in plasma. J Liq Chromatogr Relat Technol. 1999;22(9):1355–1366. | |
Shao F, Wang G, Xie H, Zhu X, Sun J, A J. Pharmacokinetic study of triptolide, a constituent of immunosuppressive chinese herb medicine, in rats. Biol Pharm Bull. 2007;30(4):702–707. | |
Li W, Liu Y, He YQ, et al. Characterization of triptolide hydroxylation by cytochrome P450 in human and rat liver microsomes. Xenobiotica. 2008;38(12):1551–1565. | |
Liu L, Jiang Z, Liu J, et al. Sex differences in subacute toxicity and hepatic microsomal metabolism of triptolide in rats. Toxicology. 2010;271(1–2):57–63. | |
Müller RH, Radtke M, Wissing SA. Nanostructured lipid matrices for improved microencapsulation of drugs. Int J Pharm. 2002;242(1–2):121–128. | |
Souza LG, Silva EJ, Martins AL, et al. Development of topotecan loaded lipid nanoparticles for chemical stabilization and prolonged release. Eur J Pharm Biopharm. 2011;79(1):189–196. | |
Zhuang CY, Li N, Wang M, et al. Preparation and characterization of vinpocetine loaded nanostructured lipid carriers (NLC) for improved oral bioavailability. Int J Pharm. 2010;394(1–2):179–185. | |
Müller RH, Petersen RD, Hommoss A, Pardeike J. Nanostructured lipid carriers (NLC) in cosmetic dermal products. Adv Drug Deliv Rev. 2007;59(6):522–530. | |
Pardeike J, Hommoss A, Müller RH. Lipid nanoparticles (SLN, NLC) in cosmetic and pharmaceutical dermal products. Int J Pharm. 2009;366(1–2):170–184. | |
Garg M, Dutta T, Jain NK. Reduced hepatic toxicity, enhanced cellular uptake and altered pharmacokinetics of stavudine loaded galactosylated liposomes. Eur J Pharm Biopharm. 2007;67(1):76–85. | |
Fan YF, Xie Y, Liu L, et al. Paeoniflorin reduced acute toxicity of aconitine in rats is associated with the pharmacokinetic alteration of aconitine. J Ethnopharmacol. 2012;141(2):701–708. | |
Mei Z, Li X, Wu Q, Hu S, Yang X. The research on the anti-inflammatory activity and hepatotoxicity of triptolide-loaded solid lipid nanoparticle. Pharmacol Res. 2005;51(4):345–351. | |
Zhang C, Gu C, Peng F, et al. Preparation and optimization of triptolide-loaded solid lipid nanoparticles for oral delivery with reduced gastric irritation. Molecules. 2013;18(11):13340–13356. | |
Joshi M, Patravale V. Nanostructured lipid carrier (NLC) based gel of celecoxib. Int J Pharm. 2008;346(1–2):124–132. | |
Chen CC, Tsai TH, Huang ZR, Fang JY. Effects of lipophilic emulsifiers on the oral administration of lovastatin from nanostructured lipid carriers: physicochemical characterization and pharmacokinetics. Eur J Pharm Biopharm. 2010;74(3):474–482. | |
Joshi M, Pathak S, Sharma S, Patravale V. Design and in vivo pharmacodynamic evaluation of nanostructured lipid carriers for parenteral delivery of artemether: Nanoject. Int J Pharm. 2008;364(1):119–126. | |
Xu L, Chen H, Xu H, Yang X. Anti-tumour and immuno-modulation effects of triptolide-loaded polymeric micelles. Eur J Pharm Biopharm. 2008;70(3):741–748. | |
Xue M, Zhao Y, Li XJ, et al. Comparison of toxicokinetic and tissue distribution of triptolide-loaded solid lipid nanoparticles vs free triptolide in rats. Eur J Pharm Sci. 2012;47(4):713–717. | |
Kasongo KW, Pardeike J, Müller RH, Walker RB. Selection and characterization of suitable lipid excipients for use in the manufacture of didanosine-loaded solid lipid nanoparticles and nanostructured lipid carriers. J Pharm Sci. 2011;100(12):5185–5196. | |
zur Mühlen A, Schwarz C, Mehnert W. Solid lipid nanoparticles (SLN) for controlled drug delivery – drug release and release mechanism. Eur J Pharm Biopharm. 1998;45(2):149–155. | |
Balakrishnan P, Lee BJ, Oh DH, et al. Enhanced oral bioavailability of dexibuprofen by a novel solid self-emulsifying drug delivery system (SEDDS). Eur J Pharm Biopharm. 2009;72(3):539–545. | |
Kovacevic A, Savic S, Vuleta G, Müller RH, Keck CM. Polyhydroxy surfactants for the formulation of lipid nanoparticles (SLN and NLC): effects on size, physical stability and particle matrix structure. Int J Pharm. 2011;406(1–2):163–172. | |
Jenning V, Thünemann AF, Gohla SH. Characterisation of a novel solid lipid nanoparticle carrier system based on binary mixtures of liquid and solid lipids. Int J Pharm. 2000;199(2):167–177. | |
Puglia C, Bonina F, Rizza L, et al. Lipid nanoparticles as carrier for octyl-methoxycinnamate: in vitro percutaneous absorption and photostability studies. J Pharm Sci. 2012;101(1):301–311. | |
Wang JJ, Liu KS, Sung KC, Tsai CY, Fang JY. Lipid nanoparticles with different oil/fatty ester ratios as carriers of buprenorphine and its prodrugs for injection. Eur J Pharm Sci. 2009;38(2):138–146. | |
Fu Q, Huang X, Shu B, et al. Inhibition of mitochondrial respiratory chain is involved in triptolide-induced liver injury. Fitoterapia. 2011;82(8):1241–1248. | |
Ni B, Jiang Z, Huang X, et al. Male reproductive toxicity and toxicokinetics of triptolide in rats. Arzneimittelforschung. 2008;58(12):673–680. | |
Awad ME, Abdel-Rahman MS, Hassan SA. Acrylamide toxicity in isolated rat hepatocytes. Toxicol In Vitro. 1998;12(6):699–704. | |
Courrèges JP, Bacha J, Aboud E, André L, Lamarca R. [Renal artery stenosis and chronic renal failure in NIDDM]. Arch Mal Coeur Vaiss. 1998;91(8):1077–1082. French. | |
Liu M, Dong J, Yang Y, Yang X, Xu H. Effect of poly(D, L-lactic acid) nanoparticles as triptolide carrier on abating rats renal toxicity by NMR-based metabolic analysis. J Nanosci Nanotechnol. 2008;8(7):3493–3499. | |
Akbay A, Cinar K, Uzunalimoglu O, et al. Serum cytotoxin and oxidant stress markers in N-acetylcysteine treated thioacetamide hepatotoxicity of rats. Hum Exp Toxicol. 1999;18(11):669–676. | |
Konar V, Kara H, Yilmaz M, Dayangac A, Karatas F. Effects of selenium and vitamin E, in addition to melatonin, against oxidative stress caused by cadmium in rats. Biol Trace Elem Res. 2007;118(2):131–137. | |
Wassvik CM, Holmén AG, Draheim R, Artursson P, Bergström CA. Molecular characteristics for solid-state limited solubility. J Med Chem. 2008;51(10):3035–3039. | |
Bergström CA, Wassvik CM, Johansson K, Hubatsch I. Poorly soluble marketed drugs display solvation limited solubility. J Med Chem. 2007;50(23):5858–5862. | |
Chen XQ, Gudmundsson OS, Hageman MJ. Application of lipid-based formulations in drug discovery. J Med Chem. 2012;55(18):7945–7956. | |
Chen YC, Liu DZ, Liu JJ, Chang TW, Ho HO, Sheu MT. Development of terbinafine solid lipid nanoparticles as a topical delivery system. Int J Nanomedicine. 2012;7:4409–4418. | |
Luo Y, Chen D, Ren L, Zhao X, Qin J. Solid lipid nanoparticles for enhancing vinpocetine’s oral bioavailability. J Control Release. 2006;114(1):53–59. | |
Elnaggar YS, El-Massik MA, Abdallah OY. Self-nanoemulsifying drug delivery systems of tamoxifen citrate: design and optimization. Int J Pharm. 2009;380(1–2):133–141. | |
Aji Alex MR, Chacko AJ, Jose S, Souto EB. Lopinavir loaded solid lipid nanoparticles (SLN) for intestinal lymphatic targeting. Eur J Pharm Sci. 2011;42(1–2):11–18. | |
Yang F, Ren L, Zhuo L, Ananda S, Liu L. Involvement of oxidative stress in the mechanism of triptolide-induced acute nephrotoxicity in rats. Exp Toxicol Pathol. 2012;64(7–8):905–911. | |
Xu L, Qiu Y, Xu H, Ao W, Lam W, Yang X. Acute and subacute toxicity studies on triptolide and triptolide-loaded polymeric micelles following intravenous administration in rodents. Food Chem Toxicol. 2013;57:371–379. | |
Tiyaboonchai W, Limpeanchob N. Formulation and characterization of amphotericin B-chitosan-dextran sulfate nanoparticles. Int J Pharm. 2007;329(1–2):142–149. | |
Jain S, Valvi PU, Swarnakar NK, Thanki K. Gelatin coated hybrid lipid nanoparticles for oral delivery of amphotericin B. Mol Pharm. 2012;9(9):2542–2553. |
 © 2014 The Author(s). This work is published and licensed by Dove Medical Press Limited. The full terms of this license are available at https://www.dovepress.com/terms.php and incorporate the Creative Commons Attribution - Non Commercial (unported, v3.0) License.
By accessing the work you hereby accept the Terms. Non-commercial uses of the work are permitted without any further permission from Dove Medical Press Limited, provided the work is properly attributed. For permission for commercial use of this work, please see paragraphs 4.2 and 5 of our Terms.
© 2014 The Author(s). This work is published and licensed by Dove Medical Press Limited. The full terms of this license are available at https://www.dovepress.com/terms.php and incorporate the Creative Commons Attribution - Non Commercial (unported, v3.0) License.
By accessing the work you hereby accept the Terms. Non-commercial uses of the work are permitted without any further permission from Dove Medical Press Limited, provided the work is properly attributed. For permission for commercial use of this work, please see paragraphs 4.2 and 5 of our Terms.