")
Back to Journals » OncoTargets and Therapy » Volume 8
MTA1 promotes proliferation and invasion in human gastric cancer cells
Authors Yao Y, Feng S, Xiao M, Li Y, Yang L, Gong J
Received 24 March 2015
Accepted for publication 23 April 2015
Published 20 July 2015 Volume 2015:8 Pages 1785—1794
DOI https://doi.org/10.2147/OTT.S85383
Checked for plagiarism Yes
Review by Single anonymous peer review
Peer reviewer comments 3
Editor who approved publication: Professor Daniele Santini
This paper has been retracted.
Yuan Yao,1 Shuting Feng,1 Mingming Xiao,2 Yan Li,1 Li Yang,1 Jiao Gong1
1Digestive System Department, 2Department of Pathology, The People’s Hospital of Liaoning Province, Shenyang, Liaoning, People’s Republic of China
Abstract: Although metastasis-associated protein 1 (MTA1) has been widely linked to tumor metastasis, the relevant mechanisms remain to be elucidated, especially in gastric cancer. The aim of this study was to examine whether the MTA1 gene is associated with the process of proliferation and invasion by regulating several molecular targets in gastric cancer. MTA1 expression in 61 gastric cancer tissue and adjacent noncancerous tissues was analyzed by immunohistochemistry. The prognostic value of MTA1 for overall survival and disease-free survival was determined by Kaplan–Meier estimates, and the significance of differences between curves was evaluated by the log-rank test. Furthermore, overexpression of MTA1 in SGC7901 and BGC823 cells promoted cell cycle progression, cell adhesion, and cell invasion. Our study found that MTA1 is overexpressed in gastric cancers, which contributes to malignant cell growth by facilitating cell cycle progression through upregulation of cyclin D1 and accelerates the migration and invasion of human gastric cancer cells by regulating expression of fibronectin and MMP2/MMP9. Taken together, MTA1 was involved in the pathogenesis of gastric cancer and might be a candidate therapeutic target in gastric cancer.
Keywords: cell cycle, cell adhesion, migration
Introduction
Gastric cancer is the fourth most common malignant tumor worldwide and the second most common cause of cancer-related deaths.1 Although the molecular mechanisms of gastric cancer proliferation and invasion have been widely studied, the prognosis of patients with gastric cancer is still poor. Therefore, further understanding of the molecular mechanisms of gastric cancer progression and the development of new therapeutic targets based on these mechanisms are anticipated.
Metastasis-associated protein 1 (MTA1) is predominantly a nucleus, ubiquitously expressed protein that markedly increases metastasis and aggressiveness of human cancers.2–4 The expression of MTA1 in cancer tissues was significantly higher than that of the normal tissue. MTA1 was found to be overexpressed in a variety of cancer cell lines and was also commonly amplified in several human colorectal and gastric carcinomas, ovarian and pancreatic tumors, and esophageal squamous cell carcinoma.5–8 High expression of the MTA1 mRNA in gastric carcinomas showed significantly higher rates of serosal invasion and lymph node metastasis and tended to have a higher rate of vascular involvement.5 MTA1 promotes tumor invasion by downregulation of E-cadherin.8 Although much has been learned about how MTA1 influences proliferation and metastasis, the contribution of many receptors to the proliferation and metastatic process in gastric carcinomas remains poorly defined.
MTA1 was proved to be a candidate metastasis-associated gene by differential expression screening of metastatic cell lines.9 A series of studies have demonstrated that MTA1 was overexpressed in highly metastatic cells, while the mechanism by which MTA1 promotes invasion in human gastric cancer cells is currently unknown. These investigations have increased our understanding of MTA1 function and led to the current study, which examines the effects of MTA1 on epithelial–mesenchymal transition (EMT), an important event to the invasion and metastasis of epithelial-like gastric carcinoma cells.
In this study, we evaluated MTA1 expression in gastric cancer tissues and adjacent gastric tissues. We then investigated possible correlations between MTA1 expression and the clinical pathologic factors. Based on the results of clinical findings, we performed in vitro experiments and studied the effects of MTA1 expression on the proliferation and invasion of gastric cancer cell lines. Our results indicate that MTA1 induces gastric cancer cell invasion and proliferation.
Materials and methods
Cell culture and plasmid construction
Human gastric cancer cell lines SGC7901, BGC823, SGC7901-MTA1, and BGC823-MTA1 were cultured in DMEM (Thermo Fisher Scientific, Waltham, MA, USA) supplemented with 10% fetal calf serum (Thermo Fisher Scientific) at 37°C in an incubator with a humidified atmosphere of 5% CO2 and 95% air. Primers were used for generating wild-type MTA1. Annealed primers were ligated into BamHI and XhoI double enzyme-digested pcDNA™3.1/Myc-His A vector to generate His-tagged MTA1 constructs. The constructs described earlier were verified by DNA sequencing.
Cell cycle analysis by flow cytometry
SGC7901 and BGC823 cells were transiently transfected with the increasing concentrations of His-MTA1 (0 μg, 1 μg, 2 μg), using Lipofectamine™ 2000 (Thermo Fisher Scientific). After incubation, cells were collected, washed with phosphate-buffered saline (PBS), fixed with 70% ethanol, and then suspended in a staining buffer (10 μg/mL propidium iodide, 0.5% Tween 20, 0.1% RNase in PBS). The cells were analyzed using an FACSVantage flow cytometer with the CellQuest acquisition and analysis software program (BD Biosciences, San Jose, CA, USA). Gating was set to exclude cell debris, doublets, and clumps.
Immunoblotting analysis
SGC7901 and BGC823 cells were stably transfected with Lipofectamine™ 2000 according to the manufacturer’s protocol. To determine the expression of protein, whole cell extracts were collected in RIPA lysis buffer (50 mM Tris/HCl pH 7.4, 150 mM NaCl, 1% NP-40, 0.25% Na-deoxycholate, 1 mM EDTA and protease inhibitor cocktail). Thirty micrograms of total protein was separated through electrophoresis on an SDS-PAGE gel and transferred to polyvinylidene fluoride membranes (GE Healthcare, Fairfield, CT, USA). The membrane were blocked at room temperature for 1 hour in Tris-buffered saline containing 0.1% Tween-20 (TBST) and 5% fat-free powdered milk, and incubated overnight with specific antibodies: MTA1 (1:500; Santa Cruz Biotechnology Inc., Dallas, TX, USA), cyclin D1, MMP2, MMP9, p21 (1:1,000; Cell Signaling, Boston, MA, USA), fibronectin (EMD Millipore, Billerica, MA, USA), and GAPDH (ShangHai Kangchen, People’s Republic of China) at 4°C. After incubation with the primary antibody, the membrane was then incubated with the secondary antibody for 2 hours and washed three times for 10 minutes in TBST prior to chemiluminescence detection (GE Healthcare). The intensity of the bands was quantified by computerized densitometry using Quantity-One software (version 4.62; Bio-Rad Laboratories Inc., Hercules, CA, USA). The relative optical density ratio was calculated by comparing to GAPDH.
Quantitative reverse transcriptase polymerase chain reaction
SGC7901 and BGC823 cells were stably transfected with His-tag MTA1. Cells were harvested following treatments for preparation of total RNA using TRIzol reagent (Thermo Fisher Scientific). One microgram of RNA was used as a template for complementary DNA synthesis using Quantitect Reverse Transcription Kit (TaKaRa, Japan). Polymerase chain reaction (PCR) was performed in triplicate using an Mx3000P™ Real-Time PCR System by Agilent (Stratagene, La Jolla, California, USA) and SYBR Green I detection (TaKaRa) according to the manufacturer’s protocol. PCR was carried out for 40 cycles of 95°C for 10 seconds and 60°C for 40 seconds. The following oligonucleotides (Thermo Fisher Scientific) were used for PCR amplification: MTA1 forward, 5′-CGC TGA CCA GCA TCA TTG AGT-3′; MTA1 reverse, 5′-TGG TTC GGA TTT GGC TTG TTA T-3′. p21 forward, 5′-GGC AGA CCA GCA TGA CAG ATT-3′ and p21 reverse, 5′-GCG GAT TAG GGC TTC CTC TT-3′. Cyclin D1 forward, 5′-GGA TGC TGG AGG TCT GCG A-3′; cyclin D1 reverse, 5′-AGA GGC CAC GAA CAT GCA AG -3′. The relative expression level of mRNA was normalized to GAPDH levels with the following specific primers: GAPDH forward, 5′-GAC AGT CAG CCG CAT CTT CT-3′; GAPDH reverse, 5′- ACA TGT AAA CCA TGT AGT TGA GGT-3′. Relative gene expression was calculated with Mx3000P software (version 2.0; Stratagene) by using the 2−ΔΔCt method. Statistical analysis significance was determined by parametric t-tests using SPSS 17.0 software (SPSS Inc, Chicago, IL, USA).
Cell adhesion assay
SGC7901-control, SGC7901-MTA1, BGC823-control, and BGC823-MTA1 cells were respectively suspended in 0.1% BSA/EBM-2 (2×10⁴ cells/500 μL) and seeded onto a fibronectin-coated 24-well Primaria culture dish (500 μL/well). After incubation in a 5% CO2 incubator for 10 minutes, nonadherent cells were removed by gently washing twice with 1 mL of PBS. Then, following fixation with 500 μL of 4% paraformaldehyde in PBS per well at 4°C for 5 minutes, the adhesive cells were stained with 0.4% Trypan blue and counted under fluorescent microscopy.
Cell invasion assay
Matrigel invasion assays were performed using modified Boyden chambers with polycarbonate Nucleopore membrane. Precoated filters (6.5 mm in diameter, 8 μm pore size, Matrigel 100 μg/cm2) were rehydrated with 100 μL medium. Then, 1×10⁵ cells in 100 μL serum-free DMEM supplemented with 0.1% bovine serum albumin were placed in the upper part of each chamber, whereas the lower compartments were filled with 600 μL DMEM containing 10% serum. After incubating for 18 hours at 37°C, non-invaded cells were removed from the upper surface of the filter with a cotton swab, and the invaded cells on the lower surface of the filter were fixed, stained, photographed, and counted under high-power magnification.
Patients and immunohistochemistry
We identified patients diagnosed with gastric cancer who underwent surgical resection of tumor at the Department of Pathology of the People’s Hospital of Liaoning Province (Shenyang, People’s Republic of China) between 2001 and 2005. Slides of tissue sections were subjected to deparaffinization and antigen unmasking. The slides were then incubated with the antibody against MTA1 at 4°C overnight. The slides were incubated with horseradish peroxidase-conjugated goat anti-mouse IgG, and the color was developed with the DAB Horseradish Peroxidase Color Development Kit (Fuzhou Maixin Biological Technology Ltd., People’s Republic of China). Multicenter ethical approval for data collection and tissue use was granted by the Human Research Ethics Committee of the aforementioned hospital.
Evaluation of immunostaining
All the immunoreactions were separately evaluated by two independent pathologists. The percentage of positive MTA1 tumor cells (0% negative, <5% weak positive, 5%–25% intermediate, 25%–50% moderate, 50%–100% strong) were assessed in at least five high-power fields (×400 magnification). The distribution of tumor cells in all experimental groups was determined as follows: 0%–5%= lower expression and 5%–100%= higher expression.
Statistical analysis
All statistical analysis was performed using the SPSS 16.0 statistical software program (SPSS Inc.). A χ2 test was used to examine possible correlations between MTA1 expression and clinicopathological characteristics for the results of immunohistochemistry. The data are expressed as the mean ± standard deviation. The statistical analysis correlation of data was checked for significance by Student’s t-test. Differences with P<0.05 were considered significant.
Results
The expression profiles of MTA1 in gastric cancer tissue
The expression of MTA1 in gastric cancer samples and adjacent noncancerous gastric tissues were analyzed by immunohistochemistry. The clinical characteristics of MTA1 patients are shown in Table 1. As shown in Figure 1A, MTA1 was mainly expressed in the nucleus of the cancer cells, and occasionally in the cytoplasm. Further analysis revealed that 77.0% (47/61) of gastric cancer tissues showed high expression of MTA1, in contrast to low expression in gastric cancer tissues.
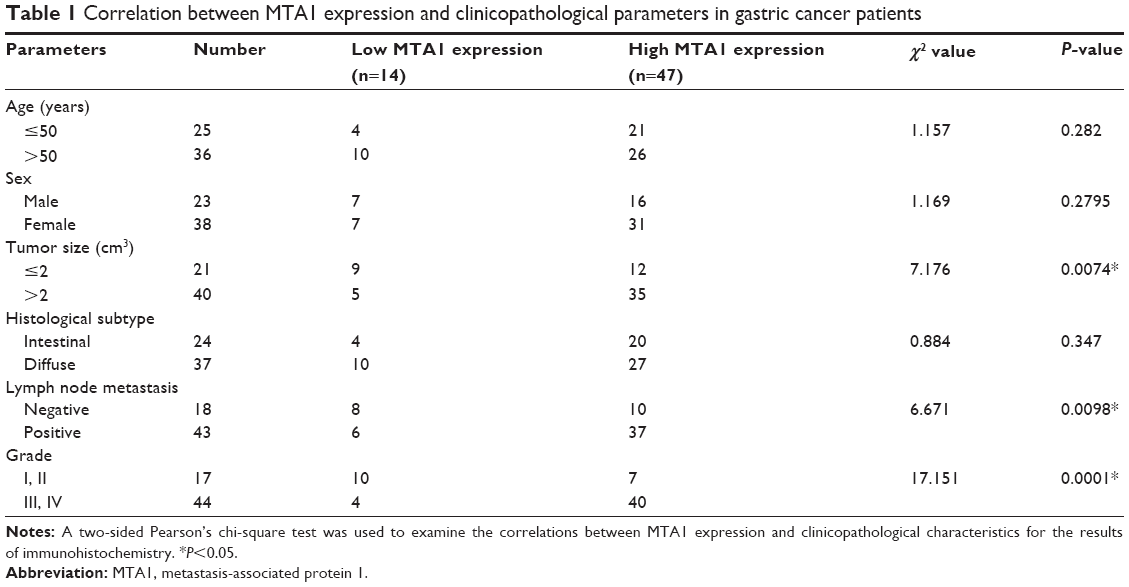 | Table 1 Correlation between MTA1 expression and clinicopathological parameters in gastric cancer patients |
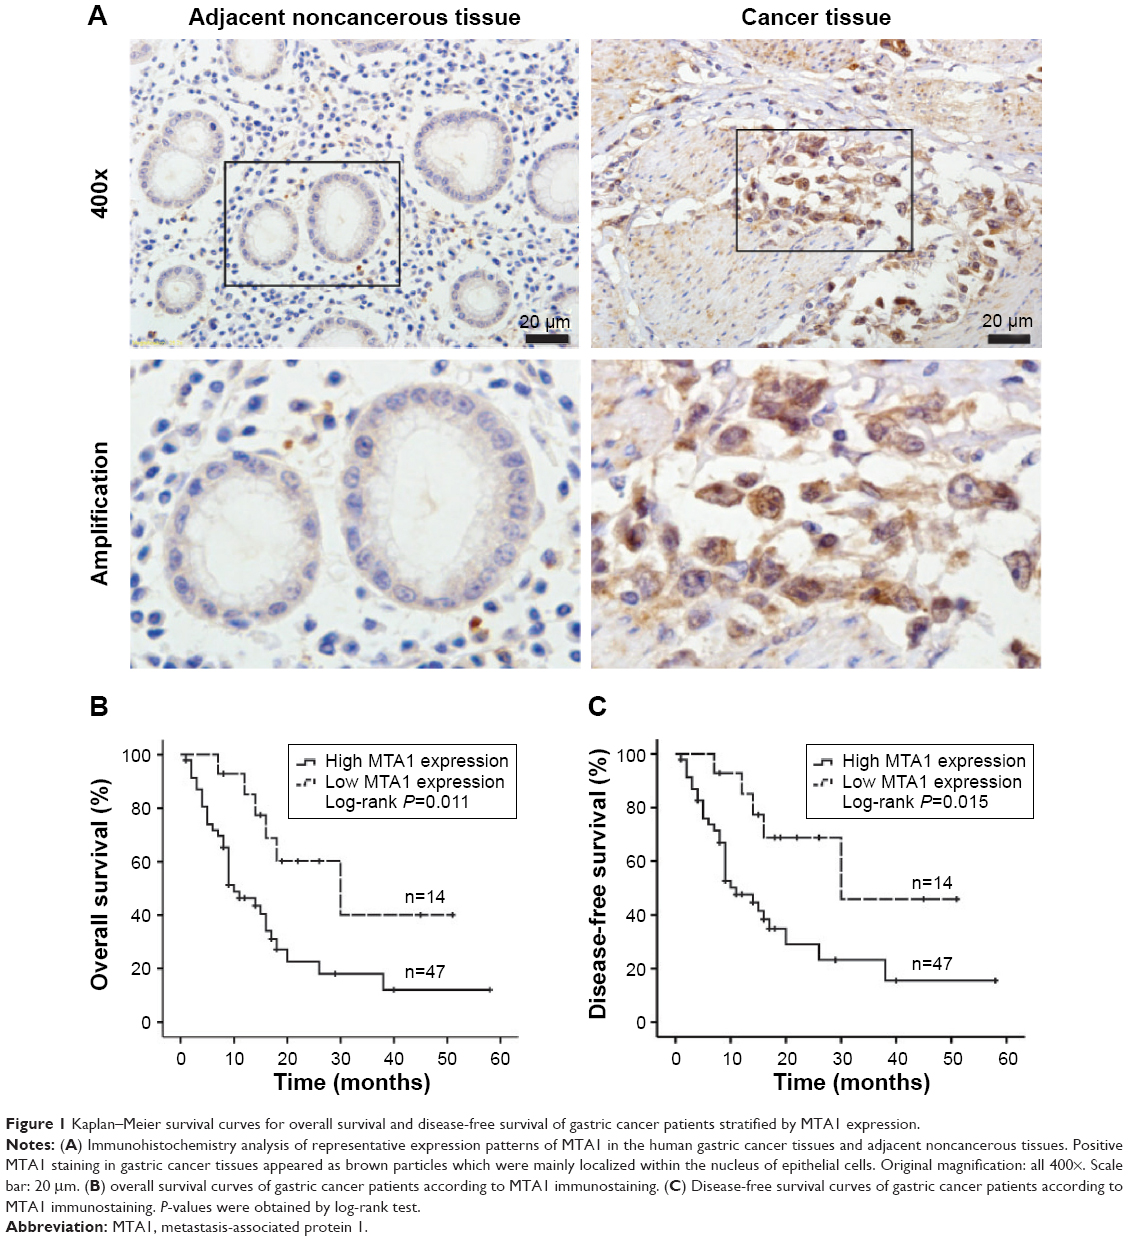 | Figure 1 Kaplan–Meier survival curves for overall survival and disease-free survival of gastric cancer patients stratified by MTA1 expression. |
Survival analysis correlation of MTA1 expression in gastric cancer
To elucidate the prognostic role of MTA1 expression in gastric cancer patients, we examined the relationship between MTA1 expression and patient outcome with long-term follow-up. Overall survival (OS) and disease-free survival (DFS) rates were estimated by Kaplan–Meier survival curves. As shown in the log-rank tests in Figure 1B and C, OS and DFS of gastric cancer patients with high MTA1 expression were lower than that of patients with high MTA1 expression (OS, P=0.011; DFS, P=0.015, respectively). It is evident that MTA1 may be a significant biomarker for evaluating the prognosis of gastric cancer patients.
MTA1 accelerates G1/S phase progression
We explored the effects of MTA1 on the cell cycle. SGC7901 and BGC823 cells were transiently transfected with different concentrations of MTA1 (0–2 μg) constructs for 36 hours. Cell populations in each phase of the cell cycle were examined by flow cytometry analysis. As the concentration of MTA1 continuously increased in SGC7901 (Figure 2A) and BGC823 (Figure 2B), cells showed a dramatic entry into S phase. Therefore, these cell cycle population patterns indicate that MTA1 expression may accelerate and potentiate G1/S phase progression in gastric cancer cells, and the difference is statistically significant.
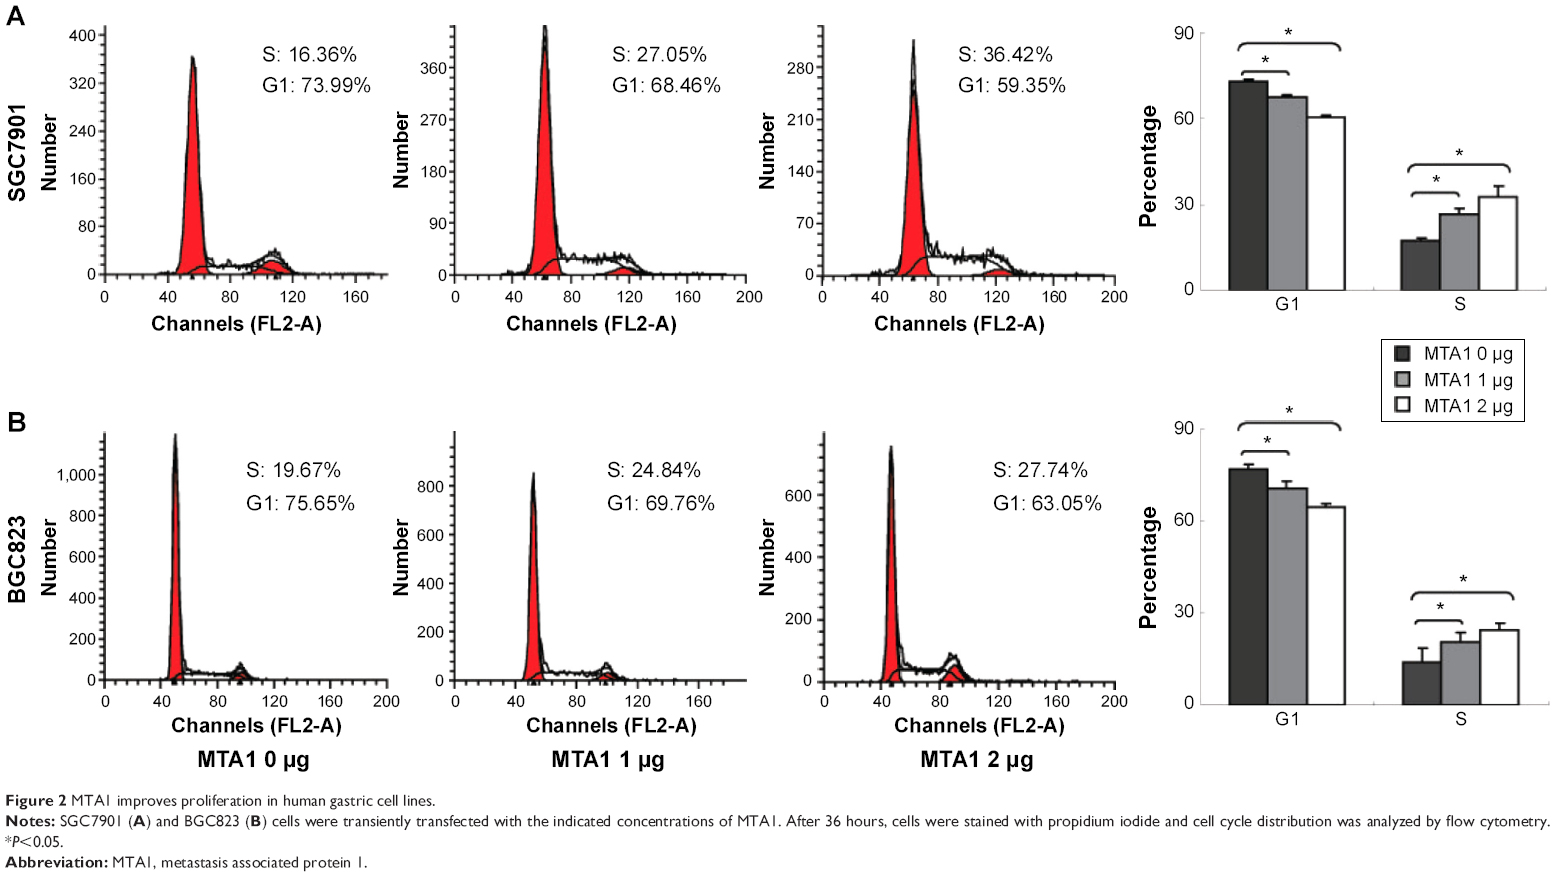 | Figure 2 MTA1 improves proliferation in human gastric cell lines. |
MTA1 promotes human gastric cancer cell proliferation by upregulation of cyclin D1 and downregulation of p21
To investigate whether MTA1 plays a role in the development and progression of gastric cancer cells, we transfected SGC7901 and BGC823 cells with control vector and MTA1 expression vectors and examined the effect of MTA1 overexpression on gastric cancer cell proliferation by Western blotting assay and real-time PCR assay. MTA1 overexpression increased cyclin D1 expression while significantly decreasing p21 expression (Figure 3A and B). The real-time PCR analysis results were consistent with those of the western blotting assays (Figure 3C and D). Taken together, the earlier results demonstrate that MTA1 accelerates the transition of cells from G1 to S phase through regulating cyclin D1 and p21.
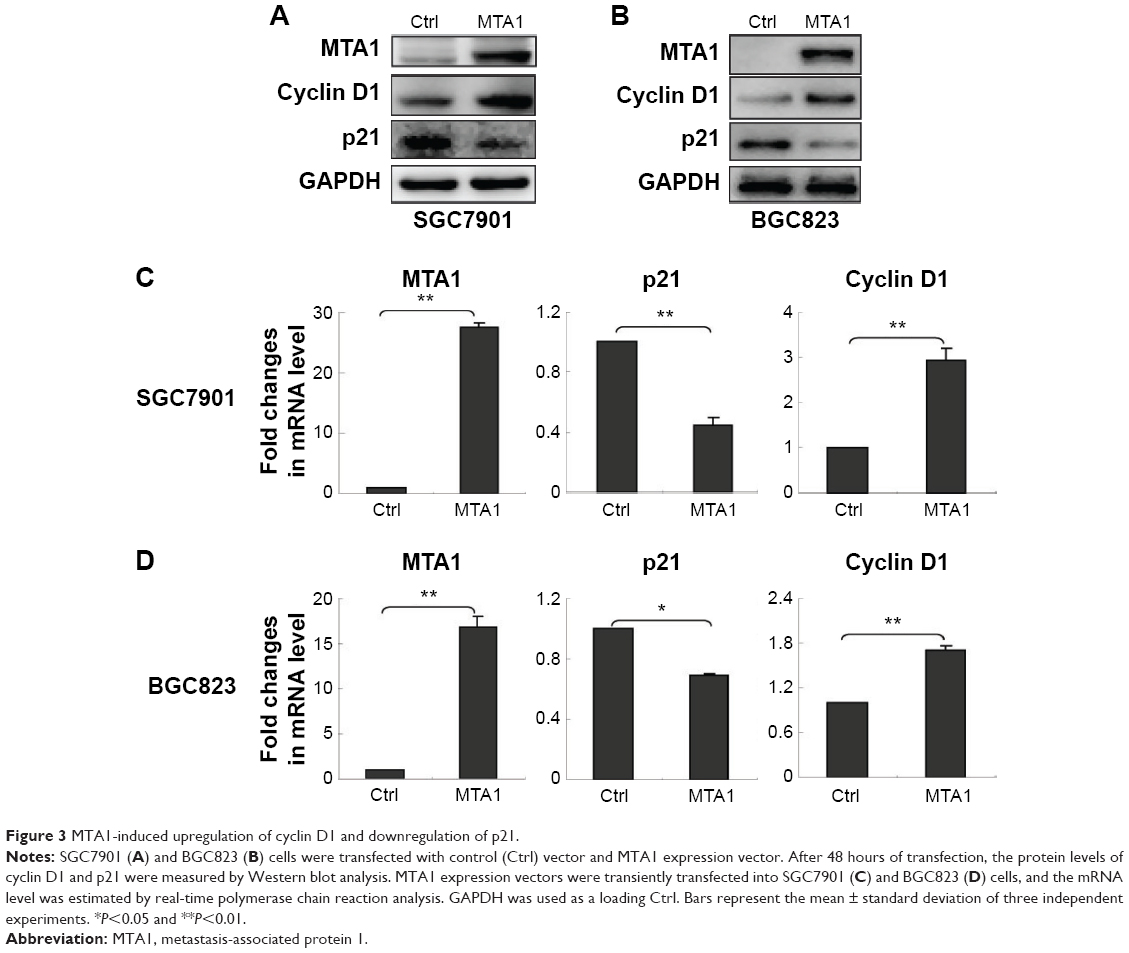 | Figure 3 MTA1-induced upregulation of cyclin D1 and downregulation of p21. |
MTA1 promotes gastric cancer cell adhesion ability
To investigate whether MTA1 can influence the ability of gastric cancer cell adhesion, we established the stable cell line SGC7901 and BGC823 cells overexpressing the MTA1. MTA1 overexpression promoted gastric cancer cell adhesion to fibronectin compared to empty vector transfected cells. Shown in Figure 4A and B, after 10 minutes’ incubation, compared with those infected with empty vector as control, SGC7901-MTA1 and BGC823-MTA1 cells resulted in a significant increase in adhesion of approximately 30% or 40% to fibronectin, respectively (Figure 4C and D).
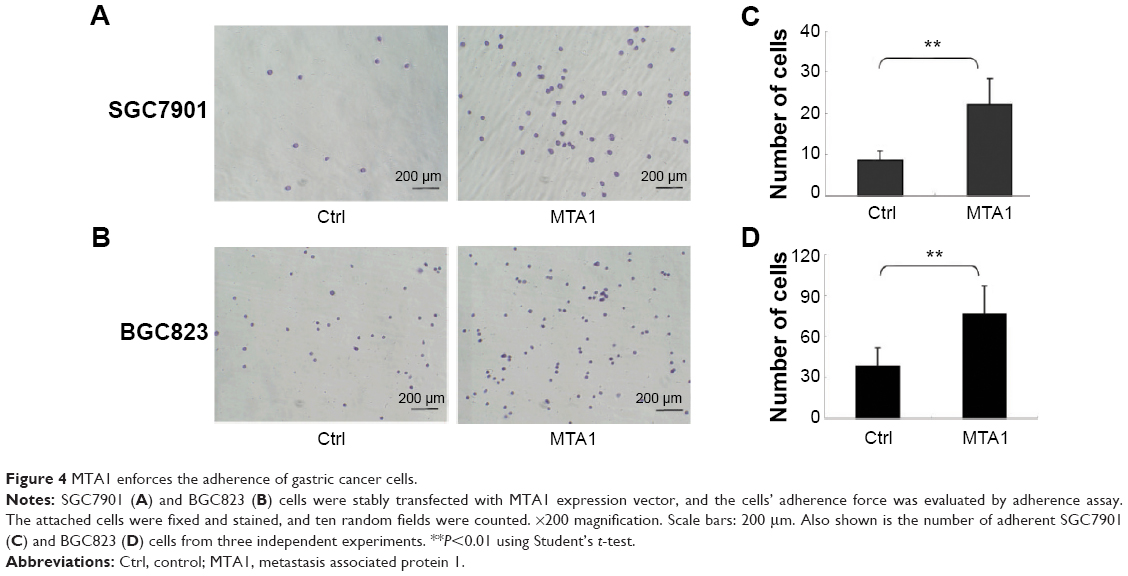 | Figure 4 MTA1 enforces the adherence of gastric cancer cells. |
MTA1 promoted the migratory and invasive potential of gastric cancer cells
In order to demonstrate the effect of MTA1 expression on the migration and invasion of SGC7901 and BGC823, in vitro Transwell migration and Matrigel invasion assays were performed based on the principle of the Boyden chamber assay. The results showed that overexpression of MTA1 accelerated the migration and invasion of SGC7901 and BGC823 (Figure 5A and B). Fibronectins, which are markers of a mesenchymal marker, were expressed significantly more in the MTA1-overexpressed SGC7901 and BGC823 cells compared with the respective empty vector-transfected cells. Furthermore, matrix metalloproteinases (MMPs) can stimulate epithelial–mesenchymal transition by facilitating enhanced tumor cell invasion and metastasis potential.10,11 Therefore, we checked the expression levels of MMP9 and MMP2 in MTA1-overexpressing SGC7901 and BGC823 cells by Western blotting. The results showed an increase in MMP2 and MMP9 levels (Figure 5C and D). MTA1 expression in gastric cancer cells supports the metastatic process via modulating metalloproteinases.
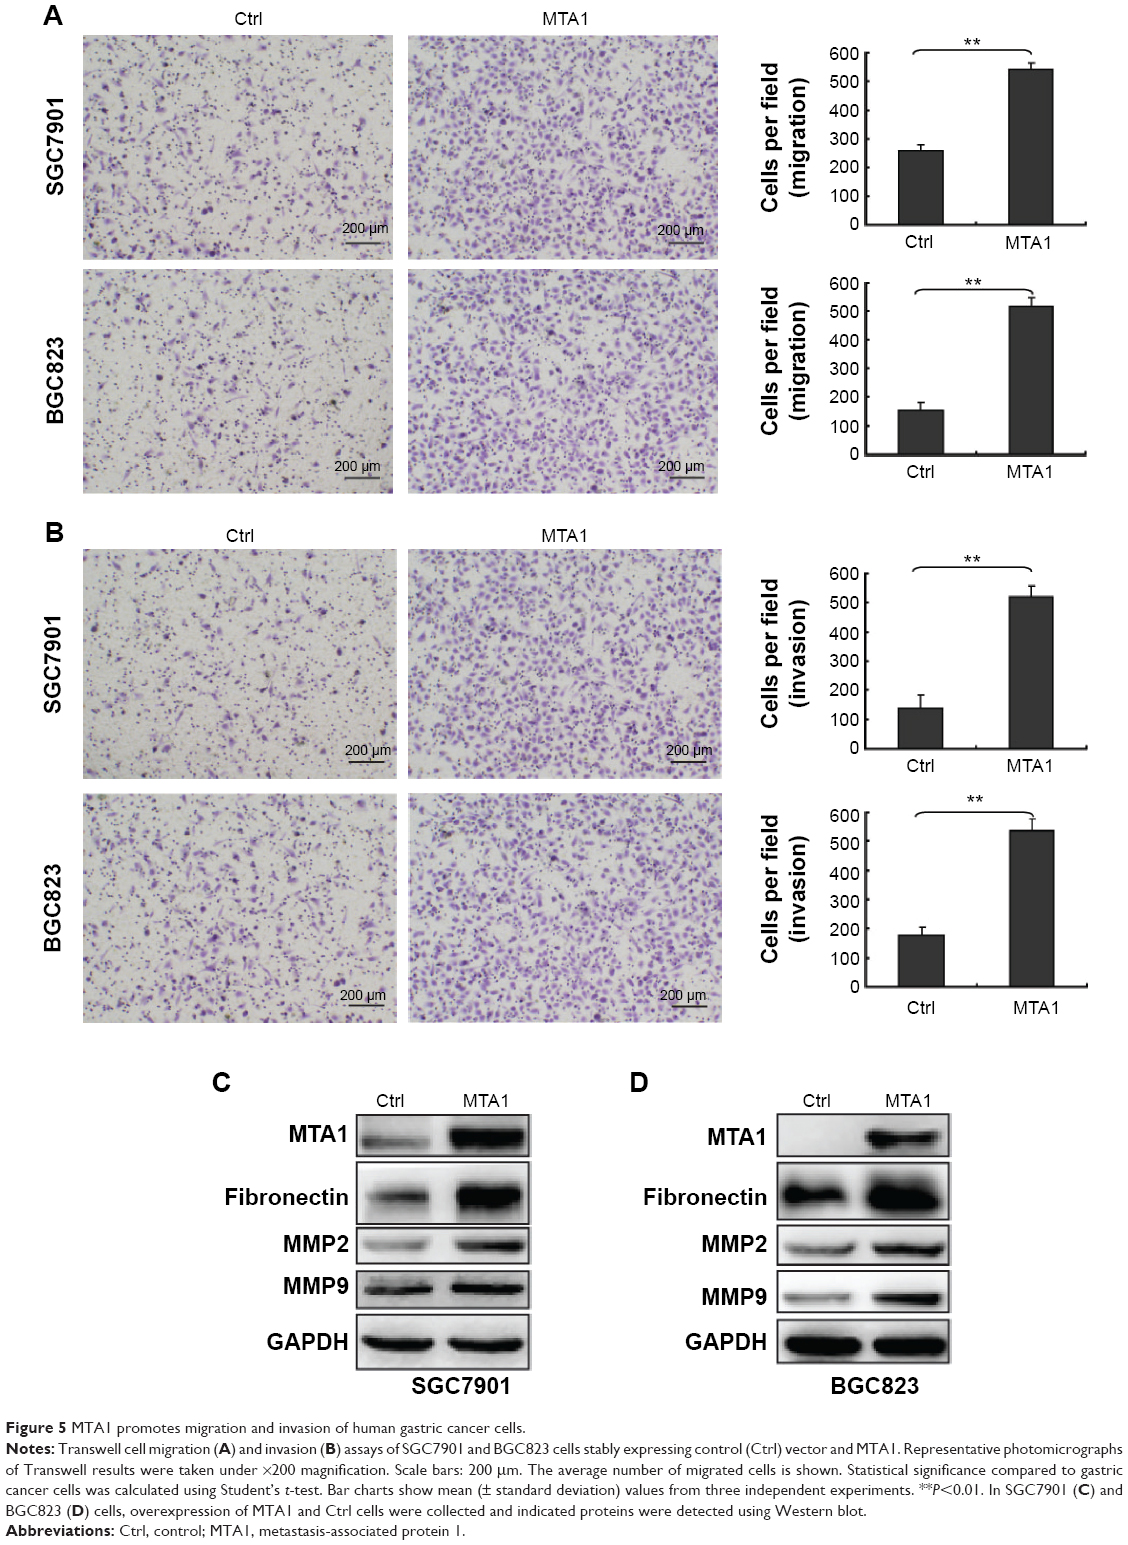 | Figure 5 MTA1 promotes migration and invasion of human gastric cancer cells. |
Discussion
MTA1 is widely upregulated in a variety of human cancers, including head and neck, lung, breast, liver, gastrointestinal, pancreatic, ovarian, and prostate cancers; melanoma; and lymphomas.12 An accumulation of evidence confirms MTA1 promotes invasiveness and metastasis in cancer cells.13,14 Recent studies have identified that MTA1 inhibited differentiation and promoted proliferation in cancer cell lines.3,15,16 Though these studies have shown that MTA1 is involved in cancers, the precise role of it in cancers including gastric cancer is not well understood.
MTA1 is associated with cell invasiveness and metastasis. MTA1 interacts with ERα and consequently is identified as a transcription repressor of ERα in ER-positive breast cancer.17 The high level of MTA1 suggests development of ER-negative phenotypes as well as resistance to tamoxifen and leads to distant organ metastases.18 Furthermore, MTA1 interacts with the E-cadherin chromatin to repress its transcription and promotes cancer cell invasion.19 MTA1 can recruit HDACs to the SMAD7 promoter and repress the transcription of SMAD7, which acts as a negative regulator of TGF-β.20 MTA1 thus appears to regulate TGF-β signaling and influences regulation of other genes downstream of TGF-β which might be required for tumorigenesis and metastasis.
MTA1 is associated with proliferation, angiogenesis, and DNA repair in human cancer. MTA1 promotes nasopharyngeal carcinoma cell growth via enhancing G1 to S phase transition.21 Downregulation of MTA1 led to suppression of the protein levels of cyclin D1 in human breast cancer cell.22 Furthermore, MTA1 promotes cell proliferation by enhancing DNA repair in epithelial ovarian cancer cells.15
MTA1-overexpressing cells had significantly higher proliferation rates than control cells. These results were further evaluated in cell cycle progression by cell cycle analysis and Western blot analysis of cyclin D1 and p21. In this study, MTA1 overexpression in human gastric cancer cell lines resulted in premature entrance into the S phase. The expression of cyclin D1 influences cell cycle progression and cancer cell proliferation. Taken together, these results indicate that MTA1 overexpression causes high enough levels of cyclin D1 for the cell to initiate DNA replication and be in the extended S phase, resulting in cell growth and proliferation.
Our data show a novel function of MTA1 as an important regulator of proliferation and metastasis in gastric cancer cells. We found that MTA1 stimulates expression of cyclin D1 and silencing of cell cycle regulator p21, which play an important role in the development and progression of cancer cells. Furthermore, MTA1 has been shown to induce cancer cell migration and invasion.6,23,24 High expression of MTA1 may contribute to a more severe malignancy compared with the control groups in SGC7901 cell line and BGC823 cell line. MTA1 upregulates the expression of fibronectin, MMP2, and MMP9, which are associated with tumor invasion, metastasis, angiogenesis, and poor clinical outcome.25
Herein, we have shown that MTA1 stimulates proliferation and epithelial–mesenchymal transition of gastric cancer cells. Therefore, blocking expression of MTA1 might prove useful for inhibiting gastric cancer cell progression and metastatic potential and may provide new targets for anticancer treatment.
Conclusion
Taken together, the data suggest that MTA1 is highly expressed in gastric cancer tissue; high MTA1 expression is significantly correlated with tumor size, lymph node metastasis, and grade; and MTA1 may function as a regulator of gastric cancer through regulation of cell cycle progression, cell adhesion, and cell invasion. Moreover, high MTA1 expression in gastric cancer tissue was associated with poorer prognosis, which may potentially have clinical impact on diagnosis and therapeutic considerations of this malignancy.
Acknowledgment
This research was supported by a research grant from the National Natural Science Foundation of the People’s Republic of China (number 31201053).
Disclosure
The authors report no conflicts of interest in this work.
References
Jemal A, Bray F, Center MM, Ferlay J, Ward E, Forman D. Global cancer statistics. CA Cancer J Clin. 2011;61(2):69–90. | ||
Toh Y, Nicolson GL. The role of the MTA family and their encoded proteins in human cancers: molecular functions and clinical implications. Clin Exp Metastasis. 2009;26(3):215–227. | ||
Kaur E, Gupta S, Dutt S. Clinical implications of MTA proteins in human cancer. Cancer Metastasis Rev. 2014;33(4):1017–1024. | ||
Sen N, Gui B, Kumar R. Role of MTA1 in cancer progression and metastasis. Cancer Metastasis Rev. 2014;33(4):879–889. | ||
Toh Y, Oki E, Oda S, et al. Overexpression of the MTA1 gene in gastrointestinal carcinomas: correlation with invasion and metastasis. Int J Cancer. 1997;74(4):459–463. | ||
He X, Zhou C, Zheng L, Xiong Z. Overexpression of MTA1 promotes invasiveness and metastasis of ovarian cancer cells. Ir J Med Sci. 2014;183(3):433–438. | ||
Iguchi H, Imura G, Toh Y, Ogata Y. Expression of MTA1, a metastasis-associated gene with histone deacetylase activity in pancreatic cancer. Int J Oncol. 2000;16(6):1211–1214. | ||
Weng W, Yin J, Zhang Y, Qiu J, Wang X. Metastasis-associated protein 1 promotes tumor invasion by downregulation of E-cadherin. Int J Oncol. 2014;44(3):812–818. | ||
Nagaraj SR, Shilpa P, Rachaiah K, Salimath BP. Crosstalk between VEGF and MTA1 signaling pathways contribute to aggressiveness of breast carcinoma. Mol Carcinog. 2015;54(5):333–350. | ||
Lin CY, Tsai PH, Kandaswami CC, et al. Matrix metalloproteinase-9 cooperates with transcription factor Snail to induce epithelial-mesenchymal transition. Cancer Sci. 2011;102(4):815–827. | ||
Bae GY, Choi SJ, Lee JS, et al. Loss of E-cadherin activates EGFR-MEK/ERK signaling, which promotes invasion via the ZEB1/MMP2 axis in non-small cell lung cancer. Oncotarget. 2013;4(12):2512–2522. | ||
Marzook H, Deivendran S, Kumar R, Pillai MR. Role of MTA1 in head and neck cancers. Cancer Metastasis Rev. 2014;33(4):953–964. | ||
Pakala SB, Rayala SK, Wang RA, et al. MTA1 promotes STAT3 transcription and pulmonary metastasis in breast cancer. Cancer Res. 2013;73(12):3761–3770. | ||
Singh RR, Kumar R. MTA family of transcriptional metaregulators in mammary gland morphogenesis and breast cancer. J Mammary Gland Biol Neoplasia. 2007;12(2–3):115–125. | ||
Yang QY, Li JH, Wang QY, et al. MTA1 promotes cell proliferation via DNA damage repair in epithelial ovarian cancer. Genet Mol Res. 2014;13(4):10269–10278. | ||
Liu J, Xu D, Wang H, et al. The subcellular distribution and function of MTA1 in cancer differentiation. Oncotarget. 2014;5(13):5153–5164. | ||
Mazumdar A, Wang RA, Mishra SK, et al. Transcriptional repression of oestrogen receptor by metastasis-associated protein 1 corepressor. Nat Cell Biol. 2001;3(1):30–37. | ||
Gururaj AE, Holm C, Landberg G, Kumar R. Breast cancer-amplified sequence 3, a target of metastasis-associated protein 1, contributes to tamoxifen resistance in premenopausal patients with breast cancer. Cell Cycle. 2006;5(13):1407–1410. | ||
Kai L, Wang J, Ivanovic M, et al. Targeting prostate cancer angiogenesis through metastasis-associated protein 1 (MTA1). Prostate. 2011;71(3):268–280. | ||
Salot S, Gude R. MTA1-mediated transcriptional repression of SMAD7 in breast cancer cell lines. Eur J Cancer. 2013;49(2):492–499. | ||
Song Q, Zhang H, Wang M, et al. MTA1 promotes nasopharyngeal carcinoma growth in vitro and in vivo. J Exp Clin Cancer Res. 2013;32(1):54. | ||
Jiang Q, Zhang H, Zhang P. ShRNA-mediated gene silencing of MTA1 influenced on protein expression of ER alpha, MMP-9, Cyclin D1 and invasiveness, proliferation in breast cancer cell lines MDA-MB-231 and MCF-7 in vitro. J Exp Clin Cancer Res. 2011;30:60. | ||
Xue H, Wang H, Liu J, et al. MTA1 downregulation inhibits malignant potential in a small cell lung cancer cell line. Oncol Rep. 2015;33(2):885–892. | ||
Tuncay Cagatay S, Cimen I, Savas B, Banerjee S. MTA-1 expression is associated with metastasis and epithelial to mesenchymal transition in colorectal cancer cells. Tumour Biol. 2013;34(2):1189–1204. | ||
Bauvois B. New facets of matrix metalloproteinases MMP-2 and MMP-9 as cell surface transducers: outside-in signaling and relationship to tumor progression. Biochim Biophys Acta. 2012;1825(1):29–36. |
 © 2015 The Author(s). This work is published and licensed by Dove Medical Press Limited. The full terms of this license are available at https://www.dovepress.com/terms.php and incorporate the Creative Commons Attribution - Non Commercial (unported, v3.0) License.
By accessing the work you hereby accept the Terms. Non-commercial uses of the work are permitted without any further permission from Dove Medical Press Limited, provided the work is properly attributed. For permission for commercial use of this work, please see paragraphs 4.2 and 5 of our Terms.
© 2015 The Author(s). This work is published and licensed by Dove Medical Press Limited. The full terms of this license are available at https://www.dovepress.com/terms.php and incorporate the Creative Commons Attribution - Non Commercial (unported, v3.0) License.
By accessing the work you hereby accept the Terms. Non-commercial uses of the work are permitted without any further permission from Dove Medical Press Limited, provided the work is properly attributed. For permission for commercial use of this work, please see paragraphs 4.2 and 5 of our Terms.