")
Back to Journals » Diabetes, Metabolic Syndrome and Obesity » Volume 7
Metabolic profiling of plasma amino acids shows that histidine increases following the consumption of pork
Authors Samman S, Crossett B, Somers M, Bell K, Lai N, Sullivan D, Petocz P
Received 9 January 2014
Accepted for publication 11 March 2014
Published 19 June 2014 Volume 2014:7 Pages 203—210
DOI https://doi.org/10.2147/DMSO.S60382
Checked for plagiarism Yes
Review by Single anonymous peer review
Peer reviewer comments 3
Samir Samman,1 Ben Crossett,2 Miles Somers,1 Kirstine J Bell,1 Nicole T Lai,1,3 David R Sullivan,3 Peter Petocz4
1Discipline of Nutrition and Metabolism, 2Discipline of Proteomics and Biotechnology, School of Molecular Bioscience, University of Sydney, Sydney, NSW, Australia; 3Department of Clinical Biochemistry, Royal Prince Alfred Hospital, Sydney, NSW, Australia; 4Department of Statistics, Macquarie University, Sydney, NSW, Australia
Abstract: Amino acid (AA) status is determined by factors including nutrition, metabolic rate, and interactions between the metabolism of AA, carbohydrates, and lipids. Analysis of the plasma AA profile, together with markers of glucose and lipid metabolism, will shed light on metabolic regulation. The objectives of this study were to investigate the acute responses to the consumption of meals containing either pork (PM) or chicken (CM), and to identify relationships between plasma AA and markers of glycemic and lipemic control. A secondary aim was to explore AA predictors of plasma zinc concentrations. Ten healthy adults participated in a postprandial study on two separate occasions. In a randomized cross-over design, participants consumed PM or CM. The concentrations of 21 AA, glucose, insulin, triglycerides, nonesterified fatty acids, and zinc were determined over 5 hours postprandially. The meal composition did not influence glucose, insulin, triglyceride, nonesterified fatty acid, or zinc concentrations. Plasma histidine was higher following the consumption of PM (P=0.014), with consistently higher changes observed after 60 minutes (P<0.001). Greater percentage increases were noted at limited time points for valine and leucine + isoleucine in those who consumed CM compared to PM. In linear regression, some AAs emerged as predictors of the metabolic responses, irrespective of the meal that was consumed. The present study demonstrates that a single meal of PM or CM produces a differential profile of AA in the postprandial state. The sustained increase in histidine following the consumption of a PM is consistent with the reported effects of lean pork on cardiometabolic risk factors.
Keywords: amino acid, glucose, insulin, nonesterified fatty acids, triglycerides, zinc
Introduction
Plasma amino acid (AA) status is determined by many factors including dietary adequacy and metabolic rate, and the interactions that occur between the metabolism of AA, carbohydrates, and lipids.1,2 Analysis of the plasma AA profile, together with markers of glucose and lipid metabolism, will shed light on the overall network of metabolic regulation and the relationships among the measurable plasma metabolites that can be monitored.
A number of AAs have been implicated in glucose and lipid metabolism. The postprandial insulin response can be substantially increased by the ingestion of a mixture of AAs and/or proteins,1,2 and AAs such as tryptophan (Trp) are associated with appetite control and behavior.3 The existing literature that reports on high protein diets has shown favorable metabolic responses, including weight loss, and improved cardiometabolic risk factors4,5 and energy expenditure following the consumption of pork as the main source of protein.6
Dietary proteins from different sources have differential effects on cholesterol metabolism,7 possibly due to their AA composition. For instance, animals fed a high dietary ratio of lysine (Lys) to arginine (Arg) (Lys:Arg) are reported to have hyperlipidemia and a propensity to atherosclerosis as compared to animals fed a lower Lys:Arg ratio;8 moreover, the addition of Arg ameliorates this effect.9 Similarly, the consumption of Arg was found to improve endothelial function acutely in patients with cardiovascular disease.10,11
Proteins from animal sources deliver bioavailable inorganic nutrients such as iron and zinc.12,13 We have shown that the consumption of pork meat by young women maintains hemoglobin levels to the same extent as low-dose iron supplementation,14 and an analysis of a sample of the adult population in the United States showed that fresh pork contributed 21% of the total dietary intake of zinc.15 The relationship between circulating AA and mineral concentrations is largely unexplored and warrants further investigation.
Metabolomic techniques could help identify AAs that are associated with metabolic responses following the consumption of meals that contain different sources of protein. We propose to investigate the acute metabolic responses in humans following the consumption of meals that contain either pork (PM) or chicken (CM) meat as the dietary sources of protein, and to identify the relationships between plasma AA and markers of glycemic and lipemic control in healthy individuals. A secondary aim was to explore potential AA predictors of plasma zinc concentrations.
Materials and methods
Participants
Ten adults were recruited through advertising and leaflet distribution on the University of Sydney campus (Sydney, NSW, Australia). Volunteers were screened using a short questionnaire and they were selected based on age (18–35 years). Exclusion criteria included vegetarians; individuals with philosophical or religious reasons for not consuming pork; those who were pregnant, lactating, or reported a major illness (for example, gastrointestinal disease); a body mass index (BMI) >30 kg/m2; and those consuming nutritional supplements or medication. All volunteers were requested to maintain their habitual diet and exercise regimens during the study. The University of Sydney Human Ethics Review Committee approved the study (protocol number 15143), and all subjects gave written informed consent prior to their participation.
Study design
Healthy male and female volunteers participated in a postprandial study on two separate occasions, 2–3 weeks apart. In a randomized cross-over design, participants consumed a meal that contained meat obtained from pork (PM) or chicken (CM) as the main source of protein, and which was prepared in a sweet and sour sauce and served with rice (50 g, cooked weight). The meals were isocaloric (1,164 kJ and 1,181 kJ per serving, PM and CM, respectively), consisting of similar quantities of dietary protein (31 g and 27 g, respectively), fat (5 g and 7 g, respectively), and carbohydrates (27 g in both meals). The meals were formulated and prepared by a food service dietitian (Master Catering Services Pty Ltd, Lidcombe, NSW, Australia).
Subjects were asked to refrain from engaging in exercise or drinking alcoholic beverages on the day preceding the study. The subjects reported to a metabolic unit in a fasting (12 hours) state, where they rested in a seated position before blood samples were obtained. An indwelling cannula (EBOS Healthcare, Kingsgrove, NSW, Australia) was inserted into the antecubital vein, which was maintained patent by infusion with sodium chloride (EBOS Healthcare). Blood samples were collected into lithium heparin vacutainer tubes (BD, Franklin Lakes, NJ, USA) at timed intervals. After the baseline (0 hours) blood sample was collected, the participants were provided with either PM or CM and were requested to consume the entire meal within 15 minutes. Additional blood samples were collected at 0.5 hours, 1 hour, 1.5 hours, 2 hours, 2.5 hours, 3 hours, 4 hours, and 5 hours postprandially. Plasma was recovered immediately by centrifugation (1,000× g, 15 minutes, 4°C) and stored at −80°C until subsequent analysis. The subjects remained mainly sedentary during the test period, but they were allowed to walk within a restricted area of the metabolic unit, read, or use their computers. No food was provided following the meal, but water was readily available.
Biochemical and anthropometric measurements
The subjects’ height was measured to the nearest 0.1 cm (Harpenden Stadiometer; Holtain Ltd, Crymych, UK), and they were weighed, in light clothing and no shoes, to the nearest 0.1 kg on an electronic scale (Tanita Corporation of America, Inc., Arlington Heights, IL, USA). Weight and height were used to calculate BMI.
All analytical procedures were carried out as a batch, which included all samples for each participant. Plasma glucose concentrations were analyzed using a glucose hexokinase assay (Hoffman-La Roche, Ltd, Basel, Switzerland) adapted for use on an autoanalyzer (Hoffman-La Roche Ltd; Hitachi 912®; Hitachi Ltd, Tokyo, Japan; Boehringer Mannheim GmbH, Mannheim, Germany). Plasma insulin concentrations were measured using a competitive radioimmunoassay (Coat-A-Count; Diagnostic Products Corporation, Los Angeles, CA, USA). Plasma triglycerides were analyzed on a cobas® 8000 analyzer (Hoffman-La Roche) using enzymatic reagents supplied by Hoffman-La Roche. Analysis of nonesterified fatty acids (NEFA) was performed on an autoanalyzer (Konelab 20XT; Thermo Scientific, Swedesboro, NJ, USA) using enzymatic reagents supplied by Wako Pure Chemical Industries, Ltd (Osaka, Japan). Plasma zinc concentrations were determined using inductively coupled plasma mass spectrometry (MS) (Agilent 7500ce; Agilent Technologies, Santa Clara, CA, USA). Samples were diluted (1:40 v/v) in ammonium ethylenediaminetetraacetic acid using rhodium as an internal standard and measured against a matrix-matched standard curve.16
Amino acid analysis
Alanine (Ala), Arg, asparagine, aspartic acid, cysteine, glutamic acid, glutamine, glycine, histidine (His), isoleucine (Iso), leucine (Leu), Lys, methionine, ornithine (Orn), proline, phenylalanine, serine, threonine, Trp, tyrosine (Tyr), and valine (Val), all with purity ≥98%, were purchased from Sigma-Aldrich (St Louis, MO, USA). All analytical procedures were based on the method of Wei et al.17 Briefly, samples were thawed gradually by placing them sequentially at −20°C for 2 hours, 4°C for 1 hour, and room temperature for 30 minutes. Plasma was incubated in extraction buffer (80% [v/v] ethanol, 0.1% [v/v] formic acid) at 4°C for 2 hours, and then it was centrifuged. The supernatant was centrifuged further in a vacuum centrifuge (Eppendorf, Hamburg, Germany). The dry extract was then stored at −20°C until required.
The high-performance liquid chromatography (HPLC) mobile phase (A) was 0.1% (v/v) acetic acid and the mobile phase (B) was acetonitrile. Each cycle was 9.5 minutes and started at 0% B with a flow rate at 0.1 mL/minute for 1 minute, there was linear increase to 100% B in 30 seconds and hold at 100% B for 4 minutes at 0.2 mL/minute, followed by a return to 0% B and hold for 4 minutes at 0.1 mL/minute. Aliquots (100 μL) of each sample were dispensed into HPLC plates (Agilent Technologies) with a plastic cover to avoid evaporation. Metabolites were injected in technical triplicates onto a Luna® Phenyl-Hexyl column (1.0×50 mm, 5 μm particle size, fitted with a guard cartridge; Phenomenex Inc., Torrance, CA, USA) using an Agilent 1200 HPLC system (Agilent Technologies). The column was coupled to a QTRAP® 5500 quadrupole ion trap MS, which was fitted with a TurboV™ ion source (AB SCIEX, Framingham, MA, USA). The polarity for the ionization mode was set at positive and the ion spray potential was set at 5,000 V. The ion source gas 1 and 2 were set at 40 psi. The curtain and collision gases (ultra-high purity nitrogen) were set at 20 psi and medium, respectively. The source temperature was set at 400°C. The declustering potential, collision energy, and product ions were optimized manually. The dwell time for all AAs was 50 ms.
The liquid chromatography–MS/MS data were analyzed using MultiQuant™ 2.0 software (AB SCIEX). The relative quantity of the metabolite was determined by integrating the area under the curve. All chromatograms were checked manually for their peak shape and retention time. Gaussian smooth width was set at three points, and the noise percentage was set at 40%. The mean value of the triplicate samples was calculated after ensuring the coefficient of variation was <5%.
Statistical analyses
Paired Student’s t-tests were used to determine whether the average postprandial responses over 5 hours differed between CM and PM. As the shapes of the PM and CM curves were qualitatively similar, an average value was intended as a summary measure. Stepwise regression was used to identify whether any of the AAs at baseline or at peak values were able to predict the response to any of the metabolic variables. Differential effects of CM and PM on plasma glucose, insulin, triglycerides, NEFA, and zinc concentrations were tested by a general linear model with meal as the fixed factor, subject as the random factor, and any quantitative variables identified by the regression as covariates. Statistical analyses were carried out using IBM SPSS version 20 (IBM Corporation, Armonk, NY, USA) (http://www-01.ibm.com/software/analytics/spss/). A value of P<0.05 was taken to designate statistical significance.
Results
Ten subjects (four male, six female) completed both metabolic profile test days. Their mean age was 24.9 years (range: 18–32 years) and their BMI was 20.8 kg/m2 (range: 18.9–24.0 kg/m2). The participants’ characteristics are shown in Table 1. There were no significant differences between any of the metabolic parameters at baseline during the two test days.
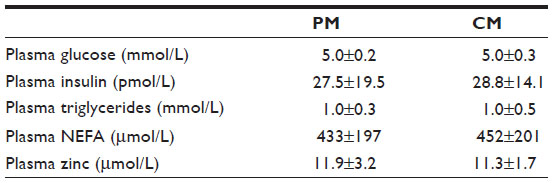 | Table 1 The participants’ metabolic profilesa prior to consuming each test meal |
The meal composition did not influence the postprandial plasma glucose, insulin, triglyceride, NEFA, or zinc concentrations. Following the consumption of either CM or PM, significant increases were observed for plasma glucose (P<0.001) and insulin (P<0.001) concentrations, reaching peak values at 30 minutes. Plasma NEFA concentrations decreased significantly (P<0.001) to a nadir between 30–90 minutes then rose gradually to baseline values. Plasma triglyceride (Figure 1) and zinc concentrations (data not shown) showed no significant change from baseline values.
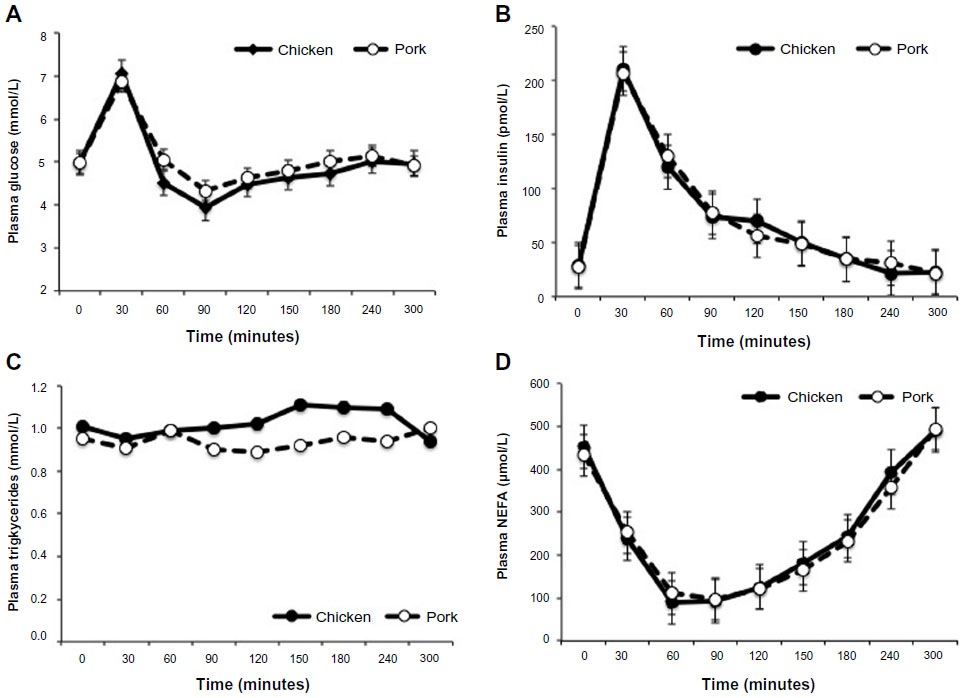 | Figure 1 Postprandial concentrations of plasma glucose (A), insulin (B), triglycerides (C), and nonesterified fatty acids (D), following the consumption of meals that contain chicken or pork. |
The response of plasma AA was affected by the test meal (Figure 2). The mean concentrations (calculated over 5 hours) of plasma Val and Leu + Iso were significantly higher following the consumption of CM (P=0.050 and P=0.017, respectively) as compared to PM. Significantly greater percent increases were noted at 180 minutes postprandially (P<0.01) for Val and Leu + Iso in those who consumed CM compared to PM. In contrast, the mean concentration of plasma His was significantly higher postprandially (P=0.014) in those who consumed PM, with consistently higher changes from baseline observed after 60 minutes (P<0.001). Ala, Arg, Lys, methionine, Orn, proline, phenylalanine, Tyr, and Trp were not statistically significant different (data not shown). Asparagine, aspartic acid, cysteine, glutamic acid, glutamine, serine, and threonine were below the limit of detection following the consumption of CM or PM.
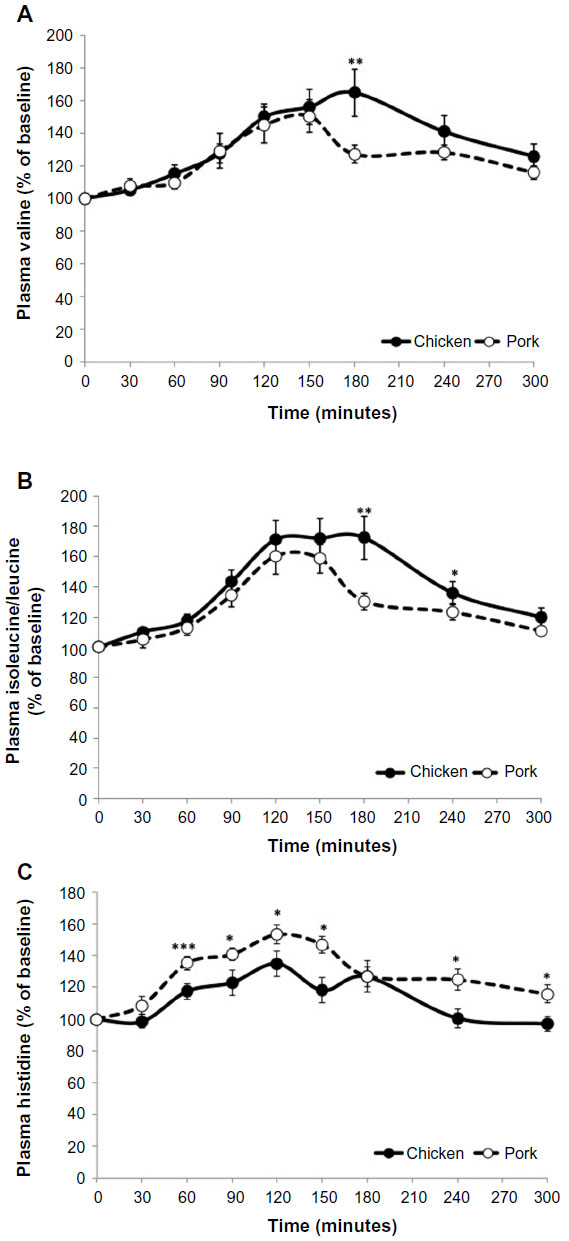 | Figure 2 Postprandial response of plasma valine (A), isoleucine+leucine (B), and histidine (C) following the consumption of meals that contain chicken or pork. |
We investigated the relationships between plasma AAs and other metabolic biomarkers, with the responses measured at 30 minutes for glucose, insulin, triglycerides, and zinc; and the minimum value of NEFA for each person, which usually occurred between 30–90 minutes postprandially. AA values were investigated at 30 minutes and also as an average value over 5 hours. The main predictive relationships are shown in Table 2. Plasma glucose concentrations were predicted significantly by Ala (P<0.001), Lys (P=0.006), and His (P=0.029), and the regression with these three variables had r2=0.74. When these relationships were examined using a general linear model with meal as a fixed factor, subject as a random factor, and the three plasma AAs as covariates, only plasma Ala was significant (P=0.001). None of the AAs was identified as a significant variable for insulin concentrations.
 | Table 2 Plasma AA predictors of plasma glucose, insulin, triglycerides, NEFA, and zinc concentrationsa |
For plasma triglyceride concentrations, significant predictors were Orn (P=0.002) and Tyr (P<0.001), with r2=0.49. When investigated using a general linear model, as described above, neither of these AAs was significant. NEFA were predicted by the average Val over 5 hours (r2=0.23, P=0.033). Arg was related to plasma zinc concentrations during the postprandial period (r2=0.26, P=0.021).
Discussion
In this controlled acute study in healthy subjects, we investigated the effects of consuming meals that contained either pork or chicken as the primary source of protein on plasma AAs, glucose, insulin, triglyceride, NEFA, and zinc concentrations. For plasma AAs, His was consistently and significantly higher following the consumption of PM, while Val and Leu + Iso were significantly higher following the consumption of CM. For the other measured variables, CM or PM consumption had no statistically significant effect. A number of plasma AAs emerged as predictors of the metabolic response, irrespective of the type of protein that was consumed.
The plasma AA response is believed to reflect differences in the rates of protein digestion, and differences between proteins were illustrated by milk proteins: the whey fraction is rapidly digested while casein has a relatively slower digestion rate due to curd formation in the stomach. Differences in the rates of digestion have prompted the concept of “fast” and “slow” proteins, which was proposed based on the dynamics of the plasma AA responses.18 In the present study, plasma AA concentrations increased to a peak at 30 minutes postprandially, with the majority of the analyzed AAs showing a similar profile of response following CM or PM. Similar responses have been observed following the consumption of beef and chicken;19 however, AAs from meals that contained fish,19 egg white, and cottage cheese20 took longer to reach peak values, possibly due to differences in the rates of gastric emptying or protein hydrolysis, suggesting a lower rate of digestion.21,22
One of the main differences in plasma AA that emerged between PM and CM was the significantly higher levels of His following the consumption of PM. His levels were consistently higher over the 5-hour postprandial period. Serum His levels are reported to be lower in obese women, and they are negatively associated with inflammation and oxidative stress.23 In a supplementation trial, His significantly decreased markers of insulin resistance, waist circumference, fat mass, serum NEFA, serum inflammatory cytokines, and oxidative stress.24 In the present study, plasma His was significantly associated with glucose concentrations in the regression analysis; however, this relationship was not evident in the general linear model. The lack of a strong association between His and glycemic control in the present study could be due to the fact that subjects had a BMI and glucose concentrations in the normal range.
In a postprandial study in humans, Charlton et al25 determined the effects of PM, beef, or CM meals on satiety and hormones that are associated with appetite. There were no significant differences in measures of satiety after consumption of the test meals at breakfast; however, a significantly higher concentration of peptide YY and a tendency for increased cholecystokinin were observed in those who consumed the PM as compared to the CM.25 Thus, it is possible that increasing the intake of pork elicits a combination of increased His concentrations and satiety hormones, leading to improved glycemic control, reduced BMI, and fat mass. The latter changes in cardiometabolic risk factors have been reported in studies that used pork as the main source of protein in weight-reducing diets.5,6
Significantly higher levels of the branched chain AAs were observed following the consumption of CM as compared to PM. The differences were observed at 180 minutes (Val, Leu + Iso) and 240 minutes (Leu + Iso) postprandially, yielding an overall average higher response following the consumption of CM. In cohort studies, plasma branched-chain AA concentrations were predictive of the future development of type 2 diabetes mellitus.26,27 Significant inverse correlations have been reported between Iso and Val concentrations and insulin sensitivity.28 Elevated plasma concentrations of branched-chain AAs are proposed as an early indicator of insulin resistance; however, the evidence that these AAs promote insulin resistance in humans is not clear.28
It has been shown previously that proteins and individual AAs could stimulate insulin secretion.1,2 None of the AAs that were analyzed in the present study were correlated with the insulin response, and only Ala remained a significant predictor of glucose concentrations when analyzed in a general linear model. Few studies have investigated Ala; in obese subjects, Ala consumption is associated with lower glucose and higher insulin concentrations at baseline.29 The lack of any relationship with glucose and insulin is consistent with previous observations1 that AAs do not significantly affect the glucose response in normal young people, although more subtle responses may be seen under conditions of a euglycemic clamp.30 In addition, the majority of studies that investigate the role of AA on glycemic control are carried out with meals that contain little or no carbohydrates, or that consist of AAs in isolation. Thus, the lack of a relationship between AA and insulin in the present study could be due to the young age of the participants and the absence of any underlying metabolic disease. It is also possible that the carbohydrate portion of the test meal prevented any specific effects of AAs on glucose and insulin responses to be observed.
The identity of factors that enhance zinc absorption remains unclear. Increasing intakes of dietary protein are associated with enhanced absorption,13 and it is believed that AAs that are released during digestion may play an important role in maintaining zinc solubility in the intestine, therefore aiding absorption.31 In rats, His enhances the absorption of zinc at a maximal rate at near physiological pH.32 In the present study, Arg was associated by linear regression to plasma zinc concentrations, and this association is consistent with the proposed role of AA. The lack of effect of Arg and other AA in the general linear model is likely to be influenced by the minimal changes that occurred in plasma zinc concentrations.
A number of limitations need to be acknowledged: the inclusion of a small number of male and female subjects with normal glycemic control may have limited our ability to observe the effect of PM and CM on metabolic responses, and any potential sex-related differences that may exist. The amount of protein in the meal was relatively small, and it is possible that further differences in the AA response between pork and chicken may have been observed if a higher amount of protein was consumed. In some instances, the plasma AA levels were close to the lower limits of detection and may have introduced an increased standard deviation in the reported mean values.
Conclusion
The present study demonstrates that a single meal that contains pork or chicken produces a differential profile of AA in the postprandial state. The results in young healthy subjects show that meals containing pork result in higher His and lower branched-chain AAs than meals that contain chicken. While the effects of branched-chain AAs in plasma are controversial, good evidence suggest that the sustained increase in His following the consumption of a PM is consistent with the reported favorable effects of lean pork on cardiometabolic risk factors.
Acknowledgments
Supported by a grant-in-aid from the Australian Government Cooperative Research Centre (CRC) for Pork and Australian Pork Ltd. The amino acid analysis was undertaken in the Sydney University Proteome Research Unit established under the Australian Government’s Major National Research Facilities Program and supported by the University of Sydney.
Author contributions
SS, BC, and DRS designed the research; MS, KJB, and NTL conducted the research; PP, SS, and BC analyzed the data; and SS, PP, BC, and DRS wrote the paper. SS had primary responsibility for the final content. All authors contributed toward data analysis, drafting and revising the paper and agree to be accountable for all aspects of the work.
Disclosure
The authors report no conflicts of interest in this work.
References
Gannon MC, Nuttall FQ. Amino acid ingestion and glucose metabolism – a review. IUBMB Life. 2010;62(9):660–668. | |
Newsholme P, Abdulkader F, Rebelato E, et al. Amino acids and diabetes: implications for endocrine, metabolic and immune function. Front Biosci (Landmark Ed). 2011;16:315–339. | |
Lucca A, Lucini V, Piatti E, Ronchi P, Smeraldi E. Plasma tryptophan levels and plasma tryptophan/neutral amino acids ratio in patients with mood disorder, patients with obsessive-compulsive disorder, and normal subjects. Psychiatry Res. 1992;44(2):85–91. | |
Stettler N, Murphy MM, Barraj LM, Smith KM, Ahima RS. Systematic review of clinical studies related to pork intake and metabolic syndrome or its components. Diabetes Metab Syndr Obes. 2013;6:347–357. | |
Murphy KJ, Thomson RL, Coates AM, Buckley JD, Howe PR. Effects of eating fresh lean pork on cardiometabolic health parameters. Nutrients. 2012;4(7):711–723. | |
Mikkelsen PB, Toubro S, Astrup A. Effect of fat-reduced diets on 24-h energy expenditure: comparisons between animal protein, vegetable protein, and carbohydrate. Am J Clin Nutr. 2000;72(5):1135–1141. | |
Samman S, Khosla P, Carroll KK. Effects of dietary casein and soy protein on metabolism of radiolabelled low density apolipoprotein B in rabbits. Lipids. 1989;24(3):169–172. | |
Kritchevsky D, Tepper SA, Czarnecki SK, Klurfeld DM. Atherogenicity of animal and vegetable protein. Influence of the lysine to arginine ratio. Atherosclerosis. 1982;41(2–3):429–431. | |
Kritchevsky D. Vegetable protein and atherosclerosis. J Am Oil Chem Soc. 1979;56(3):135–140. | |
Adams MR, McCredie R, Jessup W, Robinson J, Sullivan D, Celermajer DS. Oral L-arginine improves endothelium-dependent dilatation and reduces monocyte adhesion to endothelial cells in young men with coronary artery disease. Atherosclerosis. 1997;129(2):261–269. | |
Lekakis JP, Papathanassiou S, Papaioannou TG, et al. Oral L-arginine improves endothelial dysfunction in patients with essential hypertension. Int J Cardiol. 2002;86(2–3):317–323. | |
Samman S. Iron. Nutrition and Dietetics. 2007;64(Suppl S4):S126–S130. | |
Samman S. Zinc. Nutrition and Dietetics. 2007;64(Suppl S4):S131–S134. | |
McArthur JO, Petocz P, Caterson ID, Samman S. A randomized controlled trial in young women of the effects of consuming pork meat or iron supplements on nutritional status and feeling of well-being. J Am Coll Nutr. 2012;31(3):175–184. | |
Murphy MM, Spungen JH, Bi X, Barraj LM. Fresh and fresh lean pork are substantial sources of key nutrients when these products are consumed by adults in the United States. Nutr Res. 2011;31(10):776–783. | |
Foster M, Karra M, Picone T, et al. Dietary fiber intake increases the risk of zinc deficiency in healthy and diabetic women. Biol Trace Elem Res. 2012;149(2):135–142. | |
Wei R, Li G, Seymour AB. High-throughput and multiplexed LC/MS/MRM method for targeted metabolomics. Anal Chem. 2010;82(13):5527–5533. | |
Frühbeck G. Protein metabolism. Slow and fast dietary proteins. Nature. 1998;391(6670):843, 845. | |
Uhe AM, Collier GR, O’Dea K. A comparison of the effects of beef, chicken and fish protein on satiety and amino acid profiles in lean male subjects. J Nutr. 1992;122(3):467–472. | |
Nuttall FQ, Gannon MC. Metabolic response to egg white and cottage cheese protein in normal subjects. Metabolism. 1990;39(7):749–755. | |
Calbet JA, MacLean DA. Plasma glucagon and insulin responses depend on the rate of appearance of amino acids after ingestion of different protein solutions in humans. J Nutr. 2002;132(8):2174–2182. | |
Savoie L, Agudelo RA, Gauthier SF, Marin J, Pouliot Y. In vitro determination of the release kinetics of peptides and free amino acids during the digestion of food proteins. J AOAC Int. 2005;88(3):935–948. | |
Niu YC, Feng RN, Hou Y, et al. Histidine and arginine are associated with inflammation and oxidative stress in obese women. Br J Nutr. 2012;108(1):57–61. | |
Feng RN, Niu YC, Sun XW, et al. Histidine supplementation improves insulin resistance through suppressed inflammation in obese women with the metabolic syndrome: a randomised controlled trial. Diabetologia. 2013;56(5):985–994. | |
Charlton KE, Tapsell LC, Batterham MJ, et al. Pork, beef and chicken have similar effects on acute satiety and hormonal markers of appetite. Appetite. 2011;56(1):1–8. | |
Wang TJ, Larson MG, Vasan RS, et al. Metabolite profiles and the risk of developing diabetes. Nat Med. 2011;17(4):448–453. | |
Würtz P, Tiainen M, Mäkinen VP, et al. Circulating metabolite predictors of glycemia in middle-aged men and women. Diabetes Care. 2012;35(8):1749–1756. | |
Adams SH. Emerging perspectives on essential amino acid metabolism in obesity and the insulin-resistant state. Adv Nutr. 2011;2(6):445–456. | |
Genuth SM. Effects of oral alanine administration in fasting obese subjects. Metabolism. 1973;22(7):927–937. | |
Tremblay F, Lavigne C, Jacques H, Marette A. Role of dietary proteins and amino acids in the pathogenesis of insulin resistance. Annu Rev Nutr. 2007;27:293–310. | |
Sandström B. Bioavailability of zinc. Eur J Clin Nutr. 1997;51 Suppl 1:S17–S19. | |
Wapnir RA, Khani DE, Bayne MA, Lifshitz F. Absorption of zinc by the rat ileum: effects of histidine and other low-molecular-weight ligands. J Nutr. 1983;113(7):1346–1354. |
 © 2014 The Author(s). This work is published and licensed by Dove Medical Press Limited. The full terms of this license are available at https://www.dovepress.com/terms.php and incorporate the Creative Commons Attribution - Non Commercial (unported, v3.0) License.
By accessing the work you hereby accept the Terms. Non-commercial uses of the work are permitted without any further permission from Dove Medical Press Limited, provided the work is properly attributed. For permission for commercial use of this work, please see paragraphs 4.2 and 5 of our Terms.
© 2014 The Author(s). This work is published and licensed by Dove Medical Press Limited. The full terms of this license are available at https://www.dovepress.com/terms.php and incorporate the Creative Commons Attribution - Non Commercial (unported, v3.0) License.
By accessing the work you hereby accept the Terms. Non-commercial uses of the work are permitted without any further permission from Dove Medical Press Limited, provided the work is properly attributed. For permission for commercial use of this work, please see paragraphs 4.2 and 5 of our Terms.