")
Back to Journals » Neuropsychiatric Disease and Treatment » Volume 11
Medium-to-high prevalence of screening-detected parkinsonism in the urban area of Tehran, Iran: data from a community-based door-to-door study
Authors Fereshtehnejad S , Shafieesabet M, Rahmani A, Delbari A, Lökk J
Received 12 November 2014
Accepted for publication 29 December 2014
Published 5 February 2015 Volume 2015:11 Pages 321—332
DOI https://doi.org/10.2147/NDT.S77391
Checked for plagiarism Yes
Review by Single anonymous peer review
Peer reviewer comments 4
Editor who approved publication: Dr Roger Pinder
Seyed-Mohammad Fereshtehnejad,1,2 Mahdiyeh Shafieesabet,3 Arash Rahmani,4 Ahmad Delbari,1,5 Johan Lökk1,6
1Division of Clinical Geriatrics, Department of Neurobiology, Care Sciences, and Society (NVS), Karolinska Institutet, Stockholm, Sweden; 2Firoozgar Clinical Research Development Center (FCRDC), Firoozgar Hospital, 3Medical Student Research Committee (MSRC), Faculty of Medicine, 4Mental Health Research Center, Tehran Institute of Psychiatry, School of Behavioral Sciences and Mental Health, Iran University of Medical Sciences, Tehran, Iran; 5Iranian Research Center on Aging, University of Social Welfare and Rehabilitation, Tehran, Iran; 6Department of Geriatric Medicine, Karolinska University Hospital, Stockholm, Sweden
Introduction: Parkinsonism occurs in all ethnic groups worldwide; however, there are wide variations in the prevalence rates reported from different countries, even for neighboring regions. The huge socioeconomic burden of parkinsonism necessitates the need for prevalence studies in each country. So far, there is neither data registry nor prevalence information on parkinsonism in the Iranian population. The aim of our study was to estimate the prevalence rate of probable parkinsonism in a huge urban area in Iran, Tehran using a community-based door-to-door survey.
Materials and methods: We used a random multistage sampling of the households within the network of health centers consisting of 374 subunits in all 22 districts throughout the entire urban area of Tehran. Overall, 20,621 individuals answered the baseline checklist and screening questionnaire and data from 19,500 persons aged ≥30 years were entered in the final analysis. Health care professionals used a new six-item screening questionnaire for parkinsonism, which has been previously shown to have a high validity and diagnostic value in the same population.
Results: A total of 157 cases were screened for parkinsonism using the validated six-item questionnaire. After age and sex adjustment based on the Tehran population, the prevalence of parkinsonism was calculated as 222.9 per 100,000. Using the World Health Organization’s World Standard Population, the standardized prevalence rate of parkinsonism was 285 per 100,000 (95% confidence interval 240–329). The male:female ratio of probable parkinsonism was calculated as 1.62, and there was a significant increase in the screening rate by advancing age.
Conclusion: The calculated rates for the prevalence of parkinsonism in our study are closer to reports from some European and Middle Eastern countries, higher than reports from Eastern Asian and African populations, and lower than Australia. The prevalence rate of >200 in 100,000 for parkinsonism in Tehran, Iran could be considered a medium-to-high rate.
Keywords: parkinsonism, Parkinson’s disease, prevalence, door-to-door survey, population-based
Introduction
Parkinsonism is the second-most common neurodegenerative disorder, with extremely high psychosocial impacts and noticeable declines in patients’ quality of life. Idiopathic Parkinson’s disease (IPD), also named PD, is the most prevalent type of parkinsonism; however, about 30%–40% of patients suffer from other types, generally called atypical parkinsonism.1,2 Although these conditions overlap in symptoms, different underlying pathologies are involved.
PD incidence and prevalence increase with age,3 which makes it an impending public health issue in rapidly aging societies, especially less developed countries that might not be well equipped to encounter the high burden of geriatric neurodegenerative disorders. Although a number of studies have been performed on the prevalence of parkinsonism, current data are mainly limited to developed countries or rather smaller communities where data registries are practically available in their health care systems.4–8 Previous studies have demonstrated considerable variety in their estimations, probably in part due to methodological issues, in addition to environmental and ethnodemographic determinants, such as the age and ethnic groups of the study population.9 For instance, the crude prevalence of PD has been estimated to be as low as 15 per 100,000 individuals in the People’s Republic of China (PRC)10 to as high as 800 per 100,000 persons in Albania.11 This large variation highlights the fact that epidemiologic features of parkinsonism cannot be generalized to all ethnic groups and societies. Furthermore, the method of data collection is another crucial determinant that might lead to either under- or overestimation of PD prevalence. While electronic central registries are available in many developed countries, door-to-door surveys are the most common method of data collection in neuroepidemiologic studies in poor-resource developing countries. Nevertheless, door-to-door studies have been shown to have the advantage of fewer underdiagnosed cases.12
With 78.4 million inhabitants, Iran is the world’s 17th-most populous country, and is experiencing a rapidly aging demographic shift.13 The growing trend of aging in Iran has been shown in national censuses where the proportion of those ≥60 years of age increased 1% from 2006 to 2011,14,15 and will reach 10.5% in 2025 and as high as 21.7% in 2050.15,16 However, there is a dearth of information about epidemiological features of PD not only in the Iranian population, but also in the greater Eastern Mediterranean World Health Organization (WHO) region, where different populations with specific environmental and ethnogenetic properties live. Data from Arabic countries in the Middle East are also absent, except for recent surveys in Jordan17 and Egypt18 showing prevalence rates of 58.8 and 452.1 per 100,000, respectively, which demonstrates a wide range of variation.
Currently, there is a lack of evidence on the epidemiologic features of parkinsonism in the Iranian population, and even the number of movement-disorder specialists is unclear in Iran,19 which raises potential obstacles and concerns for future health policy making in a country with a rapidly aging population at risk of neurodegenerative diseases, such as PD. Therefore, the aim of this study was to estimate the prevalence rate of probable parkinsonism in a huge urban area of Tehran, Iran. Having no access to any registered data on PD, we designed a door-to-door community-based method for data collection using a previously validated screening instrument with high diagnostic values.20
Materials and methods
Study setting
This community-based door-to-door study was performed in Tehran, Iran. Tehran, the capital city of Iran and the largest metropolitan area in West Asia, has a population of >8,300,000 inhabitants, and surpasses 14,000,000 in the wider metropolitan area13 with 22 urban districts, according to the latest estimations. The present work is part of a comprehensive project designed to study the epidemiology of major neurological disorders, namely stroke, PD, epilepsy, peripheral neuropathy, restless leg syndrome, and headache, in the adult population of Tehran. The prevalence-date points were during October 2011 and January 2012.
Ethical considerations
The study protocol was approved by the ethics committee of the Firoozgar Clinical Research Development Center (FCRDC) (affiliated with Iran University of Medical Sciences) in Tehran, Iran (MT.140, approved in June 2011). Each participant was informed about the aims and objectives of the study before participation, and they were free to withdraw from the survey whenever they wanted. Furthermore, the identity of research participants was protected, since the data files were anonymous.
Sample-size calculation and sampling method
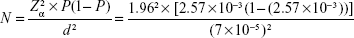
With regard to a prevalence rate of 257 per 100,000 individuals, which was estimated in a door-to-door survey in Caucasians21 and an effect size of seven per 100,000 with the assumption of 0.05 for type I (α) error in the estimation, the total required sample size was calculated as 16,000 individuals using the following formula (where P represents the estimated prevalence rate and d shows the effect size of the estimation):
|
|
As Tehran comprises 22 hierarchical districts with regard to socioeconomic status, it is of utmost importance to cover all regions in any epidemiologic study targeting the city’s population. As a result, we used a probability multistage-sampling method covering all urban districts of Tehran. For this purpose, each of the 22 districts was considered one sampling stratum, each of which consists of several blocks and households as the clusters. Throughout the Tehran urban area, there is a network of health centers, with a total of 374 subunits covering all districts, which are organized by the health deputy of Tehran municipality. Each of the health centers is responsible for a determined number of residing blocks and households that are coded by unique numbers. With regard to the stratified proportional sample size for each district and their subunits where one single health center is located, random cluster sampling was used to recruit the needed number of households to fulfill the calculated sample size for each subunit.
Screening tool
The study checklist consisted of three main sections: baseline information (ie, age, sex, and educational, marital, and working status), comorbidity profile, and screening questions. In this study, we used our previously validated screening questionnaire for parkinsonism.20 As a brief description, after all screening questions on different symptoms of parkinsonism from several previously used instruments in neuroepidemiologic surveys were merged, a new combination of six items was constructed. These items included “stiffness and rigidity in legs”, “tremor and shaking”, “slower daily activity”, “troublesome buttoning”, “troublesome arm swing”, and “feet stuck to floor”. This novel six-item tool has been shown to have 97% accuracy, 90% sensitivity, and 96% specificity to screen parkinsonism in a similar Iranian population but with different participants.20 Individuals with parkinsonism were screened if they answered positively to all of these six questions. In addition, we also included unique items on symptoms of parkinsonism from other screening tools, namely the Sicilian Neuro-Epidemiology Study (SNES; five screening questions),22 the revised 2009 version of the WHO screening instrument to measure the prevalence of neurological disability in resource-poor settings (seven screening questions),23 and the questionnaire developed by Tanner et al (nine screening questions).24,25 The aforementioned four questionnaires consist of some other items on physical examination; however, in accordance with the scope of our study, we included only those primary screening items that could be asked of people. Therefore, we were able to estimate and compare the prevalence rate of suspicious parkinsonism based on different screening tools. The full list of combined screening questionnaires that we used in our study has been previously published,20 which can be retrieved in case of interest or need.
Data collection
Data collection was done through face-to-face interviews with the participants. Surveyors were among the health care workers who were employed in the health centers of each district of Tehran, and were trained to conduct the study through a 1-day workshop that was held in September 2011. Each of the surveyors was responsible for a number of households throughout their district and subunit region. All members of each presented household were asked to participate in the survey if they were aged ≥30 years. After the introduction of the survey and study aims, the checklist consisting of screening items for parkinsonism was filled by the surveyors for each eligible family member. In overall 20,621 individuals answered the baseline checklist and screening questionnaire; however, with regard to missing values and data cleaning, information from a total number of 19,500 persons was entered in the final analysis, resulting in a 94.6% rate for valid participation.
Statistical analysis
Data were analyzed using SPSS version 20 (IBM, Armonk, NY, USA) and Microsoft Excel 2010 software. To describe quantitative and nominal/categorical variables, mean (standard deviation [SD]) and frequency percentages are reported, respectively. In order to calculate the 95% confidence intervals (CIs) for the prevalence rates, the standard error (SE) of estimation was calculated using following formula (where P is the point prevalence rate and N is the total sample size):
|
|

Using the latest accessible data for the age and sex distribution of the Tehran population (Table S1) based on the national census in 2008, prevalence rates were adjusted. In the next step, we used the WHO World Standard Population to readjust the prevalence rates to be able to compare the prevalence rates of our study with other reports from different countries. The WHO World Standard Population is a unique standard age- and sex-specific distribution for a hypothetical population that is recommended by different studies to use the same reference-population pyramid to adjust their findings for. This method enables us to easily compare prevalence features between studies with various population pyramids with dissimilar age and sex distributions. In order to analyze the increasing pattern of the prevalence rate of parkinsonism by aging, three regression models were performed, consisting of linear, quadratic, and cubic equations, to find the best-fitted model based on the R2 value. The null hypothesis behind these regression models is that by one increase in the age-group of the study population, the prevalence rate of parkinsonism increases by either one, two, or three times.
Results
Baseline characteristics
In total, 12,907 (66.2%) women and 6,593 (33.8%) men participated in this survey. The mean age of the entire study population was 56.5 (SD 10.2) years, ranging between 30 and 95 years. Figure 1 shows the population pyramid of the participants regarding their age-group and sex. Less than a fifth (17.2%, n=3,266) of the study population were illiterate, and the majority of them (81.8%, n=15,147) were married. Based on the self-reported checklist, hypertension (29.9%, n=5,838), osteoarthritis (18.0%, n=3,519), and diabetes (18.0%, n=3,516) were the most common comorbidities. A complete list of sociodemographic and baseline characteristics of the participants is shown in Table 1.
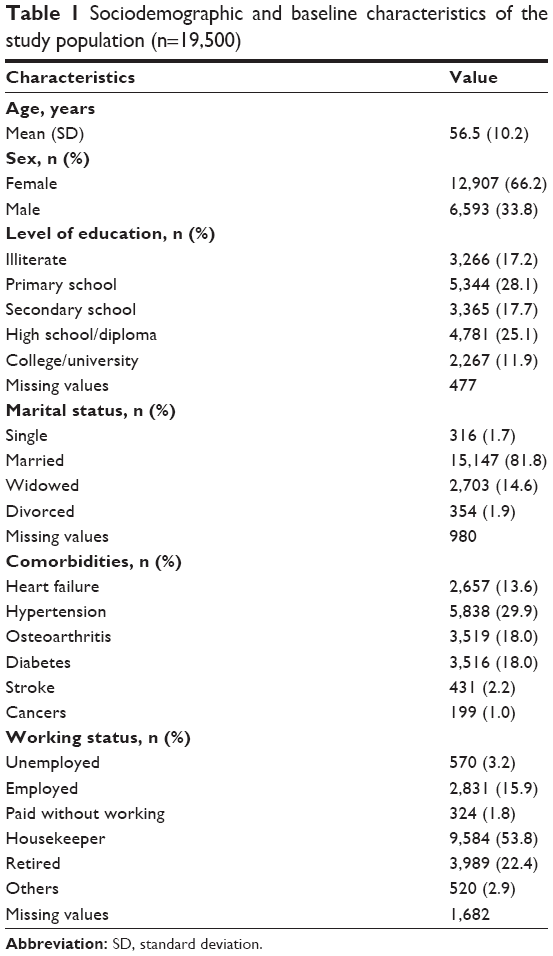 | Table 1 Sociodemographic and baseline characteristics of the study population (n=19,500) |
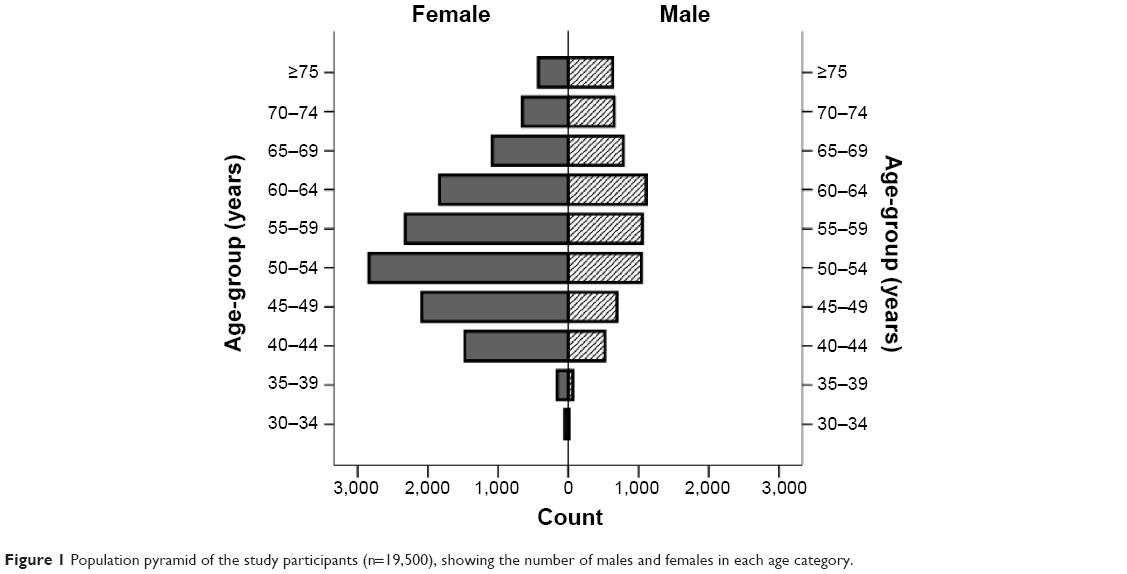 | Figure 1 Population pyramid of the study participants (n=19,500), showing the number of males and females in each age category. |
Crude prevalence rates
On the self-reported questionnaire, 142 individuals mentioned a history of parkinsonism, which resulted in a crude prevalence rate of 728.2 per 100,000 (95% CI 620–860). Using the new six-item screening instrument validated in our previous study, 157 participants were screened as cases suspicious for parkinsonism (crude rate 805.1 per 100,000, 95% CI 690–940). The mean age of the positively screened cases was 64.5 (SD 10.9) years, ranging between 39 and 89 years, and only 21 (13.4%) individuals were younger than 50 years. With regard to symptoms related to parkinsonism, cardinal features, namely tremor, bradykinesia, and rigidity, were seen in all of the screened cases. Stooped posture (91.5%), impaired balance (89.5%), gait disorders (87%), inexpressive face (75.3%), smelling problems (65.1%), and softer voice (64.4%) were also commonly observed among the positively screened individuals. Table 2 summarizes the crude numbers and prevalence rate of screened cases in each age-group and in the total study population using different screening instruments. The highest crude prevalence rate was estimated by the SNES items, where 174 cases were screened (crude rate 892.3 per 100,000, 95% CI 770–1,030). The crude prevalence rate of suspicious parkinsonism using the new six-item screening instrument in different age-groups is illustrated separately for males, females, and the total study population in Table 2. As shown, the crude prevalence rate was <1% in younger groups aged <65 years. While the crude prevalence rate of screened parkinsonism decreased from 4.6% in the age-group 80–84 years to 1.7% among those who aged ≥85 years, there was a steady increase in the prevalence rate of parkinsonism in females up to 5.9% in the age-group ≥85 years.
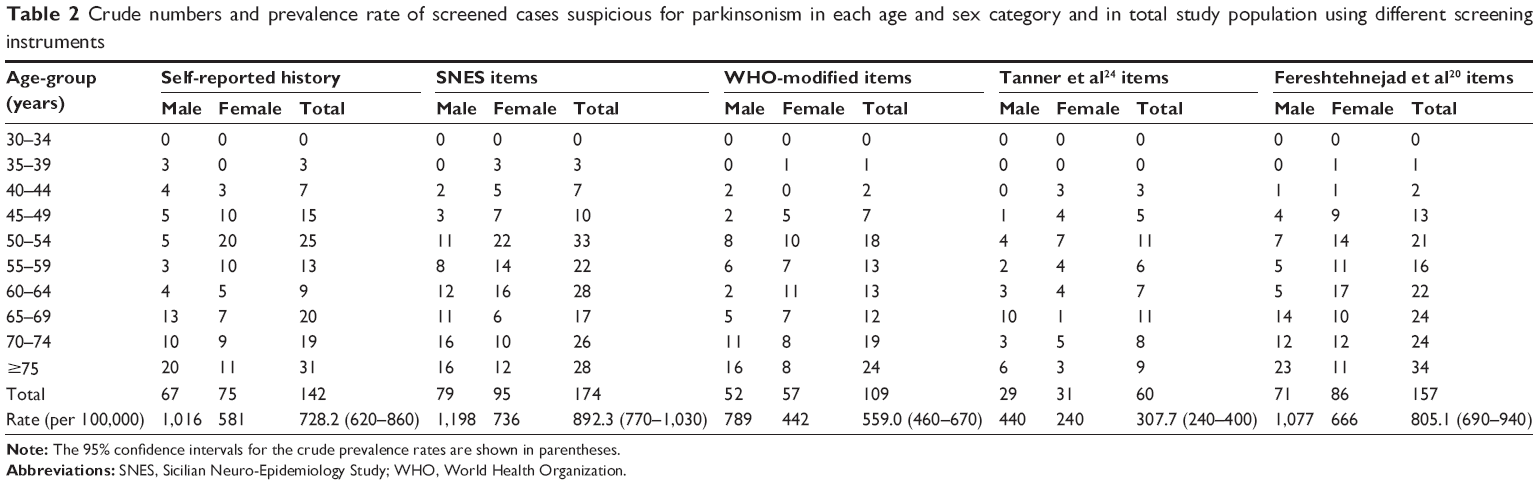 | Table 2 Crude numbers and prevalence rate of screened cases suspicious for parkinsonism in each age and sex category and in total study population using different screening instruments |
Age- and sex-adjusted prevalence rates
With regard to the skewed age distribution and uneven sex ratio of the study population, the first adjustment was performed using the population features of the Tehran urban area obtained from the national census in 2008 (Table 3). After age and sex adjustment, the prevalence of screened parkinsonian cases was estimated as 222.9 per 100,000 (95% CI 160–300) based on the new six-item screening instrument. As shown in Table 3, the highest and lowest prevalence rates were estimated by the SNES (adjusted rate 234.4 per 100,000, 95% CI 180–310) and Tanner et al’s (adjusted rate 82.7 per 100,000, 95% CI 50–130) instruments, respectively. Figure 2 illustrates the sex-specific age-adjusted prevalence rate of suspicious parkinsonism using the new validated instrument in different age categories of the study population based on the Tehran census population. After age adjustment, a steady increase was seen in the prevalence rate of parkinsonism by increasing age, which was accelerated after 65 years of age. As illustrated in Figure 3, a cubic regression (adjusted R2=0.962, P-value for trend 0.026) showed the best-fitted model for trend analysis of the increasing prevalence rate of parkinsonism by advancing age compared to linear (adjusted R2=0.764, P-value for trend 0.001) and quadratic (adjusted R2=0.920, P-value for trend 0.005) models. This shows that with each 5-year increase in age, the prevalence of parkinsonism is more likely to increase to the power of three. The male:female ratio for the overall prevalence of parkinsonism was calculated as 1.62 based on the results from the new validated instrument. Table 3 also shows prevalence rates of screened parkinsonism using different screening instruments in each age category and in total adjusted for age and sex based on the WHO World Standard Population. The overall adjusted prevalence rate based on the new six-item instrument increased to 284.9 per 100,000 (95% CI 240–330) adjusting for the WHO World Standard Population. Moreover, the SNES estimation of parkinsonism also increased to 296.0 per 100,000 (95% CI 250–342) after the second adjustment.
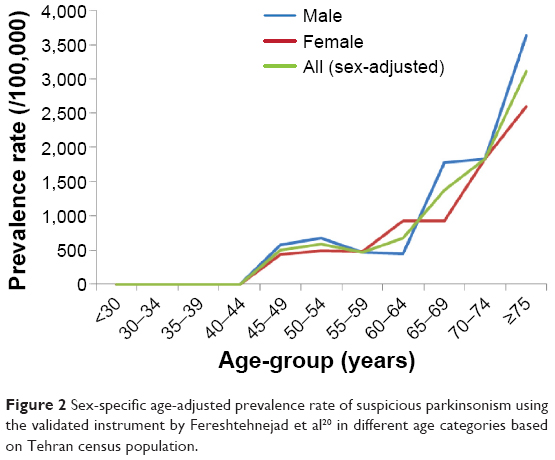 | Figure 2 Sex-specific age-adjusted prevalence rate of suspicious parkinsonism using the validated instrument by Fereshtehnejad et al20 in different age categories based on Tehran census population. |
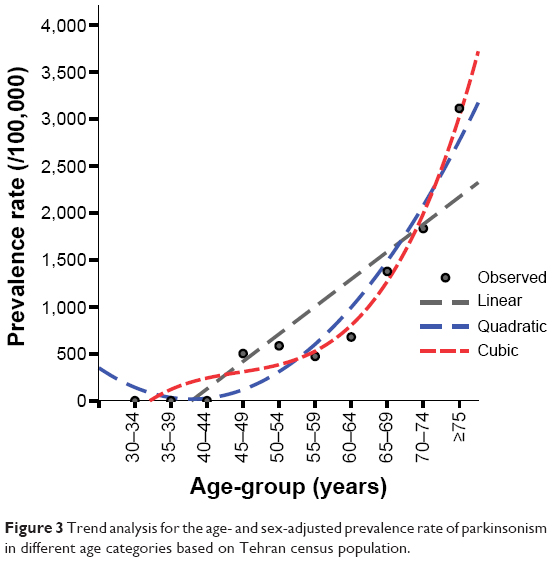 | Figure 3 Trend analysis for the age- and sex-adjusted prevalence rate of parkinsonism in different age categories based on Tehran census population. |
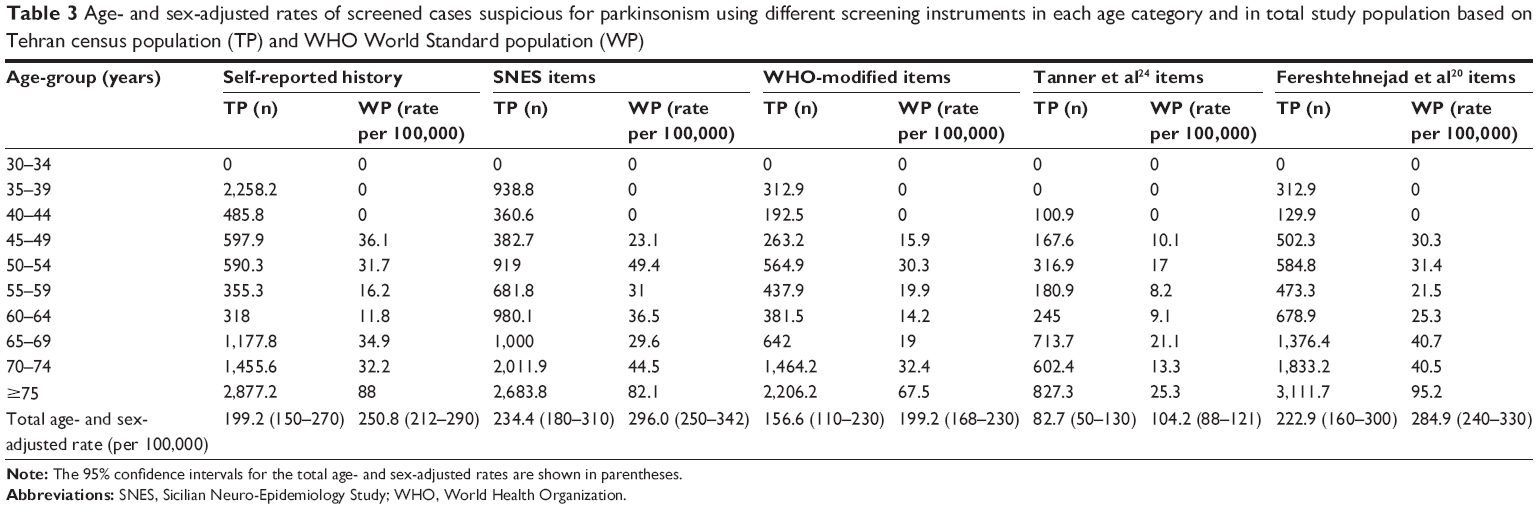 | Table 3 Age- and sex-adjusted rates of screened cases suspicious for parkinsonism using different screening instruments in each age category and in total study population based on Tehran census population (TP) and WHO World Standard population (WP) |
Discussion
Main findings
Our investigation is the first community-based door-to-door prevalence study of parkinsonism in Iran, in which 19,500 individuals were screened using a validated novel instrument. Although our study lacked Phase II confirmatory investigation by neurologists, it benefited from a validated novel screening questionnaire that has been previously shown to have high diagnostic value for screening of parkinsonism in the same community.20 Based on our validated instrument20 and after adjustment for the age and sex distribution of the Tehran population, the prevalence rate of parkinsonism was found to be 223 per 100,000, which increased to 285 per 100,000 following adjustment for the WHO World Standard Population, both of which could be considered high rates.
Prevalence of parkinsonism
A literature review on the prevalence rate of parkinsonism and PD confirms that the results vary widely in different ethnic groups and countries. Morgante et al reported a prevalence of 323.4 per 100,000 for all types of parkinsonism among people aged 40 years and over in the Aeolian Archipelago in Sicily, Italy.26 Also, Hobson et al in their record-based study, which was conducted in a rural area in north Wales, UK, found a prevalence of 122 per 100,000 for parkinsonism.27 Other reports on the prevalence of parkinsonism show quite a wide range: from 339.6 per 100,000 in Colombia28 to as high as 659 per 100,000 in Egypt29 and 800 per 100,000 in Albania.11 In another study on 15,482 Egyptians aged >40 years, the prevalence of parkinsonism was found to be 316.5 per 100,000 people.30 Other neuroepidemiologic studies on parkinsonism have mainly focused on the prevalence and/or incidence of PD, which is the most common cause of parkinsonism.
Prevalence of Parkinson’s disease
Previous surveys have demonstrated that around 58%–70% of screened cases with parkinsonism actually suffer from IPD.1,2,30–33 Accordingly, it could be expected that PD prevalence in the Tehran population varies between 129–156 per 100,000 (standardized by the Tehran population) or 165–199 per 100,000 (standardized by the WHO World Standard Population). This rate lies in the wide range of PD prevalence that has been estimated from Caucasian populations, varying from 65 to 257 per 100,000.9 In a systematic review on the prevalence of PD in Asia conducted by Muangpaisan et al studies published from 1965 to 2008 were reviewed, and an age-standardized prevalence of 51.3–176.9 per 100,000 in population-based door-to-door surveys was reported.34 However, PD prevalence estimated from record-based studies ranged from 35.8 to 68.3 per 100,000 in the same geographic regions.34
Although it has been generally thought that PD is less common in Afro-Americans, Japanese, and some other Asians,9 the diversity in estimations can be also attributed to methodological differences in addition to genetic and environmental factors. Population-based studies, such as door-to-door surveys like the current investigation, tend to overestimate PD prevalence, whereas record-based reports are based on only diagnosed cases and would definitely underestimate the real prevalence rates. Figure 4 summarizes the results from several prevalence studies reporting a global standardized (either WHO, US, or Europe standard reference populations) prevalence rate of PD in different countries located in the six WHO regions. Having standardized for a common hypothetical population, one can compare these prevalence features, even though they come from countries with huge differences in their population pyramids. Among these globally standardized rates, the highest and lowest prevalence has been shown in Australia (439.4 per 100,000)35 and the PRC (16.7 per 100,000),10 respectively. Our WHO population-standardized estimation for Iran lies in the middle-to-high range. Figure 5 shows findings from reported local standardized prevalence rates using their own national population demography for adjustments; therefore, these findings are affected by the age and sex distribution of the adult population in each country. However, PD prevalence has been reported to range between ten per 100,000 in all age-groups in Nigeria36 and 713 per 100,000 in inhabitants older than 65 years in Germany.37 In general, population-based studies have resulted in rather higher PD prevalence rates compared to record-based registries in most regions (Figures 4 and 5). Moreover, among population-based studies prevalence of PD is commonly higher in European and Eastern Mediterranean regions compared to the African region. When focus is directed more on the Eastern Mediterranean, where Iran is located, a higher PD prevalence is seen in Egypt30 and Tunisia,38 Iran is in the middle range, and Saudi Arabia39 has the lowest estimation (Figure 5). Nonetheless, not only the differences in ethnicity but also various environmental factors may play a role in such varied prevalence features for PD. In the PRC, a tenfold difference has been shown in the prevalence of PD estimated from a nationwide survey covering different parts of the country.10
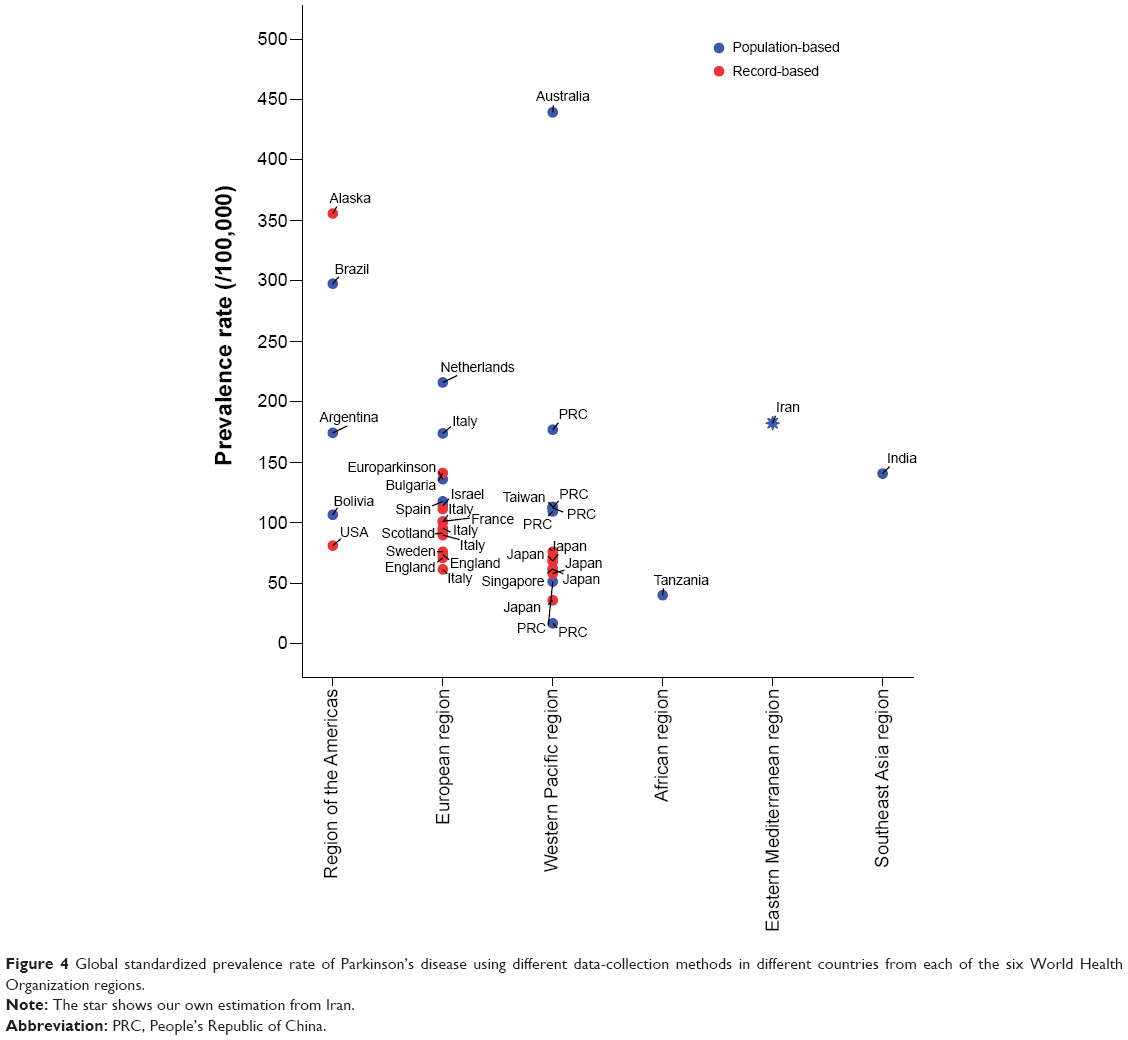 | Figure 4 Global standardized prevalence rate of Parkinson’s disease using different data-collection methods in different countries from each of the six World Health Organization regions. |
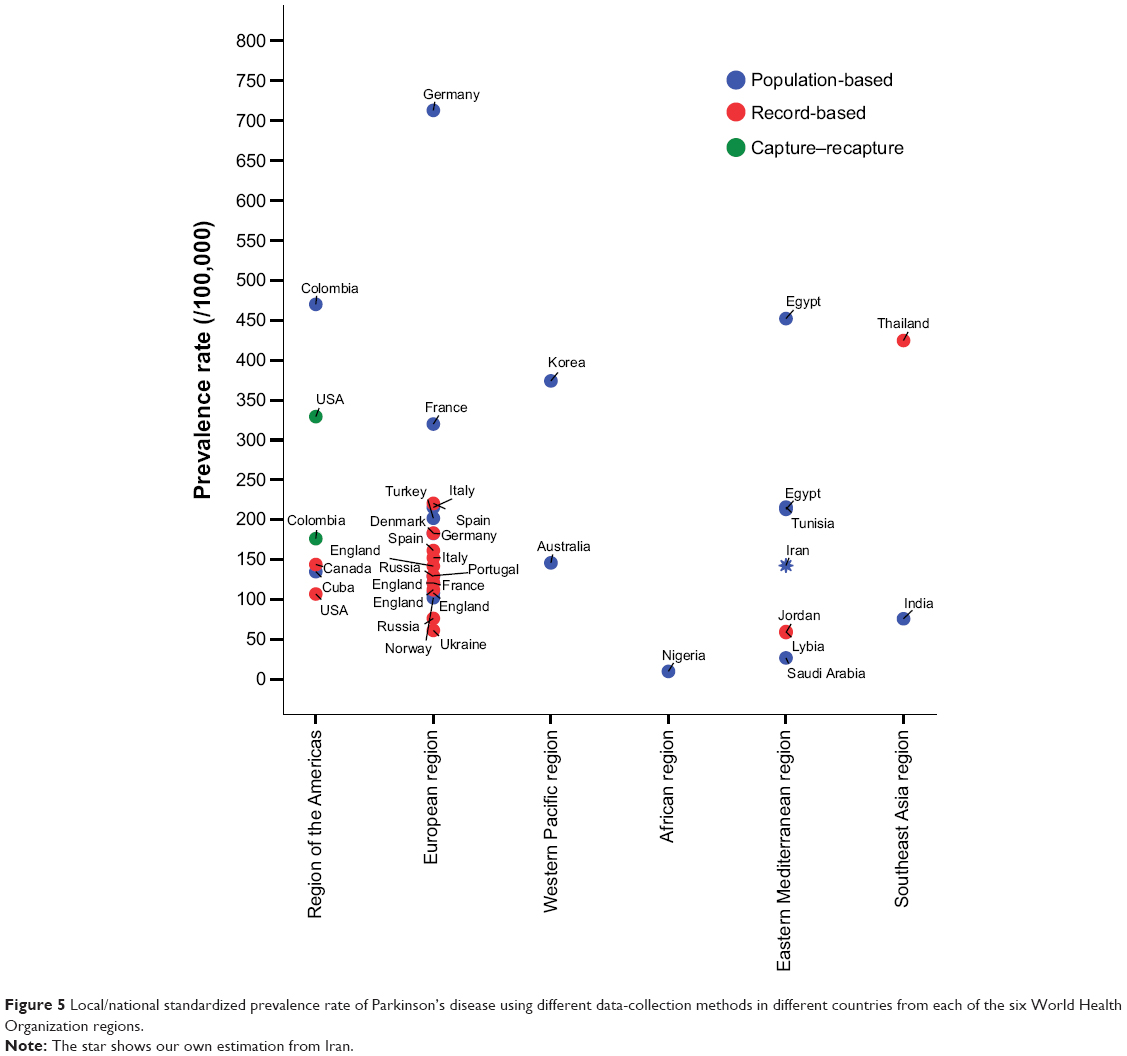 | Figure 5 Local/national standardized prevalence rate of Parkinson’s disease using different data-collection methods in different countries from each of the six World Health Organization regions. |
Sex- and age-related prevalence features
Our findings showed a steady increase in the prevalence rate of parkinsonism by advancing age, with a male preponderance in all age-groups, which is in line with previous reports.40,41 Similarly, we also showed that a sudden rise in the incidence of parkinsonism happens after the age of 65 years, where the number of positively screened cases increased dramatically in a cubic function. Although Iran is known to be a country with rather a high consanguinity rate (37.4%),42 which might have led to a higher relative prevalence of early onset parkinsonism, our findings showed that the mean age of positively screened cases and the proportion of those younger than 50 years were both similar to other populations. A higher prevalence of both PD and other parkinsonism in males has been repeatedly shown.40 Quite similar to our study, which showed a male:female ratio of 1.62 for the overall prevalence of parkinsonism, in a Norwegian survey on the incidence of PD, the overall age-standardized male:female ratio was 1.58.43 Although some studies have attributed the lower incidence and delayed onset of parkinsonism in females to hormonal factors, such as estrogens,43,44 a satisfactory explanation is still needed.
Limitations and strengths
We acknowledge our study’s limitations, including the lack of Phase II confirmatory assessment by well-trained neurologists to exclude any secondary reason for the symptoms, which occurred due to the limited resources we had. However, the positively screened cases in our study could be considered as suspicious parkinsonism but not confirmed. The use of a novel six-item screening tool that has been shown to be a highly valid questionnaire with high diagnostic value in the same population20 is one strength to compensate this issue. Nonetheless, all other used screening instruments were confirmed in several studies, whereas our newly developed screening tool was validated in one study20 and not yet confirmed by other different surveys. Therefore, the confirmatory phase could not only support more valid findings on the prevalence of parkinsonism but also confirm the six-item screening instrument in a large cohort, which could be considered for future research in this area.
Having used an acceptable sampling method in a huge urban area, our study is also the first attempt to investigate the prevalence of suspicious parkinsonism in the Iranian population. However, since we did not recruit from rural areas, our findings should be generalized mainly for urban inhabitants and not the whole Iranian population. Furthermore, the door-to-door sampling was performed mainly during the daytime, when most of the housewives are at home and most of the men are away. This might have induced the unequal sex distribution in our study population. The selected cutoff for age as 30 years was also based on previous studies41 and the rationale for the onset age of parkinsonism. Although adjusted for real Tehran and WHO-standardized populations, these two issues created age and sex skewness in our recruited study population, which must be considered when extrapolating the findings. Finally, it should be noted that the Tehran population could be a mixture of different ethnic groups, such as Persian, Azeri, and Kurdish, and even immigrant subpopulations, mainly Afghans and Iraqis. Therefore, our findings more appropriately refer to the Iranian population as a geographic entity rather than the Persian ethnic group, although they might be the major ethnic group in the Tehran urban area.
Conclusion
The calculated rates for the prevalence of parkinsonism in our study are closer to the reports from some European and Eastern Mediterranean regions, higher than the estimations from East Asian and African populations, and lower than Australia. The prevalence rate of >200 per 100,000 for parkinsonism in Tehran, Iran could be considered medium to high, and was estimated for an urban population from a metropolitan area, reflecting the possible high risk of exposure to pollutants and other risk factors of urbanization.
Acknowledgments
The authors are grateful to colleagues who contributed to data collection from the network of health centers in Tehran, namely the health care professionals and surveyors. We would like to thank Dr Mohammad Mahdi Golmakani, the deputy of health in Tehran municipality, for his great support with this project.
Disclosure
The authors report no conflicts of interest in this work.
References
Bergareche A, De La Puente E, López de Munain A, et al. Prevalence of Parkinson’s disease and other types of parkinsonism. A door-to-door survey in Bidasoa, Spain. J Neurol. 2004;251(3):340–345. | ||
Benito-León J, Bermejo-Pareja F, Rodríguez J, Molina JA, Gabriel R, Morales JM. Prevalence of PD and other types of parkinsonism in three elderly populations of central Spain. Mov Disord. 2003;18(3): 267–274. | ||
Wirdefeldt K, Adami HO, Cole P, Trichopoulos D, Mandel J. Epidemiology and etiology of Parkinson’s disease: a review of the evidence. Eur J Epidemiol. 2011;26 Suppl 1:S1–S58. | ||
Gordon PH, Zhao H, Bartley D, et al. Prevalence of Parkinson disease among the Navajo: a preliminary examination. J Parkinsons Dis. 2013; 3(2):193–198. | ||
Gordon PH, Mehal JM, Holman RC, Rowland AS, Cheek JE. Parkinson’s disease among American Indians and Alaska natives: a nationwide prevalence study. Mov Disord. 2012;27(11):1456–1459. | ||
Bauso DJ, Tartari JP, Stefani CV, Rojas JI, Giunta DH, Cristiano E. Incidence and prevalence of Parkinson’s disease in Buenos Aires City, Argentina. Eur J Neurol. 2012;19(8):1108–1113. | ||
Allyson Jones C, Wayne Martin WR, Wieler M, King-Jesso P, Voaklander DC. Incidence and mortality of Parkinson’s disease in older Canadians. Parkinsonism Relat Disord. 2012;18(4):327–331. | ||
Walker RW, Hand A, Jones C, Wood BH, Gray WK. The prevalence of Parkinson’s disease in a rural area of North–East England. Parkinsonism Relat Disord. 2010;16(9):572–575. | ||
von Campenhausen S, Bornschein B, Wick R, et al. Prevalence and incidence of Parkinson’s disease in Europe. Eur Neuropsychopharmacol. 2005;15(4):473–490. | ||
Wang YS, Shi YM, Wu ZY, He YX, Zhang BZ. Parkinson’s disease in China. Coordinational Group of Neuroepidemiology, PLA. Chin Med J (Engl). 1991;104(11):960–964. | ||
Kruja J, Beghi E, Zerbi D, et al. High prevalence of major neurological disorders in two Albanian communities: results of a door-to-door survey. Neuroepidemiology. 2012;38(3):138–147. | ||
Errea JM, Ara JR, Aibar C, de Pedro-Cuesta J. Prevalence of Parkinson’s disease in lower Aragon, Spain. Mov Disord. 1999;14(4):596–604. | ||
Statistical Center of Iran. Statistics, census of population and housing of the year 2011. Available from: http://www.amar.org.ir/Default.aspx?tabid=133. Accessed October 26, 2014. | ||
Noroozian M. The elderly population in Iran: an ever growing concern in the health system. Iran J Psychiatry Behav Sci. 2012;6(2):1–6. | ||
Danial Z, Motamedi MH, Mirhashemi S, Kazemi A, Mirhashemi AH. Ageing in Iran. Lancet. 2014;384(9958):1927. | ||
United Nations. World Population Ageing: 1950–2050. Iran. http://www.un.org/esa/population/publications/worldageing19502050/pdf/113iran%28.pdf. Accessed December 23, 2014. | ||
Alrefai A, Habahbih M, Alkhawajah M, et al. Prevalence of Parkinson’s disease in Northern Jordan. Clin Neurol Neurosurg. 2009;111(10):812–815. | ||
Tallawy HN, Farghaly WM, Rageh TA, et al. Door-to-door survey of major neurological disorders (project) in Al Quseir City, Red Sea Governorate, Egypt. Neuropsychiatr Dis Treat. 2013;9:767–771. | ||
World Health Organization. Atlas: Country Resources for Neurological Disorders. Geneva: WHO; 2004. | ||
Fereshtehnejad SM, Shafieesabet M, Rahmani A, et al. A novel 6-item screening questionnaire for parkinsonism: validation and comparison between different instruments. Neuroepidemiology. 2014;43(3–4):178–193. | ||
Morgante L, Rocca WA, Di Rosa AE, et al. Prevalence of Parkinson’s disease and other types of parkinsonism: a door-to-door survey in three Sicilian municipalities. The Sicilian Neuro-Epidemiologic Study (SNES) Group. Neurology. 1992;42(10):1901–1907. | ||
Meneghini F, Rocca WA, Anderson DW, et al. Validating screening instruments for neuroepidemiologic surveys: experience in Sicily. Sicilian Neuro-Epidemiologic Study (SNES) Group. J Clin Epidemiol. 1992;45(4):319–331. | ||
Bower JH, Howlett W, Maro VP, Wangai H, Sirima N, Reyburn H. A screening instrument to measure the prevalence of neurological disability in resource-poor settings. Neuroepidemiology. 2009;32(4):313–320. | ||
Tanner CM, Gilley DW, Goetz CG. A brief screening questionnaire for parkinsonism. Ann Neurol. 1990;28:267–268. | ||
Wei Z, Xiaoyuan N, Shengwei G, Zhizong H, Jiyuan L, Yang L. Evaluation of a screening questionnaire for Parkinson’s disease in a Chinese population. J Clin Neurosci. 2014;21(2):278–281. | ||
Morgante L, Nicoletti A, Epifanio A, et al. Prevalence of Parkinson’s disease and other types of parkinsonism in the Aeolian Archipelago, Sicily. Parkinsonism Relat Disord. 2008;14(7):572–575. | ||
Hobson P, Gallacher J, Meara J. Cross-sectional survey of Parkinson’s disease and parkinsonism in a rural area of the United Kingdom. Mov Disord. 2005;20(8):995–998. | ||
Sánchez JL, Buriticá O, Pineda D, Uribe CS, Palacio LG. Prevalence of Parkinson’s disease and parkinsonism in a Colombian population using the capture-recapture method. Int J Neurosci. 2004;114(2):175–182. | ||
Khedr EM, Al Attar GS, Kandil MR, Kamel NF, Abo Elfetoh N, Ahmed MA. Epidemiological study and clinical profile of Parkinson’s disease in the Assiut Governorate, Egypt: a community-based study. Neuroepidemiology. 2012;38(3):154–163. | ||
El-Tallawy HN, Farghaly WM, Shehata GA, et al. Prevalence of Parkinson’s disease and other types of parkinsonism in Al Kharga district, Egypt. Neuropsychiatr Dis Treat. 2013;9:1821–1826. | ||
Zhang ZX, Anderson DW, Huang JB, et al. Prevalence of Parkinson’s disease and related disorders in the elderly population of Greater Beijing, China. Mov Disord. 2003;18(7):764–772. | ||
de Rijk MC, Tzourio C, Breteler MM, et al. Prevalence of parkinsonism and Parkinson’s disease in Europe: the EUROPARKINSON Collaborative Study. European Community Concerted Action on the Epidemiology of Parkinson’s disease. J Neurol Neurosurg Psychiatry. 1997;62(1):10–15. | ||
Schrag A, Ben-Shlomo Y, Quinn NP. Cross sectional prevalence survey of idiopathic Parkinson’s disease and parkinsonism in London. BMJ. 2000;321(7252):21–22. | ||
Muangpaisan W, Hori H, Brayne C. Systematic review of the prevalence and incidence of Parkinson’s disease in Asia. J Epidemiol. 2009; 19(6):281–293. | ||
Chan DK, Cordato D, Karr M, et al. Prevalence of Parkinson’s disease in Sydney. Acta Neurol Scand. 2005;111(1):7–11. | ||
Osuntokun BO, Adeuja AO, Schoenberg BS, et al. Neurological disorders in Nigerian Africans: a community-based study. Acta Neurol Scand. 1987;75(1):13–21. | ||
Trenkwalder C, Schwarz J, Gebhard J, et al. Starnberg trial on epidemiology of parkinsonism and hypertension in the elderly. Prevalence of Parkinson’s disease and related disorders assessed by a door-to-door survey of inhabitants older than 65 years. Arch Neurol. 1995;52(10): 1017–1022. | ||
Attia Romdhane N, Ben Hamida M, Mrabet A, et al. Prevalence study of neurologic disorders in Kelibia (Tunisia). Neuroepidemiology. 1993; 12(5):285–299. | ||
al Rajeh S, Bademosi O, Ismail H, et al. A community survey of neurological disorders in Saudi Arabia: the Thugbah study. Neuroepidemiology. 1993;12(3):164–178. | ||
Seijo-Martinez M, Castro del Rio M, Rodríguez Alvarez J, et al. Prevalence of parkinsonism and Parkinson’s disease in the Arosa Island (Spain): a community-based door-to-door survey. J Neurol Sci. 2011; 304(1–2):49–54. | ||
Van Den Eeden SK, Tanner CM, Bernstein AL, et al. Incidence of Parkinson’s disease: variation by age, gender, and race/ethnicity. Am J Epidemiol. 2003;157(11):1015–1022. | ||
Hosseini-Chavoshi M, Abbasi-Shavazi MJ, Bittles AH. Consanguineous marriage, reproductive behaviour and postnatal mortality in contemporary Iran. Hum Hered. 2014;77(1–4):16–25. | ||
Alves G, Müller B, Herlofson K, et al. Incidence of Parkinson’s disease in Norway: the Norwegian ParkWest study. J Neurol Neurosurg Psychiatry. 2009;80(8):851–857. | ||
Haaxma CA, Bloem BR, Borm GF, et al. Gender differences in Parkinson’s disease. J Neurol Neurosurg Psychiatry. 2007;78(8):819–824. |
Supplementary material
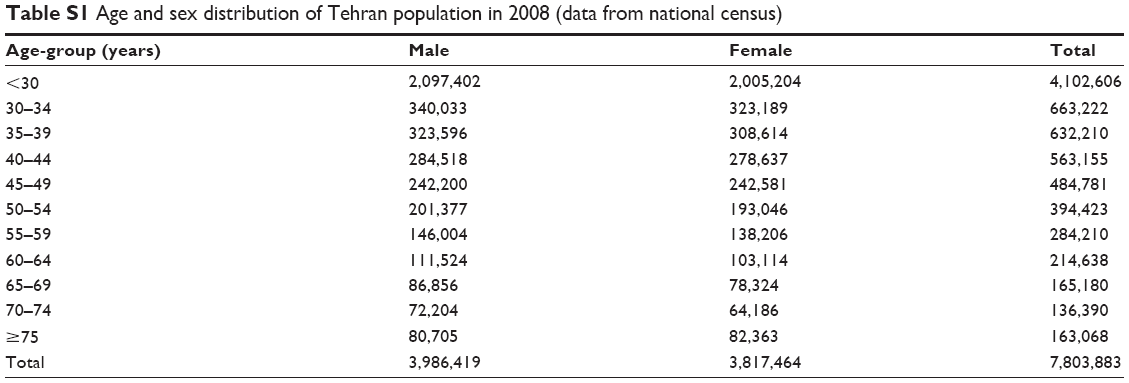 | Table S1 Age and sex distribution of Tehran population in 2008 (data from national census) |
 © 2015 The Author(s). This work is published and licensed by Dove Medical Press Limited. The full terms of this license are available at https://www.dovepress.com/terms.php and incorporate the Creative Commons Attribution - Non Commercial (unported, v3.0) License.
By accessing the work you hereby accept the Terms. Non-commercial uses of the work are permitted without any further permission from Dove Medical Press Limited, provided the work is properly attributed. For permission for commercial use of this work, please see paragraphs 4.2 and 5 of our Terms.
© 2015 The Author(s). This work is published and licensed by Dove Medical Press Limited. The full terms of this license are available at https://www.dovepress.com/terms.php and incorporate the Creative Commons Attribution - Non Commercial (unported, v3.0) License.
By accessing the work you hereby accept the Terms. Non-commercial uses of the work are permitted without any further permission from Dove Medical Press Limited, provided the work is properly attributed. For permission for commercial use of this work, please see paragraphs 4.2 and 5 of our Terms.