")
Back to Journals » International Journal of Chronic Obstructive Pulmonary Disease » Volume 9 » Issue 1
Low FEV1, smoking history, and obesity are factors associated with oxygen saturation decrease in an adult population cohort
Authors Vold ML, Aasebø U, Melbye H
Received 15 June 2014
Accepted for publication 31 July 2014
Published 21 October 2014 Volume 2014:9(1) Pages 1225—1233
DOI https://doi.org/10.2147/COPD.S69438
Checked for plagiarism Yes
Review by Single anonymous peer review
Peer reviewer comments 5
Editor who approved publication: Dr Richard Russell
Monica Linea Vold,1,3 Ulf Aasebø,1,2 Hasse Melbye3
1Department of Respiratory Medicine, University Hospital of North Norway, 2Department of Clinical Medicine, 3Department of Community Medicine, University of Tromsø, Tromsø, Norway
Background: Worsening of pulmonary diseases is associated with a decrease in oxygen saturation (SpO2). Such a decrease in SpO2 and associated factors has not been previously evaluated in a general adult population.
Aim: We sought to describe SpO2 in a sample of adults, at baseline and after 6.3 years, to determine whether factors predicting low SpO2 in a cross-sectional study were also associated with a decrease in SpO2 in this cohort.
Methods: As part of the Tromsø Study, 2,822 participants were examined with pulse oximetry in Tromsø 5 (2001/2002) and Tromsø 6 (2007/2008). Low SpO2 by pulse oximetry was defined as an SpO2 ≤95%, and SpO2 decrease was defined as a ≥2% decrease from baseline to below 96%.
Results: A total of 139 (4.9%) subjects had a decrease in SpO2. Forced expiratory volume in 1 second (FEV1) <50% of the predicted value and current smoking with a history of ≥10 pack-years were the baseline characteristics most strongly associated with an SpO2 decrease in multivariable logistic regression (odds ratio 3.55 [95% confidence interval (CI) 1.60–7.89] and 2.48 [95% CI 1.48–4.15], respectively). Male sex, age, former smoking with a history of ≥10 pack-years, body mass index ≥30 kg/m2, and C-reactive protein ≥5 mg/L were also significantly associated with an SpO2 decrease. A significant decrease in FEV1 and a new diagnosis of asthma or chronic obstructive pulmonary disease during the observation period most strongly predicted a fall in SpO2. A lower SpO2 decrease was observed in those who quit smoking and those who lost weight, but these tendencies were not statistically significant.
Conclusion: A decrease in SpO2 was most strongly associated with severe airflow limitation and a history of smoking. Smoking cessation and reducing obesity seem to be important measures to target for avoiding SpO2 decreases in the general population.
Keywords: pulse oximetry, lung function, cohort study, general population
Introduction
Pulse oximetry is an inexpensive, noninvasive method for measuring oxygen saturation (SpO2). Pulse oximetry has a wide range of use both in primary pulmonary care and critical care medicine. Low SpO2/hypoxemia have been associated with conditions or diseases causing ventilation–perfusion mismatch in the lungs, hypoventilation, right-to-left shunts, reduced diffusion capacity, and reduced oxygen partial pressure in inspired air. Decrease in SpO2/desaturation has been associated with the worsening of preexisting pulmonary diseases.1–3
There is no clear cutoff point for abnormal SpO2, but SpO2 ≤95% is used in most adult studies. In their blood gas reference values for sea level, Crapo et al found mean arterial oxygen saturation (SaO2) to be 95.5%–96.9% (standard deviation [SD] 0.4%–1.4%), depending on age.4 Resting SpO2 ≤95% has been found to predict oxygen desaturation during sleep, exercise, and flights, in chronic obstructive pulmonary disease (COPD) patients.5–7 SpO2 ≤95% has also been identified as a risk factor for postoperative pulmonary complications.8 The limit of 96% therefore seems a reasonable cutoff value. A cutoff value of ≤92% has been used when screening for respiratory failure in COPD.9
In a previous cross-sectional study, we have shown that body mass index (BMI) and the forced expiratory volume in 1 second (FEV1) as a percentage of the predicted value (FEV1 % predicted) are the most important predictors of low SpO2 in the general adult population.10 Other predictors for low SpO2 are former and current smoking, C-reactive protein (CRP) ≥5 mg/L, age, male sex, elevated hemoglobin, and respiratory symptoms.
The role of inflammation in lung function decline is not clearly understood. CRP and other biomarkers have, in COPD, been associated with progression of the disease and decline in lung function.11–13 Systemic inflammation in COPD might play a role in the development of extrapulmonary comorbid conditions.14,15 Elevated CRP levels have previously been found to be associated with cardiovascular disease (CVD), metabolic syndrome, and obesity. In sleep apnea, elevated CRP has been associated with hypoxemia.16,17 Sleep apnea is associated with obesity and metabolic syndrome, both characterized by systemic inflammation and comorbidities.18 In some studies, elevated CRP has been associated with hypoxemia in COPD patients.19,20
Lung function decline in adult population cohorts has been evaluated by spirometry, but decrease in SpO2 has not been studied. We wanted to investigate changes in SpO2 in an adult population cohort to determine whether parameters predicting low SpO2 in a cross-sectional study were also associated with a decrease in SpO2 in a cohort study.
Material and methods
Subjects
A cohort of the adult population in Tromsø, Norway has been followed in the Tromsø Study since 1974. Tromsø is a university city in northern Norway, with approximately 70,000 inhabitants. To date, the Tromsø Study has consisted of six cross-sectional studies. Participant selection in Tromsø 4 (1994/1995) has influenced later studies as described in the cohort profile (Figure 1).21 In the fourth study, all inhabitants of Tromsø 55–74 years of age, and 5%–10% of the samples in the other cohorts aged 25–84 years were asked to take part in an extra, more extended medical examination; a total of 7,916 (77%) participated. All participants who had this second visit in Tromsø 4 were invited to the Tromsø 5 Study21 and were again eligible for a second, extended, medical examination. As part of the fifth Tromsø Study (2001/2002), 5,152 subjects were examined with pulse oximetry. Of these, 3,453 (67.0%) participants also took part in Tromsø 6 (2007/2008),21 and 3,127 (60.7%) attended the extended examination. Figure 2 shows the flow chart of participants from Tromsø 5 to 6.
 | Figure 1 Participation from Tromsø 4 (T4) to Tromsø 5 (T5). |
 | Figure 2 Participation from Tromsø 5 (T5) to Tromsø 6 (T6). |
A total of 9.8% of the participants were not examined with pulse oximetry and spirometry due to absence of staff or drop out related to wait time for lung function testing. SpO2 values of 2,822 participants were measured in both Tromsø 5 and Tromsø 6. The mean time between measurements was 6.3 years (SD 0.4 years).
Examinations
In both Tromsø 5 and Tromsø 6, a questionnaire including medical history and smoking habits was enclosed in the invitation to participate. Participants who reported suffering from angina pectoris, myocardial infarction, or cerebral stroke were classified as “self-reported CVD”. “Pack-years” of cigarette use was calculated by multiplying the average number of cigarettes smoked daily by the number of years smoked and dividing the product by 20. Subjects who attended the assessment received an additional questionnaire about dyspnea, cough, and sputum. Examinations at the first visit included height and weight, and BMI (kg/m2) was calculated.
Pulse oximetry and spirometry were included at the second visit for both Tromsø 5 and Tromsø 6. SpO2 values were measured with a digital handheld pulse oximeter (Onyx II® 9550; Nonin Medical, Inc., Plymouth, MN, USA). Participants rested at least 15 minutes before examination. The best of three measurements was recorded. The manufacturer’s testing has shown that only values between 70% and 100% are accurate to within ±2%, and values below 70% are regarded as invalid. None of the participants received supplemental oxygen.
Spirometry was carried out using a SensorMedics Vmax™ Legacy 20® (VIASYS Healthcare Respiratory Technologies, Yorba Linda, CA, USA) in Tromsø 5, and the Vmax Encore 20® (VIASYS Healthcare Respiratory Technologies) in Tromsø 6. American Thoracic Society (ATS)/European Respiratory Society (ERS) criteria for spirometry testing were followed.22 Norwegian reference values for prebronchodilator spirometry were used because reversibility testing was not performed.23 Three trained technicians conducted the spirometry.
Adjustment of spirometry results
The mean annual FEV1 decline of 14 mL/year (standard error [SE] 0.8) was lower than expected. The lowest mean decline recorded, in samples of women who never smoked, was 17.6 mL/year, but higher values, depending on sex, age, and history of smoking, are usually found.24,25 We therefore considered potential sources of bias. The use of two different spirometers in Tromsø 5 and 6 was a likely source. The Norwegian supplier confirmed that the Vmax Legacy used in Tromsø 5 probably provided values that were too low and that this was not the case for Vmax Encore used in Tromsø 6, but no documentation could be provided. Küenzli et al have demonstrated that using different spirometers in longitudinal studies is a source of bias.26 We therefore tested 48 subjects, 24 patients and 24 voluntary employees using both spirometers. The mean FEV1 value found with the Vmax Legacy was 2.5% (66 mL [SE 14 mL]) lower than that measured by the Vmax Encore. We therefore chose to correct the FEV1 values in Tromsø 5 by adding 2.5%. Likewise, forced vital capacity (FVC), was 5.2% (188 mL [SE 25 mL]) lower when the Vmax Legacy was used compared with the Vmax Encore.
Laboratory samples
Blood was drawn for high-sensitivity CRP, fibrinogen, and uric acid analyses (also biomarkers of inflammation). For 3 consecutive days, albumin and creatinine were measured in urine, and the albumin:creatinine ratio (ACR) was estimated for each day. Mean values were used in the analysis, and an ACR between 3.0 and 30.0 mg/mmol was used as an indication of microalbuminuria.
Statistical analysis
Low SpO2 was defined by SpO2 ≤95%, and SpO2 decrease was defined by ≥2% decrease from baseline to <96%. Differences in continuous variables between subgroups at baseline (Tromsø 5) were explored using the Mann–Whitney U test, and differences found between baseline and after 6.3 years were explored using the Wilcoxon signed-rank test. Frequency of SpO2 decrease was analyzed by sex, age, smoking habit, spirometry, BMI, CRP, fibrinogen, uric acid, ACR, self-reported health and diseases, and pulmonary symptoms. Continuous variables (age, BMI, FEV1, fibrinogen, uric acid, ACR, and CRP) were categorized, and the statistical significance of differences was analyzed by chi-square test. Predictors of SpO2 decrease with a statistical significance of <5% were entered into a multivariable binary logistic regression and excluded by backward stepwise elimination. Only predictors with P<0.05 were kept in the final model. Changes from baseline variables other than SpO2 were registered and continuous variables categorized, based on one standard deviation. The associations with SpO2 decrease were analyzed by chi-square test. IBM SPSS Statistics for Windows, Version 21 (IBM Corp, Armonk, NY, USA) was used.
The Regional Committee for Medical and Health Research Ethics in North Norway approved the Tromsø 5 and 6 surveys. All participants gave written, informed consent.
Results
Among the 2,822 participants who had SpO2 measured in both studies, 241 (8.5%) and 213 (7.5%) had an SpO2≤95% in Tromsø 5 and Tromsø 6, respectively. Fifty-six (2.0%) had SpO2 ≤95% in both studies. Sixteen (0.6%) in Tromsø 5 and 25 (0.9%) participants in Tromsø 6 had SpO2 ≤92%. SpO2 decrease was seen in 139 (4.9%) participants. Mean age at baseline of the 2,822 participants was 63.2 (SD 8.9) years, range 32–81 years. No significant difference was seen between mean SpO2 at baseline (97.4%) and that found after 6.3 years (97.3%). Self-reported diseases were more frequently reported in Tromsø 6 than in Tromsø 5, but the frequency of current smoking dropped from 23.7 to 15.2 (Table 1). Valid spirometry was found in 2,728 participants, for both baseline and after 6.3 years. Mean FEV1 % predicted increased significantly, from 88.7% to 90.8% (P<0.001). There was no significant change in mean BMI, but in those with BMI ≥30 kg/m2 at baseline, the BMI decreased significantly, from 32.8 to 32.4 (P<0.001).
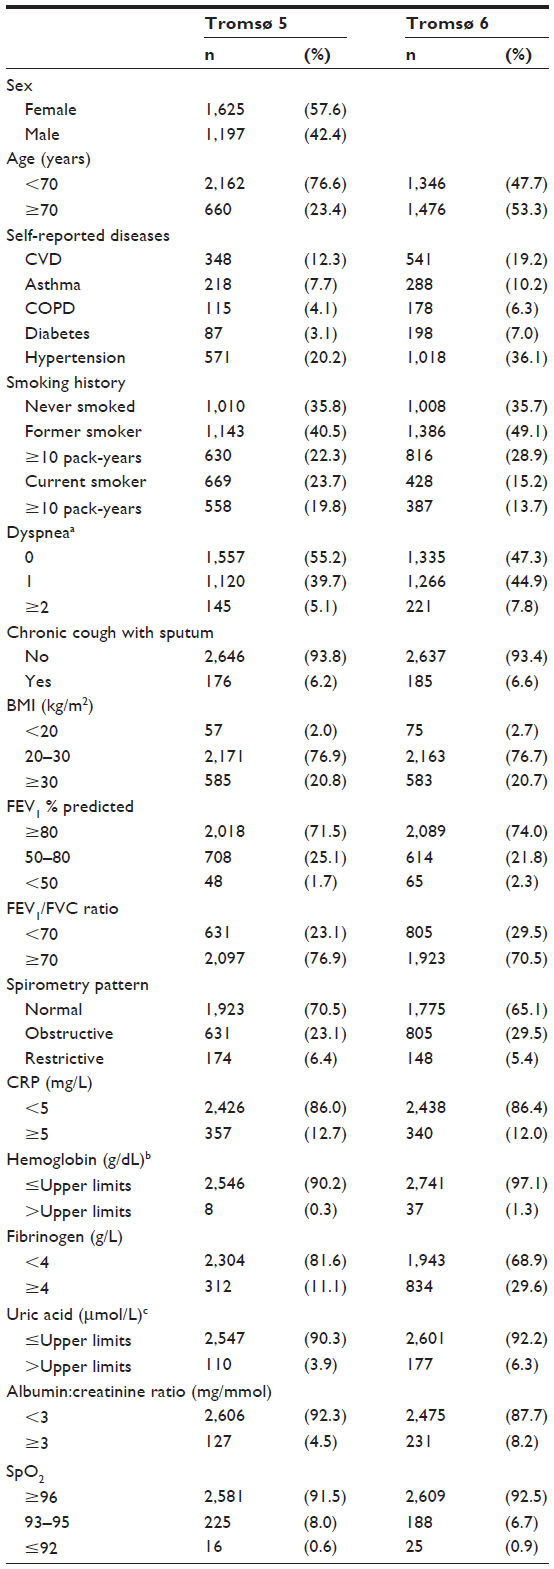 | Table 1 Characteristics of 2,822 participants in Tromsø 5 (baseline) and Tromsø 6 (6.3 years later) |
Table 2 displays frequency of SpO2 decrease by baseline characteristics. Age, male sex, self-reported CVD, obesity (BMI ≥30 kg/m2), FEV1 % predicted, chronic cough with sputum, and smoking were all significantly associated with a SpO2 decrease in univariable analysis, as were the biomarkers CRP, fibrinogen, and uric acid.
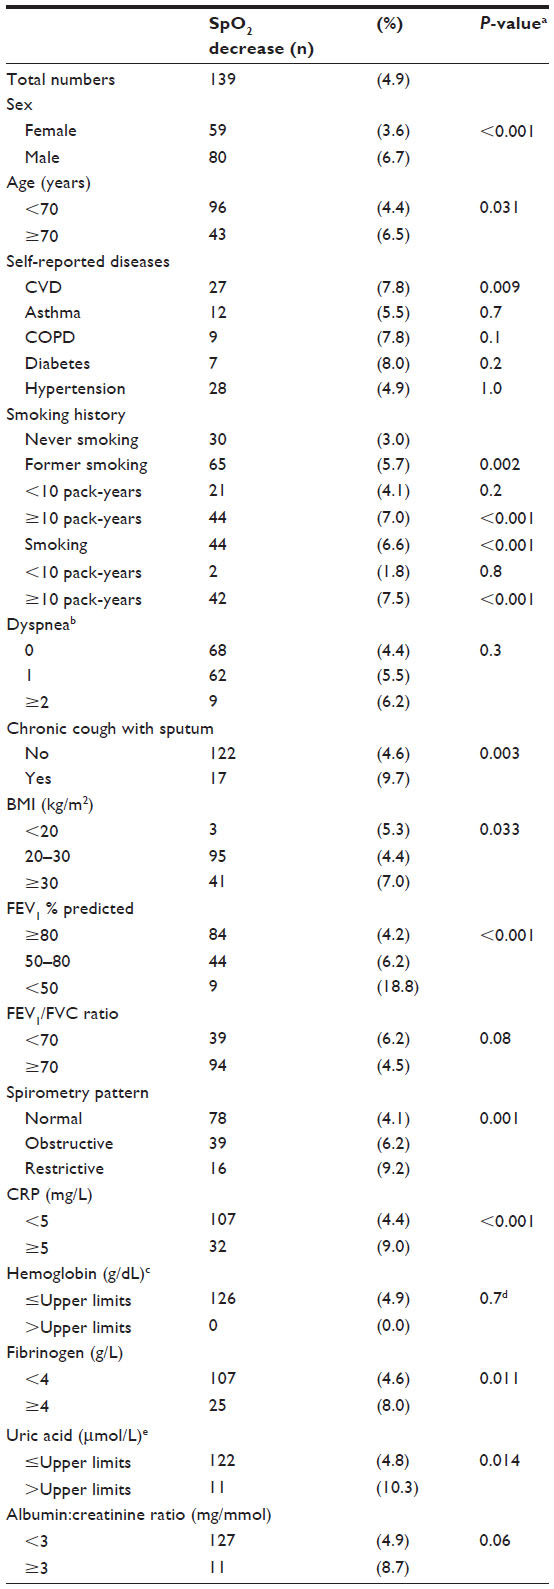 | Table 2 Frequency of SpO2 decrease by subjects’ characteristics among 2,822 study participants |
Table 3 shows the results of the multivariable logistic regression. In the final multivariable analysis, 2,682 subjects were included. Current smoking with pack-years ≥10 and FEV1 % predicted <50 had the highest odds ratio (OR), 2.48 (1.48–4.15) and 3.55 (1.60–7.89), respectively. In addition age, male sex, former smoking with pack-years ≥10, increased CRP, and high BMI were significant predictors in the multivariable analysis. We did not find any significant interactions. Assumptions for logistic regression were met, and we did not find any multicollinearity.
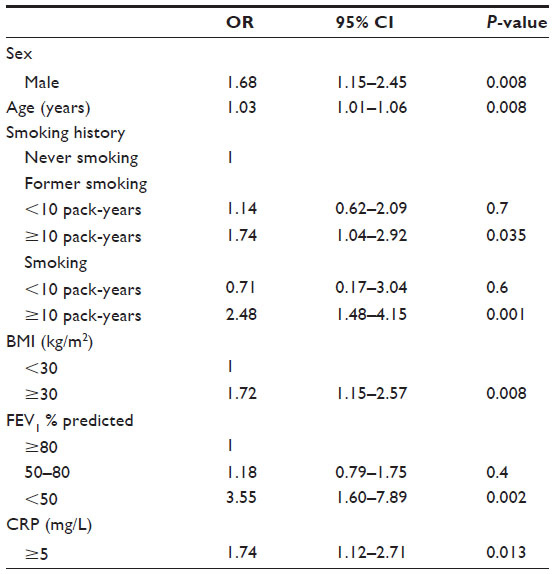 | Table 3 Factors associated with arterial oxygen saturation (SpO2) decrease in multivariable logistic regression |
When FEV1/FVC ratio, as a dichotomous (with a threshold of 0.7 or lower) or as a continuous variable, was added to the multivariable model that included FEV1 % predicted, no significant association with SpO2 decrease was found; 91.7% of FEV1 % predicted <50 had FEV1/FVC ratio <0.7.
Frequency of SpO2 decrease by changes from baseline of other variables (across Tromsø 5 and Tromsø 6) is shown in Table 4. Participants who had been diagnosed with asthma, COPD, or diabetes between the two time points had a significantly higher incidence of SpO2 decrease. These participants had significantly decreased FEV1 % predicted at baseline, of 81.1, 71.5, and 82.8, respectively, (P<0.001). In addition, FEV1 % predicted decrease/year and CRP increase were associated with SpO2 decrease. As BMI increased, the frequency of decline in SpO2 increased. The opposite was the case when BMI dropped. This trend was not statistically significant. Smoking cessation between the time points was associated with a lower frequency of SpO2 decrease than was continued smoking, but this finding was not statistically significant.
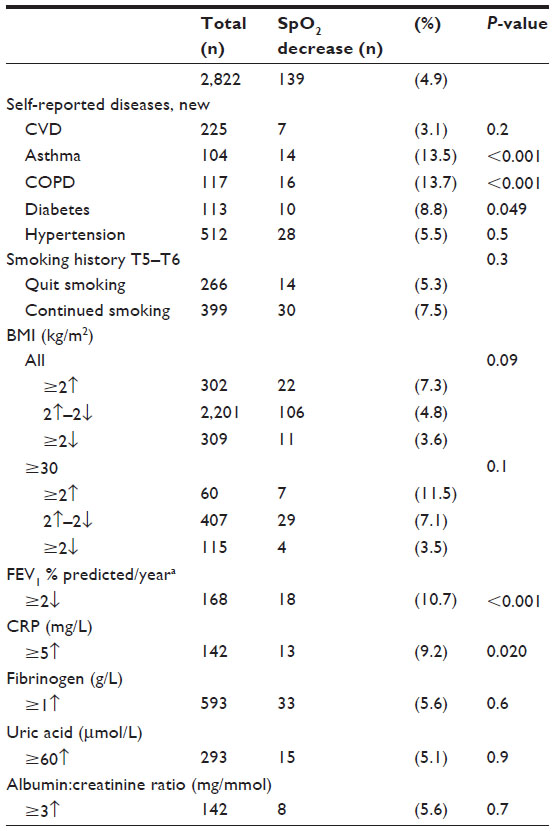 | Table 4 Frequency of SpO2 decrease and associations to changes from baseline characteristics |
Discussion
SpO2 decrease was associated with smoking history ≥10 pack-years, lung function (by FEV1 % predicted <50), BMI ≥30 kg/m2, CRP ≥5 mg/L, male sex, and age, in multivariable logistic regression. Decrease in FEV1 % predicted was significantly associated with decrease in SpO2, and a tendency, although not statistically significant, for less frequent SpO2 decrease with BMI decrease and smoking cessation were also observed.
Comparison with previous studies
This study complements our previous cross-sectional study showing that smoking, FEV1 % predicted, and obesity are the most important predictors of low SpO2.10 The findings from a longitudinal cohort provide stronger indications of a causal relationship than can be determined using a cross-sectional study.27
The association between male sex and a fall in SpO2 was consistent with our previous findings. More men had previously smoked and had also smoked for more pack-years. CVD was also more common in men.
The impact of age was also consistent with the cross-sectional study. Aging means physiological changes and increasing comorbidity, and the summation of risk factors might accelerate an SpO2 decrease.
We found a significant association between SpO2 decrease and self-reported CVD in univariable analysis. CVD contributes to heart failure, which may affect pulmonary function and thus lower SpO2. This association was not shown in multivariable analysis. One reason for this might be that CVD is strongly associated with both age and male sex.
Low SpO2 and partial pressure of oxygen in arterial blood (PaO2) in smokers have been shown in previous studies.28,29 Even when correcting for lung function by FEV1 % predicted, this association was clearly demonstrated.
More than 90% of the group with a FEV1 % predicted <50 had an FEV1/FVC ratio <0.7. Even though an FEV1/FVC ratio <0.7 was not significant in univariate analysis, severe airflow limitation seems to be associated with an SpO2 decrease.
We found that baseline CRP ≥5 mg/L was associated with an SpO2 decrease in both uni- and multivariable analysis, and the associations with CVD and other chronic diseases probably contributed to increased OR in the multivariable analysis. Other biomarkers, such as fibrinogen, uric acid, and microalbuminuria (expressed by the albumin:creatinine ratio), were significant in univariable, but not multivariable, analyses. Microalbuminuria has been found to be associated with hypoxia (defined as SpO2 ≤92%) in COPD.30,31 In our study, less than 1% of participants had SpO2 ≤92%, which may be a reason for not finding this association. CRP might also be a better marker of inflammation associated with SpO2 decrease than microalbuminuria, fibrinogen, and uric acid.
BMI ≥30 kg/m2 was, as expected, associated with SpO2 decrease. Among other disorders, this group is at risk for sleep apnea and obesity hypoventilation, which is known to lead to low daytime SpO2.32–34
Baseline hemoglobin above the upper limit was not associated with SpO2 decrease. This was expected since a high hemoglobin value is usually a consequence of, rather than a reason for, a decrease in SpO2.
A new diagnosis of asthma or COPD between the time points was associated with a decrease in SpO2. Subjects with such a new diagnosis had decreased FEV1 % predicted at baseline. COPD is frequently underdiagnosed, which may be linked to less help-seeking among smokers.35 It is not unexpected that subjects recently diagnosed with COPD or asthma had troubling symptoms and increased risk of decreased SpO2.
Strength and limitation
The subjects in this study were a subgroup of participants in the cross-sectional study on SpO2 from the sixth Tromsø Study.10 This study would have provided stronger supplemental evidence if the subjects had been recruited from a separate population sample. Of the original group examined with lung function tests in Tromsø 5, only 54.8% were reexamined in Tromsø 6. We know that almost 10% died between these time points. Those with severe health problems and increased risk of low SpO2 probably participated to a lesser degree than others. We found that almost 10% quit smoking, mean FEV1 % predicted increased, and those in the obese category lost weight. A healthy survivor effect and a decreased representation of those with poor health may have led to a healthier sample. This may explain why aging did not lead to decreased SpO2.
Smoking may have been a difficult topic for some participants, and thus there may have been some bias in categorizing smokers, former smokers, and never smokers. Yet previous studies have showed that self-reports of smoking are usually accurate.36,37 The pack-years calculated might be uncertain, because of recall bias, especially among former smokers. Only seven out of 256 participants who quit smoking between Tromsø 5 and 6 had valid data on the question, “How long has it been since you stopped?” Some participants may have stopped smoking recently, and the effect of smoking cessation on SpO2 may not have been measurable yet, thereby weakening the associations.
Pulse oximetry has some limitations; among others, high carboxyhemoglobin might have given falsely elevated SpO2 in smokers and thus, diminished the association between SpO2 and smoking.38
SpO2 decrease may be imprecise since the accuracy of the device is within ±2%. By using three measurements, categorizing in groups, and excluding values that fell within the normal range (SpO2 >95%), we tried to decrease this influence.
The FEV1 % predicted values in Tromsø 6 increased. Reasons for this might be selection bias and a healthier sample. Using two different spirometers may also have contributed to the difference, even though we attempted to correct for this. Using age in whole years as of December 31 in calculating FEV1 % predicted may have resulted in a systematic bias, since the mean years between analyses were 6.3, not 6.0;39 however, this is likely to have underestimated the increase in predicted values. Due to the high number of subjects aged 75 years or older, a limitation in the validity of the reference values, when applied in the oldest age groups, might also have played a role.
Clinical implications
This study describes associations between unhealthy lifestyle and decreased SpO2. Smoking stands out as an important cause, and not only through its deteriorating effect on lung function. Obesity is another modifiable risk factor for decreased SpO2. It is promising that the findings in this study indicate that subjects who stop smoking or lose weight may have a decreased risk of decreased SpO2. It may be possible to stabilize SpO2 with a healthier lifestyle.
Conclusion
A decrease in SpO2 was most strongly associated with low FEV1 % predicted and a history of smoking. It was also associated with higher BMI. This is in accordance with the findings of our previous cross-sectional study. Smoking cessation and reducing obesity are important measures that may help avoid SpO2 decrease in the general population.
Author contributions
All authors participated in concept and design of the study. HM performed data collection, and MLV and HM performed data analysis and interpretation. MLV and HM drafted the manuscript. All authors participated in revision and gave final approval of the manuscript.
Disclosure
The authors report no conflict of interest in this work.
References
Kent BD, Mitchell PD, McNicholas WT. Hypoxemia in patients with COPD: cause, effects, and disease progression. Int J Chron Obstruct Pulmon Dis. 2011;6:199–208. | |
West JB. Causes of and compensations for hypoxemia and hypercapnia. Compr Physiol. 2011;1(3):1541–1553. | |
Young IH, Bye PT. Gas exchange in disease: asthma, chronic obstructive pulmonary disease, cystic fibrosis, and interstitial lung disease. Compr Physiol. 2011;1(2):663–697. | |
Crapo RO, Jensen RL, Hegewald MATH, Taskin DP. Arterial blood gas reference values for sea level and an altitude of 1,400 meters. Am J Respir Crit Care Med. 1999;160(5):1525–1531. | |
Little SA, Elkholy MM, Chalmers GW, Farouk A, Patel KR, Thomson NC. Predictors of nocturnal oxygen desaturation in patients with COPD. Respir Med. 1999;93(3):202–207. | |
Knower MT, Dunagan DP, Adair NE, Chin R Jr. Baseline oxygen saturation predicts exercise desaturation below prescription threshold in patients with chronic obstructive pulmonary disease. Arch Intern Med. 2001;161(5):732–736. | |
Edvardsen A, Akero A, Christensen CC, Ryg M, Skjonsberg OH. Air travel and chronic obstructive pulmonary disease: a new algorithm for pre-flight evaluation. Thorax. 2012;67(11):964–969. | |
Canet J, Gallart L, Gomar C, et al. Prediction of postoperative pulmonary complications in a population-based surgical cohort. Anesthesiology. 2010;113(6):1338–1350. | |
Roberts CM, Bugler JR, Melchor R, Hetzel MR, Spiro SG. Value of pulse oximetry in screening for long-term oxygen therapy requirement. Eur Respir J. 1993;6(4):559–562. | |
Vold ML, Aasebø U, Hjalmarsen A, Melbye H. Predictors of oxygen saturation ≤95% in a cross-sectional population based survey. Respir Med. 2012;106(11):1551–1558. | |
Ahmadi-Abhari S, Kaptoge S, Luben RN, Wareham NJ, Khaw KT. Longitudinal association of C-reactive protein and lung function over 13 years: The EPIC-Norfolk study. Am J Epidemiol. 2014;179(1):48–56. | |
Kalhan R, Tran BT, Colangelo LA, et al. Systemic inflammation in young adults is associated with abnormal lung function in middle age. PLoS One. 2010;5(7):e11431. | |
Rosenberg SR, Kalhan R. Biomarkers in chronic obstructive pulmonary disease. Transl Res. 2012;159(4):228–237. | |
Agusti A, Soriano JB. COPD as a systemic disease. COPD. 2008;5(2):133–138. | |
Vestbo J, Hurd SS, Agusti AG, et al. Global strategy for the diagnosis, management, and prevention of chronic obstructive pulmonary disease: GOLD executive summary. Am J Respir Crit Care Med. 2013;187(4):347–365. | |
Kapsimalis F, Varouchakis G, Manousaki A, et al. Association of sleep apnea severity and obesity with insulin resistance, C-reactive protein, and leptin levels in male patients with obstructive sleep apnea. Lung. 2008;186(4):209–217. | |
Roche F, Gaspoz JM, Pichot V, et al. Association between C-reactive protein and unrecognised sleep-disordered breathing in the elderly. Eur Respir J. 2009;33(4):797–803. | |
Vijayan VK. Morbidities associated with obstructive sleep apnea. Expert Rev Respir Med. 2012;6(5):557–566. | |
Aksu F, Capan N, Aksu K, et al. C-reactive protein levels are raised in stable chronic obstructive pulmonary disease patients independent of smoking behavior and biomass exposure. J Thorac Dis. 2013;5(4):414–421. | |
de Torres JP, Cordoba-Lanus E, Lopez-Aguilar C, et al. C-reactive protein levels and clinically important predictive outcomes in stable COPD patients. Eur Respir J. 2006;27(5):902–907. | |
Jacobsen BK, Eggen AE, Mathiesen EB, Wilsgaard T, Njolstad I. Cohort profile: the Tromso Study. Int J Epidemiol. 2011;41(4):961–967. | |
Miller MR, Hankinson J, Brusasco V, et al. Standardisation of spirometry. Eur Respir J. 2005;26(2):319–338. | |
Langhammer A, Johnsen R, Gulsvik A, Holmen TL, Bjermer L. Forced spirometry reference values for Norwegian adults: the Bronchial Obstruction in Nord-Trondelag Study. Eur Respir J. 2001;18(5):770–779. | |
Kohansal R, Martinez-Camblor P, Agusti A, Buist AS, Manninio DM, Soriano JB. The natural history of chronic airflow obstruction revisited: an analysis of the Framingham offspring cohort. Am J Respir Crit Care Med. 2009;180(1):3–10. | |
Fletcher C, Peto R. The natural history of chronic airflow obstruction. Br Med J. 1977;1(6077):1645–1648. | |
Kunzli N, Kuna-Dibbert B, Keidel D, et al. Longitudinal validity of spirometers – a challenge in longitudinal studies. Swiss Med Wkly. 2005;135(33–34):503–508. | |
Szklo M, Nieto FJ. Epidemiology: Beyond the Basics. 2nd ed. Massachusetts: Jones and Bartlett Publishers; 2007. | |
Tirlapur VG, Gicheru K, Charalambous BM, Evans PJ, Mir MA. Packed cell volume, haemoglobin, and oxygen saturation changes in healthy smokers and non-smokers. Thorax. 1983;38(10):785–787. | |
Ouattara S, Keita M, Tuo N, Dah C, Siransy EA, Bogui P. [Effect of smoking on PaO2 at rest and during moderate exercise]. Dakar Med. 2002;47(1):90–95. | |
Casanova C, de Torres JP, Navarro J, et al. Microalbuminuria and hypoxemia in patients with chronic obstructive pulmonary disease. Am J Respir Crit Care Med. 2010;182(8):1004–1010. | |
Komurcuoglu A, Kalenci S, Kalenci D, Komurcuoglu B, Tibet G. Microalbuminuria in chronic obstructive pulmonary disease. Monaldi Arch Chest Dis. 2003;59(4):269–272. | |
Laaban JP, Cassuto D, Orvoen-Frija E, et al. Cardiorespiratory consequences of sleep apnoea syndrome in patients with massive obesity. Eur Respir J. 1998;11(1):20–27. | |
Verin E, Tardif C, Pasquis P. Prevalence of daytime hypercapnia or hypoxia in patients with OSAS and normal lung function. Respir Med. 2001;95(8):693–696. | |
Zavorsky GS, Hoffman SL. Pulmonary gas exchange in the morbidly obese. Obes Rev. 2008;9(4):326–339. | |
Melbye H, Joensen L, Risor MB, Halvorsen PA. Symptoms of respiratory tract infection and associated care-seeking in subjects with and without obstructive lung disease; the Tromso Study: Tromso 6. BMC Pulm Med. 2012;12:51. | |
Patrick DL, Cheadle A, Thompson DC, Diehr P, Koepsell T, Kinne S. The validity of self-reported smoking: a review and meta-analysis. Am J Public Health. 1994;84(7):1086–1093. | |
Vartiainen E, Seppala T, Lillsunde P, Puska P. Validation of self reported smoking by serum cotinine measurement in a community-based study. J Epidemiol Community Health. 2002;56(3):167–170. | |
Jensen LA, Onyskiw JE, Prasad NG. Meta-analysis of arterial oxygen saturation monitoring by pulse oximetry in adults. Heart Lung. 1998;27(6):387–408. | |
Quanjer PH, Hall GL, Stanojevic S, Cole TJ, Stocks J. Age- and height-based prediction bias in spirometry reference equations. Eur Respir J. 2012;40(1):190–197. |
 © 2014 The Author(s). This work is published and licensed by Dove Medical Press Limited. The full terms of this license are available at https://www.dovepress.com/terms.php and incorporate the Creative Commons Attribution - Non Commercial (unported, v3.0) License.
By accessing the work you hereby accept the Terms. Non-commercial uses of the work are permitted without any further permission from Dove Medical Press Limited, provided the work is properly attributed. For permission for commercial use of this work, please see paragraphs 4.2 and 5 of our Terms.
© 2014 The Author(s). This work is published and licensed by Dove Medical Press Limited. The full terms of this license are available at https://www.dovepress.com/terms.php and incorporate the Creative Commons Attribution - Non Commercial (unported, v3.0) License.
By accessing the work you hereby accept the Terms. Non-commercial uses of the work are permitted without any further permission from Dove Medical Press Limited, provided the work is properly attributed. For permission for commercial use of this work, please see paragraphs 4.2 and 5 of our Terms.