")
Back to Journals » International Journal of Nanomedicine » Volume 9 » Issue 1
Inhibited bacterial biofilm formation and improved osteogenic activity on gentamicin-loaded titania nanotubes with various diameters
Authors Lin W, Tan H, Duan Z, Yue B, Ma R, He G, Tang T
Received 19 November 2013
Accepted for publication 17 December 2013
Published 7 March 2014 Volume 2014:9(1) Pages 1215—1230
DOI https://doi.org/10.2147/IJN.S57875
Checked for plagiarism Yes
Review by Single anonymous peer review
Peer reviewer comments 4
Wen-tao Lin,1 Hong-lue Tan,1 Zhao-ling Duan,2 Bing Yue,1 Rui Ma,1 Guo He,2 Ting-ting Tang1
1Shanghai Key Laboratory of Orthopedic Implants, Department of Orthopedic Surgery, Shanghai Ninth People's Hospital, Shanghai Jiao Tong University School of Medicine, Shanghai, People's Republic of China; 2State Key Laboratory of Metal Matrix Composites, School of Materials Science and Engineering, Shanghai Jiao Tong University, Shanghai, People's Republic of China
Abstract: Titania nanotubes loaded with antibiotics can deliver a high concentration of antibiotics locally at a specific site, thereby providing a promising strategy to prevent implant-associated infections. In this study we have fabricated titania nanotubes with various diameters (80, 120, 160, and 200 nm) and 200 nm length via electrochemical anodization. These nanotubes were loaded with 2 mg of gentamicin using a lyophilization method and vacuum drying. A standard strain, Staphylococcus epidermidis (American Type Culture Collection 35984), and two clinical isolates, S. aureus 376 and S. epidermidis 389, were selected to investigate the anti-infective ability of the gentamicin-loaded nanotubes (NT-G). Flat titanium (FlatTi) and nanotubes with no drug loading (NT) were also investigated and compared. We found that NT-G could significantly inhibit bacterial adhesion and biofilm formation compared to FlatTi or NT, and the NT-G with 160 nm and 200 nm diameters had stronger antibacterial activity because of the extended drug release time of NT-G with larger diameters. The NT also exhibited greater antibacterial ability than the FlatTi, while nanotubes with 80 nm or 120 nm diameters had better effects. Furthermore, human marrow derived mesenchymal stem cells were used to evaluate the effect of nanotubular topographies on the osteogenic differentiation of mesenchymal stem cells. Our results showed that NT-G and NT, especially those with 80 nm diameters, significantly promoted cell attachment, proliferation, spreading, and osteogenic differentiation when compared to FlatTi, and there was no significant difference between NT-G and NT with the same diameter. Therefore, nanotube modification and gentamicin loading can significantly improve the antibacterial ability and osteogenic activity of orthopedic implants.
Keywords: titania nanotubes, gentamicin, bacteria adhesion, biofilm formation, osteogenic activity
Introduction
Titanium (Ti) and its alloys have been widely applied for orthopedic implants because of their remarkable mechanical properties and biocompatibility; however, failure still occurs. Infection and aseptic loosening remain two major complications for orthopedic implants.1–3 In the United States, the most common causes of revision total knee arthroplasty were infection (25.2%) and implant loosening (16.1%) in 2006,2 and the annual infection rate for orthopedic implants is 4.3%.4 Whitehouse et al5 estimated that infections at orthopedic surgical sites prolong total hospital stays by a median of 2 weeks per patient, approximately double rehospitalization rates, and increase health care costs by more than 300%. Infection and aseptic loosening of implants usually occur because of poor integration with the surrounding bone tissue and bacterial contamination during the implant surgery. The competition for initial adhesion to the implant surface between bacteria and tissue cells (osteoblasts and their precursors) begins immediately after the insertion of the implant. Once the bacteria have colonized and formed a biofilm on the implant, tissue cells will have difficulty adhering and proliferating on the same surface. Therefore, the inhibition of bacterial colonization and prevention of infection can also be beneficial to the osseointegration of implants.
Administration of perioperative antibiotic prophylaxis is a routine procedure in orthopedic surgery to prevent infection.6,7 However, the limitations of systemic administration such as systemic toxicity may give rise to many complications. The most effective method to resolve this problem is to deliver antibacterial agents locally from the implant surface.8,9 Local controlled drug delivery will maintain the optimal concentrations of drugs at the specific site over prolonged periods without high systemic levels. Titania nanotubes (TNTs) fabricated on Ti implants via electrochemical anodization have attracted increasing attention because of their good biocompatibility and chemical and mechanical properties. The dimensions of nanotubes are controllable at a level that can mimic the dimensions of the constituent components of natural bone to enhance osteogenic activity. In addition, TNTs of properly controlled diameters and lengths can serve as carriers for antibacterial agents.10–14 Gentamicin is an aminoglycoside antibiotic that is widely used to prevent implant-related infections. Nanotubes loaded with gentamicin can deliver high levels of antibiotics locally to inhibit bacterial adhesion on an implant without causing systemic toxicity while maintaining excellent osseointegrative properties. Popat et al10,15 have loaded 80 nm diameter nanotubes with 200, 400, and 600 μg of gentamicin and demonstrated that the gentamicin eluted from the nanotubes significantly reduced bacterial adhesion on their surfaces, and osteoblast differentiation was also enhanced on nanotubes filled with gentamicin. They also demonstrated that 80 nm diameter nanotubes supported higher adhesion, proliferation, and osteogenic differentiation of marrow stromal cells compared to flat Ti surfaces. Gulati et al16 have fabricated nanotube structures on the surface of a Ti wire and loaded the 170 nm diameter nanotubes with gentamicin. They demonstrated that the drug eluting Ti wires could reduce bone infection. In this study, we further investigated and compared the antibacterial ability and osteogenic activity of gentamicin loaded (NT-G) and nonloaded nanotubes (NT) with four different diameters (80, 120, 160, and 200 nm).
A very large proportion of implant-related infections are caused by staphylococci (roughly four out of five), and two single staphylococcal species, Staphylococcus aureus and S. epidermidis, together account for two out of three infection isolates.17 Therefore, a standard strain, S. epidermidis (American Type Culture Collection [ATCC] 35984) and two clinical isolates, S. aureus 376 and S. epidermidis 389, were used in this study. In addition, human marrow derived mesenchymal stem cells (hMSCs) were cultured on NT and NT-G to evaluate the effect of nanotubular topographies on osteogenic cell functionality.
Materials and methods
Preparation of TNTs specimens
Prior to the electrochemical anodization treatment, pure Ti discs of 99.5% purity (10 mm in diameter and 1 mm in depth) were sonicated with acetone to remove surface oil pollution. Then, they were chemically polished in a mixed solution containing HNO3 and HF (V(HNO3):V(HF) = 1:1) for 60 seconds and cleaned with deionized water. The anodization process was performed in a conventional two electrode cell. Pure Ti discs served as the anode electrode and stainless steel discs served as the cathode electrode. The electrolyte consisted of 0.5% weight NH4F and 10% volume distilled water in ethylene glycol. After anodization for 1 hour at a constant voltage of 25 V, 40 V, 60 V, or 85 V, TNTs with length of 200 nm and diameters of 80, 120, 160, or 200 nm, respectively, were fabricated on the Ti discs. Afterward, the specimens were cleaned with deionized water and dried. All specimens were fabricated at room temperature. The surface morphologies of the TNTs with different diameters were studied using a scanning electron microscope (SEM). Flat Ti discs were used as a control in all the experiments. Both sides of the specimens were sterilized by ultraviolet irradiation before conducting the antibacterial and cell culture experiments.
Loading of the antibiotics
Gentamicin was loaded into the nanotubes using a lyophilization method and vacuum drying.10,18,19 Briefly, the TNT surfaces were cleaned with deionized water before loading. A gentamicin solution (Sigma-Aldrich, St Louis, MO, USA) of 100 mg/mL was prepared in phosphate-buffered saline (PBS). A volume of 5 μL of gentamicin solution was pipetted onto the nanotube surface and gently spread to ensure even coverage. The surfaces were then allowed to dry under vacuum at –45°C for 2 hours in freeze dry system (Labconco 7753072; Labconco Corp, Kansas City, MO, USA). After drying, the loading step was repeated until the nanotubes were loaded with 2 mg of gentamicin. After the final drying step, the surfaces were quickly rinsed by pipetting 1 mL of PBS over the surface to remove any excess drug. The rinse solutions were collected and stored for further analysis.
Characterization of drug release from TNTs
The release kinetics of the gentamicin from the nanotubes was determined as described in previous studies.10,20 Three discs of different diameter NT-G were each individually immersed in 1 mL of PBS in a 24-well plate at a temperature of 37°C with an agitation at 100 rpm. FlatTi in 1 mL of PBS was used as a parallel control. All the samples were taken after specific intervals to determine the release kinetics. Samples were collected periodically for up to 57 hours. The solution was replaced with 1 mL of fresh PBS every time samples were collected. The samples were analyzed for drug content using a colorimetric assay.20 Briefly, the o-phthaldialdehyde reagent was formulated by adding 2.5 g of o-phthaldialdehyde (Sigma-Aldrich), 62.5 mL of methanol (Sigma-Aldrich), and 3 mL of 2-mercaptoethanol (Sigma-Aldrich) to 560 mL of sodium borate (Sigma-Aldrich) in distilled water. The reagent was stored in a brown bottle in a dark chamber for at least 24 hours prior to use. The collected gentamicin solution, the o-phthaldialdehyde reagent, and isopropanol (to prevent the precipitation of any products formed) were mixed in equal proportions and incubated for 30 minutes at room temperature. In this assay, the o-phthaldialdehyde reacted with the amino groups of gentamicin to form chromophoric products, and the absorbance of these products was measured at 332 nm. A standard curve with known concentrations of gentamicin (Sigma-Aldrich) was used to determine the unknown concentrations.
Preparation and characterization of bacteria
S. epidermidis (ATCC 35984) was kindly provided by Di Qu (Laboratory of Medical Molecular Virology, Shanghai Medical College, Fudan University, Shanghai, People’s Republic of China). The clinical isolate S. aureus 376 and S. epidermidis 389 were kindly provided by Saïd Jabbouri (Université du Littoral Côte D’Opale, Boulognesur-Mer, France). These strains were stored at –80°C as glycerol stocks. The strains were propagated overnight on tryptone soy agar (TSA) medium at 37°C. A sterile 10 μL loop was used to withdraw bacteria colonies from the TSA, which were then inoculated into 10 mL of BBLTM TrypticaseTM soy broth (TSB, BD Biosciences, Franklin Lakes, NJ, USA) and cultured for approximately 16 hours on a shaker at 250 rpm and 37°C. Cells were then harvested by centrifugation (8,000 × g for 10 minutes). The minimum inhibiting concentrations (MICs) of gentamicin against ATCC 35984, S. aureus 376 and S. epidermidis 389 were determined by a microtiter broth dilution method as previously described.21–23 Our previous study demonstrated that the three tested strains were biofilm-producing bacterial strains.21,24
Bacterial adhesion assay using the spread plate method
Bacterial adhesion and biofilm formation on the specimens was investigated by the spread plate method, which has been described elsewhere.25,26 The inocula of the three strains were prepared by adjusting the concentration of an overnight bacterial broth culture to 1 × 10⁶ colony forming units (CFUs)/mL in TSB using McFarland standards. A volume of 1 mL of the suspension was added to a 48-well plate (Costar3548, Corning Incorporated, Corning, NY, USA) that contained FlatTi and different diameter NT and NT-G discs and was incubated at 37°C with agitation at 100 rpm for 4 hours. Then the specimens were removed with sterile forceps, placed into a fresh 24-well plate and gently washed with sterile PBS three times to remove loosely adherent bacteria. The specimens were then placed in 0.5 mL of TSB, and the adherent bacteria on the disc were dislodged by ultrasonication (5 minutes) in a 150 W ultrasonic bath (B3500S-MT, Branson Ultrasonics Co, Shanghai, People’s Republic of China) operating at a frequency of 50 Hz. The ultrasonication was followed by rapid vortex mixing (Vortex Genie 2, Scientific Industries Inc., Bohemia, NY, USA) at maximum power for 1 minute to remove bacteria that had adhered to the material. This method is known to be effective for removing biomaterial-adherent bacteria.27,28 The vortexed solutions were plated in triplicate onto TSA and then incubated at 37°C for 24 hours. The number of CFUs on the TSA was counted, the amount of bacteria adhesion on the substrates and in the biofilm was calculated and is expressed relative to the surface area of the sample (CFUs/mm2), and the TSA was photographed using a digital camera (Nikon D90; Nikon Corporation, Tokyo, Japan).
Biofilm formation assay using the tissue culture plate (TCP) method
The TCP assay method, which is considered the standard test to detect biofilm formation, has been described in the literature.29,30 In brief, the specimens were incubated with bacterial suspensions of 1 × 10⁶ CFUs/mL in TSB for 24 and 48 hours. Another plate containing TSB and the specimens was used as the negative control. The samples were gently washed with PBS three times to remove free floating planktonic bacteria. The biofilms formed on the specimens were dried at 60°C for 1 hour and stained at room temperature with 200 μL of a 0.1% (wt/vol) aqueous solution of crystal violet (CV) for 5 minutes. The samples were rinsed twice with deionized water to remove excess stain. After the samples were dried at 37°C for 2 hours, the biofilm formation was quantified by solubilization of the CV stain in 200 μL of 30% (wt/vol) glacial acetic acid for 10 minutes with agitation at 300 rpm. The CV concentration was determined using a Synergy HT multidetection microplate reader (BioTek, Winooski, VT, USA) at a wavelength of 492 nm.31 The mean absorbance obtained from the medium control well was deducted from the test absorbance values.
Observation of bacterial adhesion and biofilm formation using SEM
The specimens were incubated with bacterial suspensions of 1 × 10⁶ CFUs/mL in TSB for 4, 24, and 48 hours. The discs were gently washed three times with PBS. Then, the surfaces were fixed in 2.5% glutaraldehyde for 2 hours at 4°C, washed three times with cacodylate buffer, and dehydrated through a series of graded ethanol solutions (25, 50, 75, 95, and 100%) for 10 minutes each. Then, the surfaces were dried with hexamethyldisilazane (Polysciences, Warrington, PA, USA) for 10 minutes. The hexamethyldisilazane was removed, and the surfaces were air dried for 30 minutes. The samples were subsequently freeze dried, sputter coated with gold, and observed using a SEM (Joel JSM-6310LV, JEOL, Tokyo, Japan).
Observation of bacterial adhesion and biofilm formation using confocal laser scanning microscopy (CLSM)
The bacterial adhesion and biofilm formation were also observed using CLSM. The specimens were removed at three different time points and were gently washed three times with PBS. The samples were stained in a new 48-well plate with 300 μL of combination dye (LIVE/DEAD BacLight bacteria viability kits, L13152; Molecular Probes, Life Technologies, Carlsbad, CA, USA) and analyzed with a CLSM (Leica TCS SP2; Leica Microsystems, Wetzlar, Germany). The viable and nonviable cells can be distinguished under the fluorescence microscope because viable bacteria with intact cell membranes appear fluorescent green, whereas nonviable bacteria with damaged membranes appear fluorescent red. The images were acquired from random positions on the surfaces of the samples. In this study, we used ATCC 35984 for the CLSM and SEM observation assays.
Cell culture
hMSCs were cultured as described in our previous articles.24,32 In brief, cells were cultured in α-Modified Eagle’s Medium (α-MEM) culture medium supplemented with 10% fetal bovine serum (FBS) and 1% antibiotics (penicillin 100 U/mL, streptomycin sulphate 100 μg/mL; GibcoBRL, Life Technologies). The cells were incubated at 37°C in a humidified atmosphere of 5% CO2, and the growth medium was changed every 48 hours. When the culture grew to approximately 80% confluence, the hMSCs were detached with 0.25% trypsin and subcultured. The cells at passage 3 were used in the experiments.
Determination of cell attachment
FlatTi, NT, and NT-G were placed in 48-well plates (Costar3548) and the hMSCs were seeded at a density of 2 × 10⁴/well. Another plate containing the α-MEM culture medium and the specimens was used as a parallel control. After incubation at 6 and 12 hours at 37°C in a humidified atmosphere of 5% CO2 and 95% air, 100 μL of 3-(4,5-dimethylthiazol-2-yl)-2,5-diphenyltetrazolium bromide solution ([MTT] Sigma-Aldrich) was added to each well, and the plates were incubated at 37°C for 4 hours. Then the supernatant was discarded and 1 mL of dimethyl sulphoxide (Sigma-Aldrich) was added to the wells for 5 minutes to dissolve the formazan salts. The plates were read at 570 nm using an automated plate reader (Synergy HT multidetection microplate, BioTek). The mean absorbance obtained from the medium control well was determined from the test absorbance values. Similarly, at each time point, the attached cells were fixed and stained with 4′,6′-diamidino-2-phenylindole ([DAPI] Sigma-Aldrich). The cells were observed using a fluorescence microscope (Leica Microsystems).
Determination of cell proliferation
The hMSCs were seeded on the specimens placed in 24-well plates at a density of 5 × 10³ viable cells. Another plate containing the α-MEM culture medium and the specimens was used as a parallel control. After culturing for 1, 4, and 7 days, cell proliferation of the specimens was assessed using the MTT assay. In brief, at each time point, 100 μL of the MTT solution was added to each sample and incubated at 37°C for 4 hours. The formazan was then dissolved using dimethyl sulphoxide. The absorbance was measured at 570 nm. The mean absorbance obtained from the medium control well was determined from the test absorbance values.
Observation of cell morphology
The cell morphology of the hMSCs was investigated using CLSM. After culturing for 24 hours with the specimens as described above, the cells on the surfaces of the specimens were rinsed gently with PBS three times and the adherent cells were fixed with 3.7% formaldehyde for 15 minutes and then treated with 0.1% Triton X-100 for another 15 minutes. This was followed by staining the filamentous actin of the cytoskeleton in the hMSCs with Alexa Fluor 555 phalloidin (Molecular Probe, Sigma-Aldrich) for 1 hour, followed by staining the cell nuclei with DAPI for 10 minutes. The samples were rinsed gently with PBS before and after each step. The cell morphology and spreading were visualized using CLSM.
Determination of osteogenic differentiation of hMSCs
A volume of L mL of the cell suspension seeded on each specimen at a density of 3 × 10⁴ cells/mL was used to evaluate the effect of the different diameters of the NT and NT-G on the osteogenic differentiation. After culturing for 24 hours with the specimens, the medium was changed to the osteogenic induction medium: the α-MEM culture medium was supplemented with 10% FBS, 0.1 μM dexamethasone (Sigma-Aldrich), 50 μM ascorbate acid (Sigma-Aldrich), and 10 mM β-glycerophosphate sodium (Sigma-Aldrich). These media were renewed every 2 days throughout the study period.
Alkaline phosphatase (ALP) activity assay and ALP staining
After 7, 10, and 14 days of incubation with the osteogenic induction medium in a 48-well plate, the specimens were washed with PBS three times, and then lysed in a 0.2% Triton X-100 solution through four standard freeze thaw cycles. The ALP activity was determined following the procedures described in our previous article.33 The ALP activity in the lysis solution was determined through a colorimetric assay based on p-nitrophenyl phosphate. The intracellular total protein content was determined using a MicroBCA protein assay kit (Pierce Biotechnology, Thermo Fisher Scientific, Waltham, MA, USA) and the ALP activity was normalized to it. ALP staining was performed with an ALP staining kit (Renbao, Shanghai, People’s Republic of China) on day 7 and day 14. In brief, the cells were fixed with buffered formalin for 30 seconds, washed with distilled water two times, and then stained with a staining reagent for 45 minutes. Afterward, the specimens were washed three times with distilled water and then images were obtained using a scanner (Hewlett-Packard Scanjet 2400; Hewlett-Packard, Palo Alto, CA, USA).
Alizarin Red staining
After 21 and 28 days of osteogenic induction in 48-well plates, the specimens were washed with PBS three times and fixed in 3.7% formaldehyde for 1 hour. They were then incubated with a 1% Alizarin Red (Sigma-Aldrich) solution for 45 minutes at room temperature. The specimens were washed with distilled water until no more color appeared in the distilled water, and then images were obtained using a scanner (Hewlett-Packard Scanjet 2400, Hewlett-Packard).
Statistical analysis
All experiments were conducted in triplicate and repeated three times. The results are expressed as mean ± standard deviation. The one-way analysis of variance and least significant difference (LSD) post hoc tests were used to determine the level of significance; P<0.05 was defined as significant and P<0.01 was defined as highly significant. The statistical analyses were performed using SPSS software version 13.0.1 (SPSS Inc., Chicago, IL, USA).
Results
Morphological characterization of NT and NT-G
Figure 1 (first row) shows SEM images of TNTs with different diameters (80, 120, 160, and 200 nm). As described above, the diameter of nanotubes can be controlled by altering the anodization parameters. In this study, we used anodization voltages of 25 V, 40 V, 60 V, or 85 V to fabricate nanotubes with length of 200 nm and diameters of 80 nm, 120 nm, 160 nm, or 200 nm, respectively. Figure 1 (second row) shows SEM images of four different diameter nanotubular surfaces loaded with gentamicin. The surfaces of the drug-loaded specimens retain the nanotubular structure with gentamicin incorporated into the nanotubes.
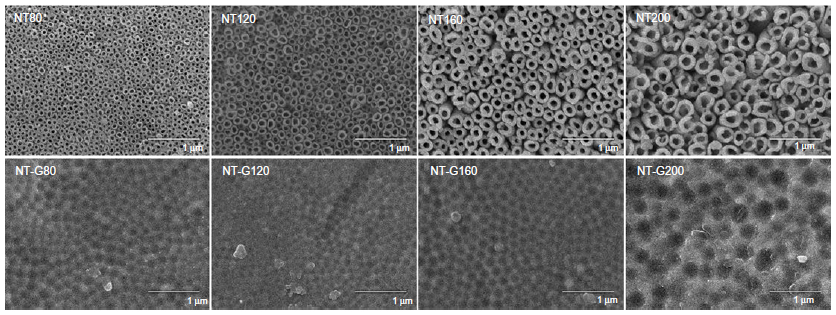 | Figure 1 Morphological characterization of different diameter nanotubular surfaces using scanning electron microscopy (first row) and drug-loaded nanotubular surfaces (second row). |
Loading efficiency of gentamicin in different diameter nanotubes
In this study, gentamicin was loaded into nanotubes using a lyophilization method and vacuum drying. The nanotubes were filled with 2 mg of gentamicin using the procedure described above. Prior to the drug release assay, the loading efficiency of the gentamicin in the nanotubes was evaluated.10 The concentrations of the rinse solutions were measured by the previously described colorimetric assay. The loading efficiency was calculated from the formula η = (mo - mr)/mo, where η is the loading efficiency, mo is the amount of gentamicin loaded in the nanotubes (2 mg), and mr is the amount of gentamicin in the rinse solution. Figure 2A shows the loading efficiencies of different diameter NT-G. The results indicate that approximately 75%–80% of the gentamicin is retained in the nanotubes after the initial wash. The loading efficiency of NT-G200 was higher than that of NT-G80 or NT-G120 (P<0.05).
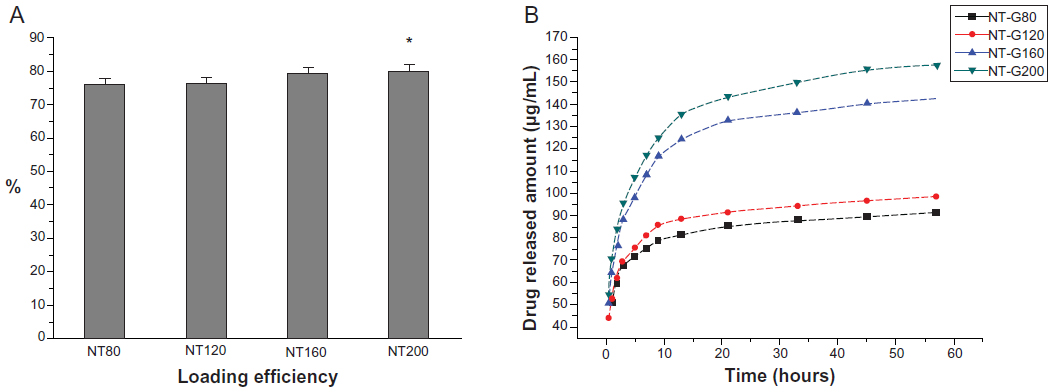 | Figure 2 Loading efficiency and drug release profiles of gentamicin. |
Gentamicin release from the nanotubes
Figure 2B shows the drug release from different diameter nanotubes, which is expressed in μg/mL. There is higher sustained drug release from the nanotubes with larger diameters (160 nm or 200 nm) than from those with smaller diameters (80 nm or 120 nm). The majority of the gentamicin was released from NT-G80 and NT-G120 after approximately 9 hours and from NT-G160 and NT-G200 after approximately 21 hours. After a high initial release, the amount of gentamicin eluted from the nanotubes remained nearly constant. As shown in Table 1, the initial release of gentamicin from NT-G80, NT-G120, NT-G160, and NT-G200 was 79.01, 85.96, 132.98, and 143.51 μg, respectively. However, the results indicate that a large proportion of the gentamicin was not eluted from the nanotubes.
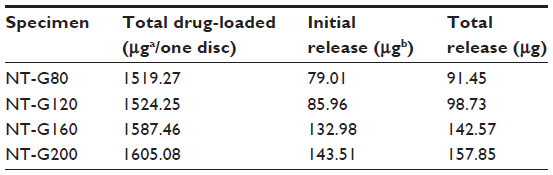 | Table 1 The initial and total release of gentamicin in 57 hours |
The MIC of the bacterial strains
As shown in Table 2, S. epidermidis 389 was susceptible to the gentamicin (MIC =0.125 μg/mL), while ATCC 35984 and S. aureus 376 exhibited a low level of susceptibility to the gentamicin (MIC =16 μg/mL and 8 μg/mL, respectively).
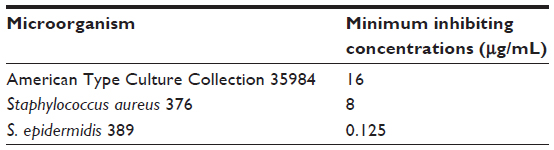 | Table 2 The minimum inhibiting concentrations of the three tested strains |
Inhibition of bacterial adhesion and biofilm formation on NT and NT-G
The number of viable bacteria adhered to the nanotubes at the 4 hour time point was determined by the spread plate method. As shown in Figure 3, the number of living bacteria of the three tested strains on the surface of the NT-G was significantly lower than on the FlatTi or NT (P<0.01), and no difference was observed among NT-G80, NT-G120, NT-G160, and NT-G200 (P>0.05). The number of living bacteria on the surface of the NT was significantly lower than on the FlatTi (P<0.01), and the numbers on NT80 and NT120 were significantly lower than on NT160 and NT200 (P<0.01). There was no difference between NT80 and NT120 or between NT160 and NT200.
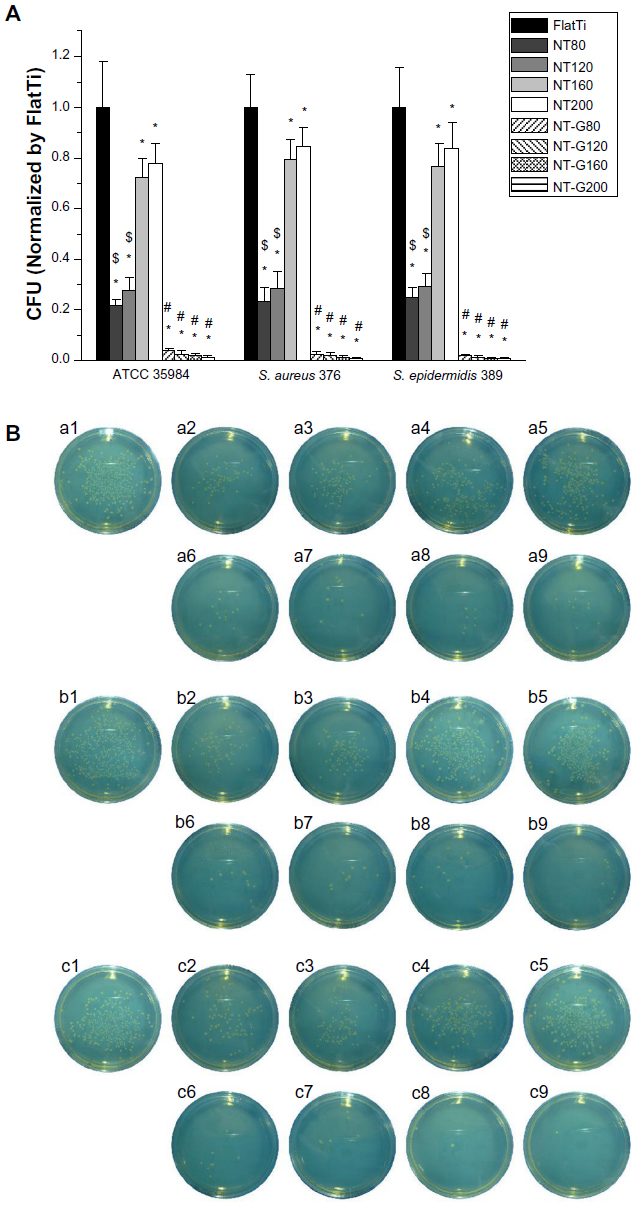 | Figure 3 The number of viable bacteria adhered on the flat titanium, nanotubes with no drug loading, and gentamicin-loaded nanotubes surfaces at 4 hours. |
The biofilm formation of the three tested strains on the specimens was assessed by CV staining using the TCP method. As shown in Figure 4A and B, it can be observed that the A492 values of ATCC 35984 and S. aureus 376 on NT-G were significantly lower than on FlatTi and NT at the 24 and 48 hour time points (P<0.01) which indicates almost no biofilm formation on NT-G surfaces. Similar to the bacterial adhesion results from the spread plate assay, there was no difference among NT-G80, NT-G120, NT-G160, and NT-G200 at the 24 hour time point (P>0.05), and the A492 values of bacteria on NT-G80 and NT-G120 were higher than on NT-G160 and NT-G200 at the 48 hour time point (P<0.01). Figure 4C shows that the A492 values of S. epidermidis 389 on NT-G were significantly lower compared to FlatTi and NT at the two time points (P<0.01), and no difference can be observed among NT-G samples with different diameters (P>0.05). In addition, the A492 values of the three tested strains on NT were significant lower than on FlatTi at the 24 and 48 hour time points (P<0.01), and the A492 values of bacteria on NT80 and NT120 were lower than NT160 and NT200 (P<0.01), indicating less biofilm formation on NT80 or NT120. There was no difference in biofilm formation between NT80 and NT120 or between NT160 and NT200.
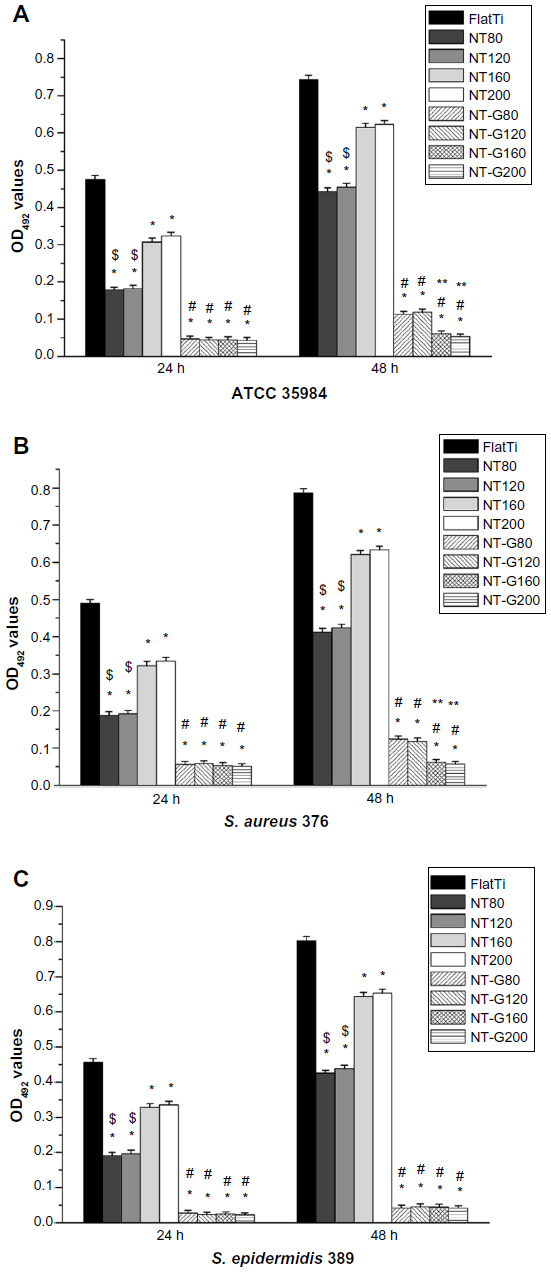 | Figure 4 Biofilm formation of the three bacterial strains. |
SEM and CLSM observation
Bacterial adhesion and biofilm formation on the surfaces of the FlatTi, NT, and NT-G were observed using SEM and CLSM at the 4, 24, and 48 hour time points. In this study, we only evaluated the ATCC 35984 using SEM and CLSM.
As shown in the SEM images in Figure 5, there were a few single bacterial colonies scattered on the surfaces of NT-G80 and NT-G120 at the 4 and 24 hour time points (a6, a7, b6, b7) and on the surfaces of NT-G160 and NT-G200 at the three time points (a6, a7, b6, b7, c6, c7). The colonies on the NT-G80 and NT-G120 surfaces were more obvious than those on NT-G160 and NT-G200 at the 48 hour time point. In contrast, it can be observed that many multiple bacterial colonies formed colony masses on the surfaces of the FlatTi, NT160, and NT200 at 24 and 48 hours (b1, b4, b5, c1, c4, c5) and on the surfaces of NT80 and NT120 at the 48 hour time point (c2, c3). Additionally, at the 4 hour time point, there were fewer bacterial colonies on NT80 and NT120 (a2, a3) than on NT160 and NT200 (a4, a5) and significantly fewer than on FlatTi.
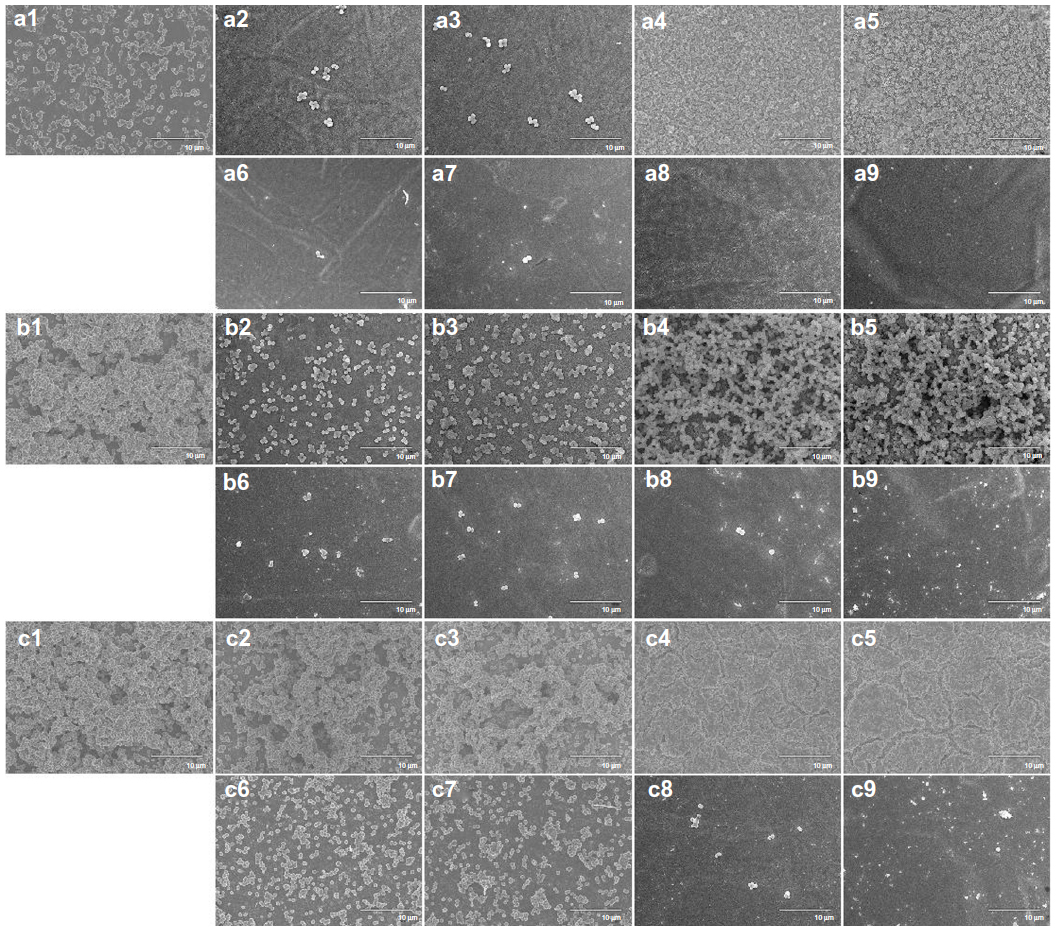 | Figure 5 Scanning electron microscope images of American Type Culture Collection 35984 adhesion and biofilm formation on different surfaces. |
In the CLSM images in Figure 6, we can observe an intense fluorescence on the surface of the FlatTi at 24 and 48 hours (b1, c1) and on the surfaces of NT160 and NT200 (c4, c5) at 48 hours, which indicates significant biofilm formation. A less intense fluorescence was found on the surfaces of NT160 and NT200 at the 24 hour time point (b4, b5), and on NT80 and NT120 at the 48 hour time point (c2, c3), which indicated a low level of biofilm formation. The bacterial colonies were sparsely distributed on the surface of NT-G80 and NT-G120 at 4 and 24 hours (a6, a7, b6, b7) and on the surfaces of NT-G160 and NT-G200 at 4, 24, and 48 hours (a8, a9, b8, b9, c8, c9), which indicates no biofilm formation. Similar to the results of the SEM observations, there were fewer bacterial colonies on the surfaces of NT80 and NT120 compared to those of NT160, NT200, and FlatTi.
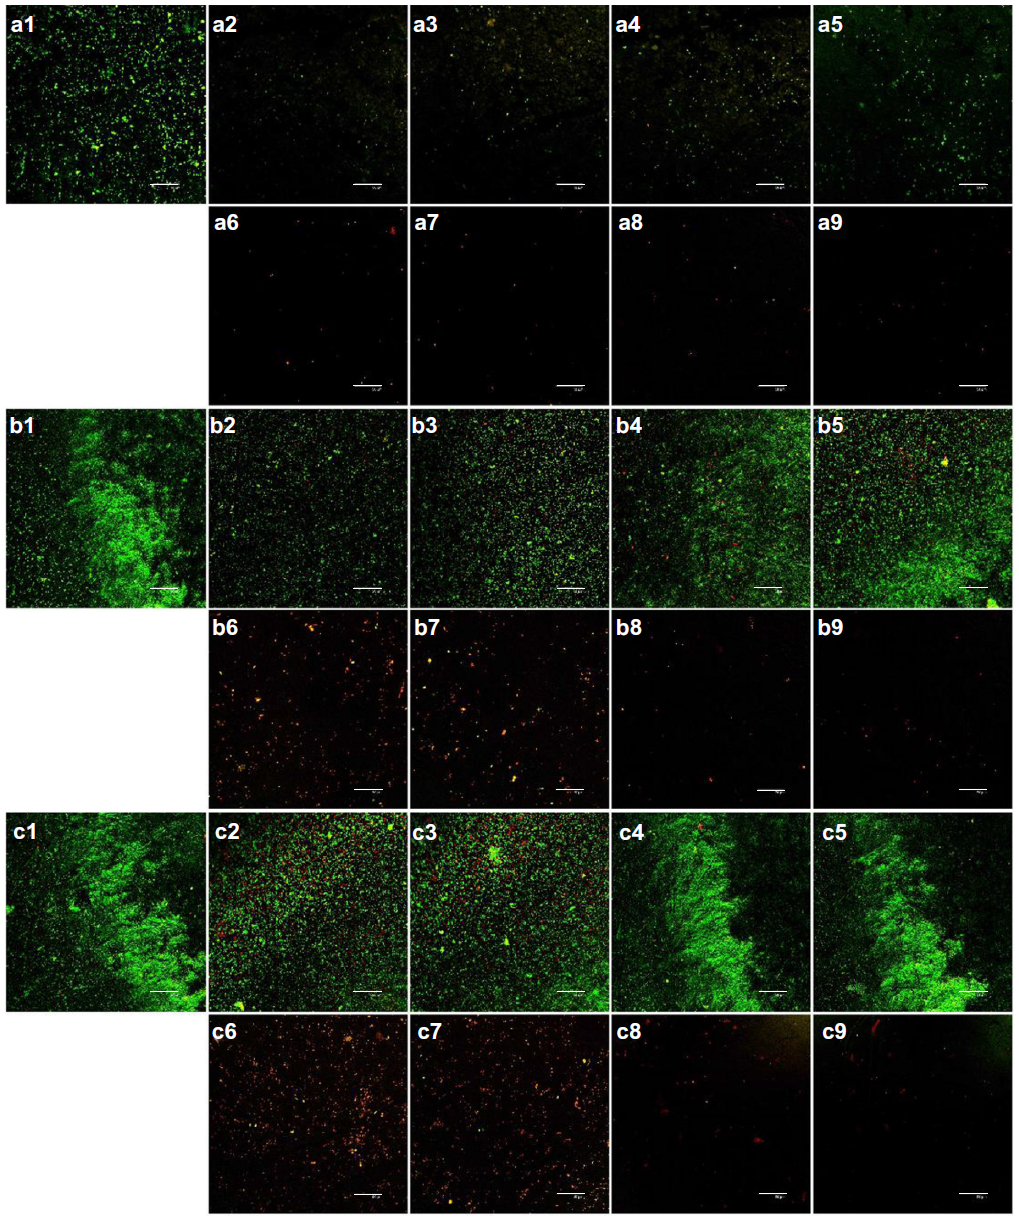 | Figure 6 Confocal laser scanning microscopy analysis of bacterial viability on different surfaces. |
Attachment and proliferation of hMSCs
Cell adhesion and proliferation were measured by the MTT assay. As shown in Figure 7A, the numbers of adherent cells on the surfaces of the NT and NT-G were significantly higher than those on the FlatTi at the 6 and 12 hour time points (P<0.01). No significant difference could be found among NT80, NT120, NT160, and NT200 at the 6 hour time point. The numbers of cells adherent on NT80 and NT120 were significantly higher than those on NT160 and NT200 at the 12 hour time point (P<0.05). There is no statistically significant difference between the NT and the NT-G with the same diameter. Figure 7B shows that the numbers of cells stained with DAPI on the surfaces of the NT, NT-G, and FlatTi after 6 and 12 hours of incubation were consistent with the results described previously. In Figure 7C, it can be seen that the cells on the FlatTi exhibited an obviously lower proliferation rate than those on the NT and NT-G at various time points (P<0.01). The cells on NT80 and NT120 showed higher proliferation rates when compared with those on NT160 and NT200 at day 4 and day 7 (P<0.05). The cell proliferation rate on NT80 and NT120 increased dramatically compared to NT160 and NT200 at day 7 (P<0.05). Similar to the case of the cell attachment, no statistically significant difference was found between the NT and the NT-G with the same diameter.
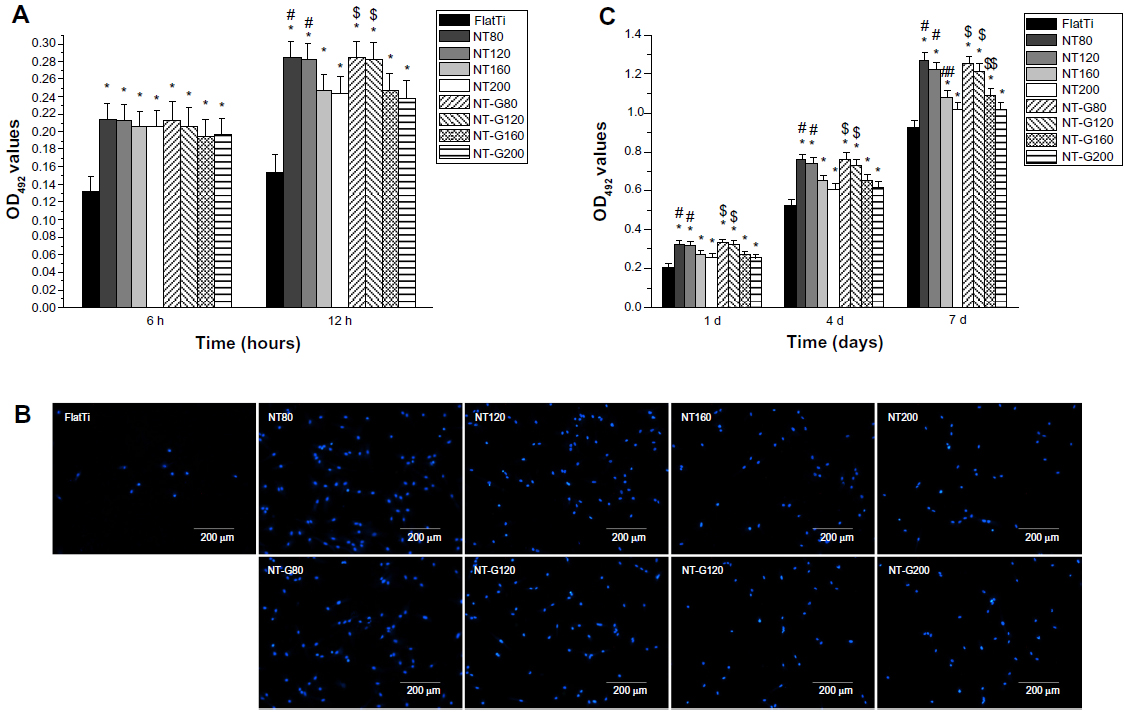 | Figure 7 Attachment and proliferation of the human marrow derived mesenchymal stem cells on the surfaces of various specimens. |
Cell morphology of hMSCs
Figure 8 shows that the hMSCs displayed significantly different shapes on the surface of the FlatTi and on the nanosurfaces (NT and NT-G). The cells on the nanotube surfaces displayed polygonal and clustering morphology. In contrast, the cells on the FlatTi exhibited a spindle and spherical morphology and spread poorly. The spreading of the cells on NT80 and NT120 was more extended than that on NT160 and NT200. The cells on the NT-G exhibited a similar spreading profile to those on the NT of the same diameter. In addition, the cell densities on the surfaces of the 80 and 120 nm nanotubes were higher than those on the 160 and 200 nm nanotubes and the FlatTi.
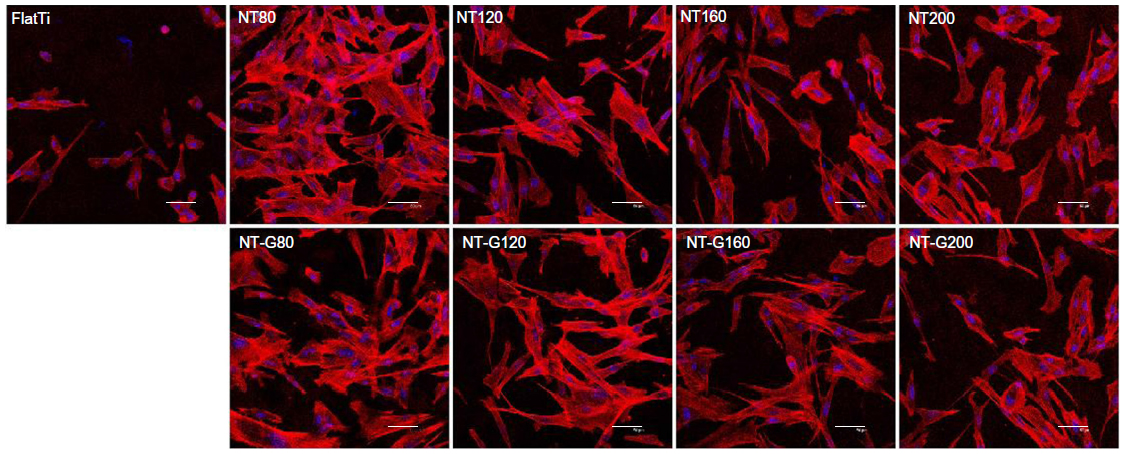 | Figure 8 Representative images of the human marrow derived mesenchymal stem cells stained with rhodamine phalloidin for the actin filaments (red) and nuclei counterstained with DAPI (blue). |
Osteogenic differentiation of hMSCs
As shown in Figure 9A, the ALP activity (normalized by the total protein amounts) of the hMSCs on the NT was significantly higher than that of those on the FlatTi at three different time points (P<0.01), and the ALP activity levels of the cells on NT80 and NT120 were significantly higher than those of the cells cultured on NT160 and NT200 (P<0.01). No differences were observed between NT80 and NT120 or between NT160 and NT200 at day 7 (P>0.05). However, the ALP activity level on NT160 was significantly higher than that on NT200 at day 10 and day 14 (P<0.01), and NT80 had a significantly higher ALP activity level compared to that of on NT120 (P<0.01). The results of the NT were not significantly different to those of the NT-G with the same diameter. Figure 9B shows the ALP staining on NT, NT-G, and on the FlatTi at day 7 and day 14. It can be observed that the staining on both the drug-loaded and nonloaded nanotubes with diameters of 80 nm or 120 nm was denser than that on the FlatTi and nanotubes with diameters of 160 nm or 200 nm. Additionally, similar weak staining was found on NT200, NT-G200, and FlatTi.
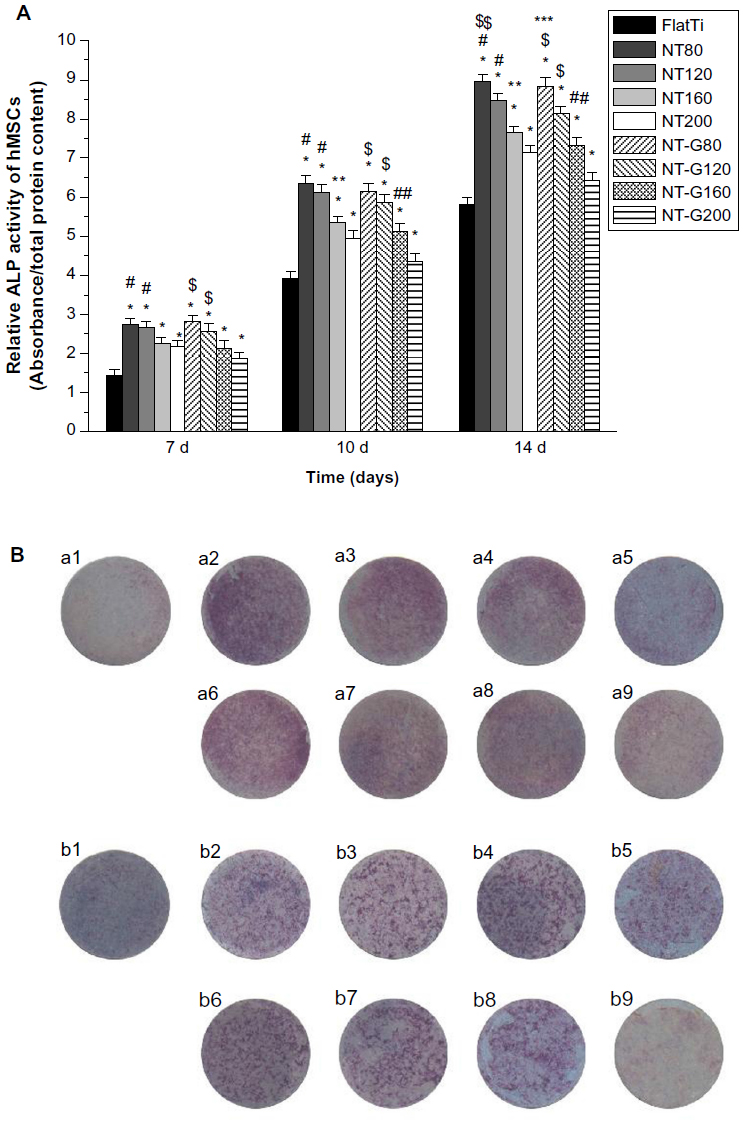 | Figure 9 The alkaline phosphatase activity assay and alkaline phosphatase staining. |
The extracellular matrix mineralization was assessed by Alizarin Red staining. Figure 10 shows the Alizarin Red staining on the FlatTi, NT, and NT-G at day 21 and day 28. It was also found that the calcium deposits on both drug-loaded and nonloaded nanotubes with diameters of 80 nm or 120 nm were more obvious than those on FlatTi and nanotubes with diameter of 160 nm or 200 nm.
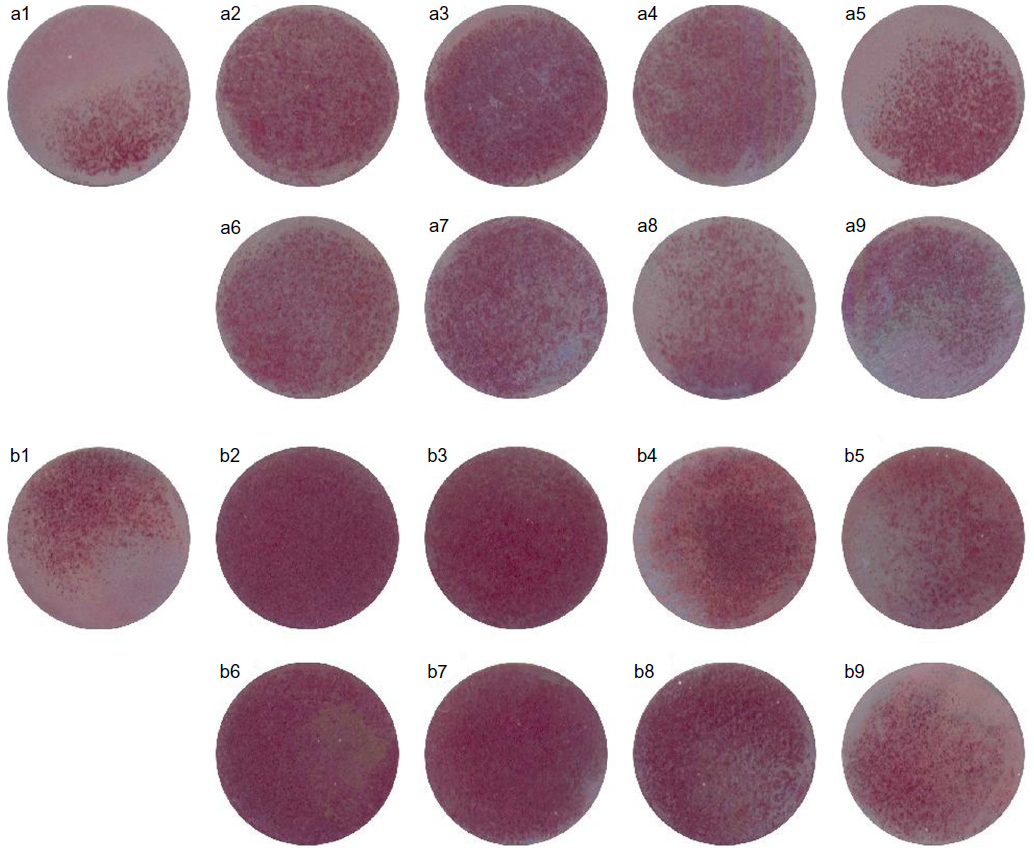 | Figure 10 Representative images of Alizarin Red staining on different surfaces.Notes: (1) Flat titanium, (2) NT80, (3) NT120, (4) NT160, (5) NT200, (6) NT-G80, (7) NT-G120, (8) NT-G160, and (9) NT-G200 after incubation for (a) 21 and (b) 28 days. |
Discussion
As described previously, the local delivery of antibiotics has many advantages when compared to systemic administration for the prevention of implant-associated infection. In this study, we filled nanotubes with gentamicin using a lyophilization method and vacuum drying to achieve local drug delivery. We fabricated TNTs with various diameters using electrochemical anodization to investigate the antibacterial ability and osteogenic activity of different diameter NT and NT-G. Popat et al10 demonstrated slower and sustained release from 80 nm nanotubes loaded with a larger amount of drug when compared to those loaded with lower amounts. They filled nanotubes of 80 nm in diameter and 400 nm in length with 200, 400, and 600 μg of gentamicin, and all the drug eluted within 45, 90, and 150 minutes, respectively. Therefore, to extend the drug release time, we fabricated TNTs with larger diameters and filled them with a larger amount of gentamicin (2 mg). Our results showed that the initial drug release time of the smaller diameter nanotubes (NT-G80 and NT-G120) was extended to approximately 9 hours, and that of the larger diameter nanotubes (NT-G160 and NT-G200) was extended to approximately 21 hours. The total amounts of gentamicin released from NT-G80, NT-G120, NT-G160, and NT-G200 over 57 hours were 91.45, 98.73, 142.57, and 157.85 μg, respectively, which were all above the MICs of the three tested strains (16 μg/mL for ATCC 35984, 8 μg/mL for S. aureus 376, and 0.125 μg/mL for S. epidermidis 389). Although a large proportion of gentamicin was not eluted and remained in the nanotubes, we believe that the released gentamicin is sufficient to inhibit the initial adhesion of bacteria. The initial adhesion of bacteria to biomaterial surfaces is believed to be the critical event for the pathogenesis of foreign body infections.34–36 A postimplantation period of 6 hours has been identified as the “decisive period,” and the prevention of bacterial adhesion is critical to the long term success of an implant.4,37,38 As shown in Figure 3, an initial burst of release appeared for all four groups of NT-G. The high initial concentrations of released gentamicin could efficiently kill the bacteria already present on the implants during the operation efficiently.
Biofilm formation involves several steps, beginning with bacterial attachment onto the surface and followed by the synthesis of extracellular polymeric substances by the attached bacteria and aggregation into microcolonies which evolve into a three dimensional matrix with channels.37–39 In this study, we investigated the bacterial adhesion, microcolonies, and biofilm formation on NT and NT-G at three different time points using the spread plate method, CV staining, SEM, and CLSM. Our results demonstrated that there were far more bacterial colonies on the FlatTi at 4 hours and obvious biofilm formation at 24 and 48 hours for all tested strains when compared to the NT and NT-G. It also could be seen that the NT-G more efficiently inhibited bacterial adhesion and biofilm formation on its surface over 48 hours when compared to the NT. For ATCC 35984 and S. aureus 376, the numbers of viable colonies on NT-G160 and NT-G200 were significantly lower than those on the NT-G80 and NT-G120 surfaces at 48 hours. These results indicate that for NT-G, the larger the diameters of the nanotubes were, the stronger the antibacterial activity would be, because of the extended drug release time of the NT-G with larger diameters.
Interestingly, our results showed that nanotubes with no drug loading also could inhibit bacterial adhesion and biofilm formation to some extent, as NT80 and NT120 had fewer viable bacteria colonies adhered to their surfaces when compared to NT160 and NT200. Ercan et al42 investigated the antibacterial efficacy of Ti nanotubes with diameters of 20, 40, 60, 80 nm. They demonstrated that nanotubular structures (except those of 20 nm in diameter) could reduce the number of live bacteria adhering to the surface, and for larger diameters (40–80 nm), fewer living bacteria were observed on the surfaces. In a previous study, we compared TiO2 nanotube arrays with 30 and 80 nm diameters to mechanically polished Ti and acid etched Ti.41 We found that the initial adhesion and growth of S. epidermidis on the surfaces of the TiO2 nanotube arrays were inhibited, especially on the 80 nm TiO2 nanotube arrays. Therefore, we can conclude that nanotubes with no antibiotics have moderate antibacterial activity.
Poor bone tissue integration will impair the stability of orthopedic implants in the body. The osteogenic activity of the implant surface plays an important role in implant osseointegration. In this study, we investigated the attachment, proliferation, spreading, and osteogenic differentiation of hMSC on nanotubular topographies with diameters of 80, 120, 160, and 200 nm. Our results indicated that the nanotubular surface promoted cell attachment when compared to FlatTi, and the number of adherent cells on the smaller diameter nanotubes (NT80 and NT120) were higher than those on the larger diameter ones (NT160 and NT200) at the 12 hour time point, but no obvious differences were found among NT of different diameters at the 6 hour time points. A dramatically increased cell proliferation rate on the nanotubular surface at the various time points was also found in our results. Similar to the case of the cell attachment, the cell proliferation rates on NT80 and NT120 were significantly higher than those on NT160 and NT200 at the three time points. Our results also demonstrated that hMSCs spread better on the NT when compared to FlatTi. In addition, there was no obvious difference between the NT and the NT-G in cell attachment, proliferation, and spreading which indicates that the gentamicin released from the nanotubes had no adverse effect on the functions of the hMSCs.
In this study, we also determined the ALP activity and observed ALP staining and Alizarin Red staining to evaluate the effect of nanotubular surfaces with different diameters on the osteogenic differentiation of hMSCs. Our results demonstrated that the NT and NT-G significantly increased the ALP activity and matrix mineralization when compared to FlatTi, and osteogenic differentiation decreased as the diameters of the nanotubes increased. Therefore, we can conclude from the above results that nanotubular surfaces, especially NT80 and NT-G80, strikingly promote the osteogenic differentiation of hMSCs.
Conclusion
This in vitro study demonstrated that NT-G could dramatically inhibit bacterial adhesion and biofilm formation on the nanotube surface, while nanotubes with no drug loading also present moderate antibacterial ability. Nanotubes also significantly promote stem cell attachment, proliferation, spreading, and osteogenic differentiation, and the gentamicin released from the nanotubes had no adverse effect on the functions of the hMSCs. Thus, nanotube based local delivery of antibiotics is an attractive strategy for combating implant-associated infection.
Acknowledgments
This research was financially supported by the National Natural Science Foundation of China (No 31271015), the Shanghai Science and Technology Development Fund (13JC1403900), and the continuing support program for the Shu-guang scholars of the Shanghai Municipal Education Commission.
Disclosure
The authors report no conflicts of interest in this work.
References
Clohisy JC, Calvert G, Tull F, McDonald D, Maloney WJ. Reasons for revision hip surgery: a retrospective review. Clin Orthop Relat Res. 2004;429(429):188–192. | |
Bozic KJ, Lau E, Chiu V, Vail TP, Rubash HE, Berry DJ. The epidemiology of revision total knee arthroplasty in the United States. Clin Orthop Relat Res. 2010;468(1):45–51. | |
Puckett SD, Taylor E, Raimondo T, Webster TJ. The relationship between the nanostructure of titanium surfaces and bacterial attachment. Biomaterials. 2010;31(4):706–713. | |
Hetrick EM, Schoenfisch MH. Reducing implant-related infections: active release strategies. Chem Soc Rev. 2006;35(9):780–789. | |
Whitehouse JD, Friedman ND, Kirkland KB, Richardson WJ, Sexton DJ. The impact of surgical-site infections following orthopedic surgery at a community hospital and a university hospital: adverse quality of life, excess length of stay, and extra cost. Infect Control Hosp Epidemiol. 2002;23(4):183–189. | |
Lucke M, Wildemann B, Sadoni S, et al. Systemic versus local application of gentamicin in prophylaxis of implant-related osteomyelitis in a rat model. Bone. 2005;36(5):770–778. | |
Esposito S, Leone S. Prosthetic joint infections: microbiology, diagnosis, management and prevention. Int J Antimicrob Agents. 2008;32(4):287–293. | |
Zhao L, Chu PK, Zhang Y, Wu Z. Antibacterial coatings on titanium implants. J Biomed Mater Res B Appl Biomater. 2009;91(1):470–480. | |
Tran N, Tran PA. Nanomaterial-based treatments for medical device-associated infections. Chem Phys Chem. 2012;13(10):2481–2494. | |
Popat KC, Eltgroth M, LaTempa TJ, Grimes CA, Desai TA. Decreased Staphylococcus epidermis adhesion and increased osteoblast functionality on antibiotic-loaded titania nanotubes. Biomaterials. 2007;28(32):4880–4888. | |
Aninwene GE, II CY, Webster TJ. Enhanced osteoblast adhesion to drug-coated anodized nanotubular titanium surfaces. Int J Nanomedicine. 2008;3(2):257–264. | |
Zhao L, Wang H, Huo K, et al. Antibacterial nano-structured titania coating incorporated with silver nanoparticles. Biomaterials. 2011;32(24):5706–5716. | |
Huo K, Zhang X, Wang H, Zhao L, Liu X, Chu PK. Osteogenic activity and antibacterial effects on titanium surfaces modified with Zn-incorporated nanotube arrays. Biomaterials. 2013;34(13):3467–3478. | |
Cheng H, Li Y, Huo K, Gao B, Xiong W. Long-lasting in vivo and in vitro antibacterial ability of nanostructured titania coating incorporated with silver nanoparticles. J Biomed Mater Res A. 2013;00A:000–000. | |
Popat KC, Leoni L, Grimes CA, Desai TA. Influence of engineered titania nanotubular surfaces on bone cells. Biomaterials. 2007;28(21):3188–3197. | |
Gulati K, Aw MS, Losic D. Drug-eluting Ti wires with titania nanotube arrays for bone fixation and reduced bone infection. Nanoscale Res Lett. 2011;6(1):1–6. | |
Campoccia D, Montanaro L, Arciola CR. The significance of infection related to orthopedic devices and issues of antibiotic resistance. Biomaterials. 2006;27(11):2331–2339. | |
Foraker AB, Walczak RJ, Cohen MH, Boiarski TA, Grove CF, Swaan PW. Microfabricated porous silicon particles enhance paracellular delivery of insulin across intestinal Caco-2 cell monolayers. Pharm Res. 2003;20(1):110–116. | |
Salonen J, Laitinen L, Kaukonen A, et al. Mesoporous silicon microparticles for oral drug delivery: loading and release of five model drugs. J Control Release. 2005;108(2–3):362–374. | |
Frutos Cabanillas P, Diez Pena E, Barrales-Rienda JM, Frutos G. Validation and in vitro characterization of antibiotic-loaded bone cement release. Int J Pharm. 2000;209(1–2):15–26. | |
Peng ZX, Tu B, Shen Y, et al. Quaternized chitosan inhibits icaA transcription and biofilm formation by Staphylococcus on a titanium surface. Antimicrob Agents Chemother. 2011;55(2):860–866. | |
Cole AM, Weis P, Diamond G. Isolation and characterization of pleurocidin, an antimicrobial peptide in the skin secretions of winter flounder. J Biol Chem. 1997;272(18):12008–12013. | |
Beckloff N, Laube D, Castro T, et al. Activity of an antimicrobial peptide mimetic against planktonic and biofilm cultures of oral pathogens. Antimicrob Agents Chemother. 2007;51(11):4125–4132. | |
Tan H, Guo S, Yang S, Xu X, Tang T. Physical characterization and osteogenic activity of the quaternized chitosan-loaded PMMA bone cement. Acta Biomater. 2012;8(6):2166–2174. | |
van de Belt H, Neut D, Schenk W, van Horn JR, van der Mei HC, Busscher HJ. Staphylococcus aureus biofilm formation on different gentamicin-loaded polymethylmethacrylate bone cements. Biomaterials. 2001;22(12):1607–1611. | |
Dunne N, Hill J, Mcafee P, et al. In vitro study of the efficacy of acrylic bone cement loaded with supplementary amounts of gentamicin: effect on mechanical properties, antibiotic release, and biofilm formation. Acta Orthop. 2007;78(6):774–785. | |
Sherertz RJ, Raad, II, Belani A, et al. Three-year experience with sonicated vascular catheter cultures in a clinical microbiology laboratory. J Clin Microbiol. 1990;28(1):76–82. | |
Bjerkan G, Witsø E, Bergh K. Sonication is superior to scraping for retrieval of bacteria in biofilm on titanium and steel surfaces in vitro. Acta Orthop. 2009;80(2):245–250. | |
Christensen GD, Simpson WA, Younger JJ, et al. Adherence of coagulase-negative staphylococci to plastic tissue culture plates: a quantitative model for the adherence of staphylococci to medical devices. J Clin Microbiol. 1985;22(6):996–1006. | |
Mathur T, Singhal S, Khan S, Upadhyay D, Fatma T, Rattan A. Detection of biofilm formation among the clinical isolates of staphylococci: an evaluation of three different screening methods. Indian J Med Microbiol. 2006;24(1):25. | |
Greco C, Martincic I, Gusinjac A, Kalab M, Yang AF, Ramirez-Arcos S. Staphylococcus epidermidis forms biofilms under simulated platelet storage conditions. Transfusion. 2007;47(7):1143–1153. | |
Peng Z, Wang L, Du L, Guo S, Wang X, Tang T. Adjustment of the antibacterial activity and biocompatibility of hydroxypropyltrimethyl ammonium chloride chitosan by varying the degree of substitution of quaternary ammonium. Carbohydr Polym. 2010;81(2):275–283. | |
Sun H, Wu C, Dai K, Chang J, Tang T. Proliferation and osteoblastic differentiation of human bone marrow-derived stromal cells on akermanite-bioactive ceramics. Biomaterials. 2006;27(33):5651–5657. | |
Gristina AG, Hobgood CD, Webb LX, Myrvik QN. Adhesive colonization of biomaterials and antibiotic resistance. Biomaterials. 1987;8(6):423–426. | |
Park KD, Kim YS, Han DK, et al. Bacterial adhesion on PEG modified polyurethane surfaces. Biomaterials. 1998;19(7–9):851–859. | |
Harris L, Tosatti S, Wieland M, Textor M, Richards R. Staphylococcus aureus adhesion to titanium oxide surfaces coated with non-functionalized and peptide-functionalized poly(L-lysine)-grafted-poly(ethylene glycol) copolymers. Biomaterials. 2004;25(18):4135–4148. | |
Poelstra KA, Barekzi NA, Rediske AM, Felts AG, Slunt JB, Grainger DW. Prophylactic treatment of gram-positive and gram-negative abdominal implant infections using locally delivered polyclonal antibodies. J Biomed Mater Res A. 2002;60(1):206–215. | |
Neoh KG, Hu X, Zheng D, Kang ET. Balancing osteoblast functions and bacterial adhesion on functionalized titanium surfaces. Biomaterials. 2012;33(10):2813–2822. | |
Trampuz A, Osmon DR, Hanssen AD, Steckelberg JM, Patel R. Molecular and antibiofilm approaches to prosthetic joint infection. Clin Orthop Relat Res. 2003;414:69–88. | |
Schachter B. Slimy business – the biotechnology of biofilms. Nat Biotechnol. 2003;21(4):361–365. | |
Arciola CR, Campoccia D, Speziale P, Montanaro L, Costerton JW. Biofilm formation in Staphylococcus implant infections. A review of molecular mechanisms and implications for biofilm-resistant materials. Biomaterials. 2012;33(26):5967–5982. | |
Ercan B, Taylor E, Alpaslan E, Webster TJ. Diameter of titanium nanotubes influences anti-bacterial efficacy. Nanotechnology. 2011;22(29):295102. | |
Peng Z, Ni J, Zheng K, et al. Dual effects and mechanism of TiO2 nanotube arrays in reducing bacterial colonization and enhancing C3H10T1/2 cell adhesion. Int J Nanomedicine. 2013;8:3093–3105. |
 © 2014 The Author(s). This work is published and licensed by Dove Medical Press Limited. The full terms of this license are available at https://www.dovepress.com/terms.php and incorporate the Creative Commons Attribution - Non Commercial (unported, v3.0) License.
By accessing the work you hereby accept the Terms. Non-commercial uses of the work are permitted without any further permission from Dove Medical Press Limited, provided the work is properly attributed. For permission for commercial use of this work, please see paragraphs 4.2 and 5 of our Terms.
© 2014 The Author(s). This work is published and licensed by Dove Medical Press Limited. The full terms of this license are available at https://www.dovepress.com/terms.php and incorporate the Creative Commons Attribution - Non Commercial (unported, v3.0) License.
By accessing the work you hereby accept the Terms. Non-commercial uses of the work are permitted without any further permission from Dove Medical Press Limited, provided the work is properly attributed. For permission for commercial use of this work, please see paragraphs 4.2 and 5 of our Terms.