")
Back to Journals » Vascular Health and Risk Management » Volume 11
Indirect and direct costs of acute coronary syndromes with comorbid atrial fibrillation, heart failure, or both
Authors Ghushchyan V, Nair K, Page II R
Received 6 August 2014
Accepted for publication 2 October 2014
Published 24 December 2014 Volume 2015:11 Pages 25—34
DOI https://doi.org/10.2147/VHRM.S72331
Checked for plagiarism Yes
Review by Single anonymous peer review
Peer reviewer comments 2
Editor who approved publication: Dr Daniel Duprez
Vahram Ghushchyan,1,2 Kavita V Nair,2 Robert L Page II2,3
1College of Business and Economics, American University of Armenia, Yerevan, Armenia; 2Department of Clinical Pharmacy, Skaggs School of Pharmacy and Pharmaceutical Sciences, University of Colorado, Aurora, CO, USA; 3Department of Physical Medicine, School of Medicine, University of Colorado, Aurora, CO, USA
Background: The objective of this study was to determine the direct and indirect costs of acute coronary syndromes (ACS) alone and with common cardiovascular comorbidities.
Methods: A retrospective analysis was conducted using the Medical Expenditure Panel Survey from 1998 to 2009. Four mutually exclusive cohorts were evaluated: ACS only, ACS with atrial fibrillation (AF), ACS with heart failure (HF), and ACS with both conditions. Direct costs were calculated for all-cause and cardiovascular-related health care resource utilization. Indirect costs were determined from productivity losses from missed days of work. Regression analysis was developed for each outcome controlling for age, US census region, insurance coverage, sex, race, ethnicity, education attainment, family income, and comorbidity burden. A negative binomial regression model was used for health care utilization variables. A Tobit model was utilized for health care costs and productivity loss variables.
Results: Total health care costs were greatest for those with ACS and both AF and HF ($38,484±5,191) followed by ACS with HF ($32,871±2,853), ACS with AF ($25,192±2,253), and ACS only ($17,954±563). Compared with the ACS only cohort, the mean all-cause adjusted health care costs associated with ACS with AF, ACS with HF, and ACS with AF and HF were $5,073 (95% confidence interval [CI] 719–9,427), $11,297 (95% CI 5,610–16,985), and $15,761 (95% CI 4,784–26,738) higher, respectively. Average wage losses associated with ACS with and without AF and/or HF amounted to $5,266 (95% CI -7,765, -2,767), when compared with patients without these conditions.
Conclusion: ACS imposes a significant economic burden at both the individual and society level, particularly when with comorbid AF and HF.
Keywords: acute coronary syndromes, comorbid atrial fibrillation, heart failure, costs
Introduction
Acute coronary syndrome (ACS) is an umbrella term that includes patients who present with either unstable angina (UA) or an acute myocardial infarction (MI) consisting of ST-segment elevation myocardial infarction (STEMI) or non-ST-segment myocardial infarction (non-STEMI). ACS begins with the rupture of an unstable plaque within the coronary artery, with subsequent development of associated intravascular thrombus and potential for ischemic myocardial injury, resulting in significant morbidity and mortality. While the overall incidence of ACS appears to be decreasing in the USA, an estimated 1.1 million Americans are hospitalized annually for an ACS event.1–3 Based on these statistics, the estimated economic burden on both direct and indirect costs is substantial.4–7 Economic analyses suggest that hospitalization and in turn readmission for ACS are the major drivers for elevated direct costs, accounting for 60%–90% of the total annual health care costs in these patients. High in-hospital costs could be a result of aggressive evidence-based medical as well as mechanical interventions. However, recent data suggest that the burden of comorbidities in this population can have a negative impact on patient outcome and in turn have ramifications on direct and indirect costs.5,6,8
Acute coronary syndrome is often complicated by concomitant or incident atrial fibrillation (AF) and heart failure (HF). Atrial fibrillation, HF, and MI all have an increased frequency with advanced age and acute MI is often associated with a sharp increase in the occurrence of both AF and HF.2 The overall incidence of AF among patients with MI varies between 2% and 22%.9–13 In the case of HF, an analysis of the Global Registry of Acute Coronary Events found the overall incidence of HF to be 13% and was similar in patients with STEMI (15.6%) and non-STEMI (14%), but half as frequent in patients with UA (8.2%).14 Among 9,406 STEMI, 11,008 non-STEMI, and 4,910 UA patients, Kaul et al estimated 13.6%, 14.8%, and 5.2%, respectively, to be diagnosed with HF during their index hospitalization for ACS, with a one-year cumulative HF rate of 23.4%, 25.4%, and 16%, respectively.15 However, in an analysis of 7,733 patients 65 years of age and older and hospitalized for a first MI, Ezekowitz et al found that 2,831 patients (36.7%) developed new-onset HF during their index hospitalization.16
Nonetheless, the presence of either AF or HF has significant negative prognostic implications in patients with ACS.17 In a meta-analysis of 43 studies involving 278, 854 patients with MI, Jabre et al found that AF was associated with at least a 40% increase in mortality compared with control patients in normal sinus rhythm, which persisted regardless of the timing of AF development.18 For HF, index HF (adjusted hazard ratio 3.2, 95% confidence interval [CI] 2.7–3.7) and post-discharge HF (adjusted hazard ratio 4.6, 95% CI 3.9–5.4) have been associated with an increased one-year mortality.15 Additionally, an analysis of the Global Registry of Acute Coronary Events found that the presence of HF in patients with ACS increased hospitalization by about 2 days longer when compared with those without HF (9 versus 7 days, P<0.0001 for STEMI; 8 versus 6 days, P<0.0001 for NSTEMI; and 5 days for both in UA, P=0.317, respectively).14 Furthermore, across all ACS subsets, patients with an admission diagnosis of HF were more likely to be rehospitalized than those with uncomplicated ACS, ie, without HF (STEMI, 25% versus 14.7%, P<0.0001; NSTEMI, 24.7% versus 15.8%, P<0.001; and UA, 23.1% versus 17.7%, P=0.022, respectively).14
Based on these data, we hypothesize that the presence of comorbid AF, HF, or both in patients diagnosed with ACS would place a significant economic burden from both the patient and societal perspective. To date, limited to no data exist regarding the impact that these comorbidities have on the direct and indirect costs of care in patients with ACS. With this in mind, the primary objective of this observational study was to determine the total economic burden of ACS with and without concomitant AF and/or HF, taking into account both direct and indirect costs.
Materials and methods
Study design
This study was a retrospective analysis of the Medical Expenditure Panel Survey (MEPS) database from 1998 through 2009 of patients with ACS with and without concomitant AF and HF. The primary study objective was to determine the total economic burden of ACS with and without concomitant AF and/or HF, taking into account both direct and indirect costs.
Data source
The MEPS is a nationally representative panel database of the US population. In addition to information on health, medical care use, medication use, and other health variables, the MEPS includes the Household Component (HC) survey that contains detailed information on demographic characteristics such as age, sex, race, ethnicity, education, general physical and mental health status, and wages. This analysis used the pooled 1998–2009 MEPS full-year consolidated data files. The sampling frame for the MEPS-HC is drawn from respondents to the National Health Interview Survey and the design of the MEPS-HC survey includes sampling weights, stratification, and clustering.19 The MEPS sampling weights incorporate adjustment for the complex sample design and reflect survey nonresponse and population totals from the Current Population Survey.19
Population of inference
The MEPS-HC is a nationally representative survey of the US civilian, non-institutionalized population. Using medical records, the study population of interest was defined as those who reported a medically coded diagnosis of ACS alone or in conjunction with AF and/or HF during the calendar year. Thus, the study population consisted of four mutually exclusive cohorts: ACS only, ACS with AF, ACS with HF, and ACS with both AF and HF. A comparison population was derived from patients from MEPS-HC who responded that they did not have any diagnosis of ACS, HF, or AF during the study period. Thus, the comparison population represented all patients who did not have any inpatient or outpatient claim for ACS, HF, or AF and did not identify having any of these conditions during the interview.
Independent variables
Study cohorts
The study population was defined in the medical conditions files as having a medically coded diagnosis with International Classification of Diseases Ninth Revision, Clinical Modification (ICD-9). In the MEPS-HC, diagnoses codes are derived by professional coders based on survey interviews. Only the first three digits of these codes are reported in MEPS. Information on each respondent is annualized, in which a calendar year is the duration of time for which information is reported in MEPS. In our study, a respondent was included in the study group based on the availability of a diagnosis at any time during the year. Additionally, there was no requirement for hospital admission to be included in the study group. Patients with ACS were identified using ICD-9 codes 410, 411, 412, and 413. Patients with AF and HF were identified using ICD-9 427 and ICD-9 428, respectively.
Two types of covariates were included in the analysis, ie, clinical (based on comorbidity burden) and demographic. These covariates were primarily chosen based on their relevance to and effect on the outcome of interest (eg, health care utilization, expenditures, and productivity).
Comorbidities
The Chronic Conditions Index measure was used to describe each respondent’s comorbidity burden (excluding ACS, HF, and AF). Indicator variables were created for six categories of reported comorbidity scores.20 These categories included a range from zero to five or more chronic comorbidities.
Demographics
The following demographic variables were drawn from the full year consolidated files of the MEPS-HC sample: sex (male, female); age (18–34, 35–49, 50–64, 65–79, 80 years and older); race (white, black, American Indian, other); ethnicity (Hispanic, non-Hispanic); region (Northeast, Midwest, South, West); health insurance status (any public including Medicare and Medicaid, any private, uninsured); education (no degree, high school or equivalent, bachelors of arts or other, master of arts or doctor of philosophy) and family income. Family income was defined by classifying family income as a percentage of the federal poverty level. Categories of family income included negative or poor (less than 100%), near poor (100%–125%), low income (125%–200%), middle income (200%–400%), and high income (400% or greater).
Dependent variables
Health care utilization
The following variables were used to determine annual health care utilization: outpatient visits, emergency room visits, average length of inpatient stay, and annual number of prescription medications including refills. Health care utilization was analyzed for all causes, as well as for cardiovascular (CV)-related.
Health care expenditures
Total health care expenditures consisted of direct payments for all health care utilization during the year, including out-of-pocket payments and payments by private insurance, Medicaid, Medicare, and other sources, adjusted to the 2011 dollar value. Health care costs were described separately for all-cause and CV-related utilization.
CV-related utilization and cost
The CV-related utilization and costs were identified based on ICD-9 diagnosis codes and medication therapeutic class codes available in the MEPS dataset. In particular, MEPS has detailed information on annual office-based, outpatient, and emergency room visits, as well as inpatient admissions for each respondent. These files contain information about each visit during the calendar years and include information on ICD-9 diagnosis codes for the visit and total expenditures per each visit. Accordingly, any visit with ICD-9 code 410, 411, 412, 414, 427, or 428 was classified into CV-related utilization and corresponding expenditures were classified as CV-related cost.
CV-related pharmacy costs were derived from MEPS annual prescribed medication files. For each respondent, these files contain information about annual prescribed medications including drug name, National Drug Code, Multum therapeutic codes (a type of drug classification system at the therapeutic level), and expenditures. Prescribed medications for the following therapeutic classes were defined as CV-related: antiplatelet agents, anticoagulants, antianginals, beta-blockers, antiarrhythmics, angiotensin-converting enzyme inhibitors/angiotensin receptor blockers, statins, calcium channel blockers, analgesics, aldosterone antagonists, diuretics, cardiac glycosides, vasodilators, inotropes, and iron.21 Finally, the annual CV-related health care costs were derived as the sum of CV-related medical and pharmacy expenditures.
Indirect costs
Measures of workplace productivity (unemployment, wages, and missed work) were used to determine indirect costs. This analysis was limited to working age individuals between the ages of 18 and 64 years. Respondents with “retired” status regardless of age were excluded from the productivity analysis. Individuals who were unemployed at any time during the interview year were classified as “unemployed”. In other words, anyone who had at least one gap in employment during the year was classified as unemployed. Wages were defined as annual wage in 2011 US dollars (adjusted using the consumer price index) for nonretired persons between the ages of 18 and 64 years.22,23 Due to sample size limitations, patients with ACS with and without AF and/or HF were combined into a single cohort only in the productivity analysis.
Missed days of work because of illness or injury
A patient’s reported days of work (half-day or more) missed due to illness or injury was included in the analysis to assess the effect of absenteeism on productivity losses.
Productivity losses measured by lost wages
Annual productivity losses were calculated as lost wages due to ACS or ACS with AF, HF, or both. Lost wages were used as a monetary measure of productivity losses. Annual wages incorporated both productivity losses due to unemployment and absenteeism; therefore, productivity losses were measured as the adjusted wage difference between the two study cohorts, ie, patients without ACS, HF, or AF and patients with ACS with and without AF and/or HF.
Statistical analysis
Descriptive statistics were used for both clinical utilization and demographics. Regression models specific to each type of outcome were developed for the adjusted analysis. Health care utilization variables were counts of the events (ie, number of outpatient or emergency room visits) during a calendar year. A negative binomial regression model was used for the adjusted analysis of health care utilization outcomes. Incidence rate ratios (IRR) for each covariate were derived and reported. It is a common practice to report IRRs after the negative binomial regressions, because their interpretation is more intuitive. As health care expenditures are heavily right-skewed and also contain many individuals with zero cost, a Tobit model was utilized to account for zero observations. All utilization and expenditure models were adjusted for age, sex, race, ethnicity, insurance coverage, education, family income level, region, and comorbidity burden. Logistic regression was used for unemployment outcome and a Tobit model was conducted for the adjusted analysis of annual wages. Negative binomial regression was developed to model the number of missed work days. Regressions for unemployment, annual wages, and missed work days were adjusted for age, sex, race, ethnicity, insurance coverage, education, region, and comorbidity burden. All analyses were conducted using Stata® version 11 (StataCorp, College Station, TX, USA).
Results
Health care utilization: unadjusted results
Table 1 summarizes the demographic characteristics for the study cohorts from the pooled 1998–2009 MEPS dataset. A total of 260,317 patients were identified who did not report having ACS, AF, or HF. A total of 4,679 patients with an ACS diagnosis were identified, of whom 4,054 reported a diagnosis of ACS only. Of this population, 283 individuals reported concomitant AF, 307 HF, and 35 both AF and HF. In the total ACS cohort (n=4,679), patients were older (range 66.2±0.33 to 71.6±4.93 years), and white (range 85.6%–99.5%) with a high school education (range 46.6%–53.8%). Those with ACS only, ACS with HF, ACS with AF, and ACS with both AF and HF were more likely to have five or more additional comorbid conditions (40.3%, 54.4%, 65.0%, and 77.6%, respectively) compared with those without these conditions (6.38%). Private insurance was the predominant payer source for those without ACS, HF, or AF (72.0%) and for those with ACS only (59.4%) and ACS with AF (58.7%), while public insurance was most common for those with ACS with HF (56.8%) and ACS with both AF and HF (54.6%).
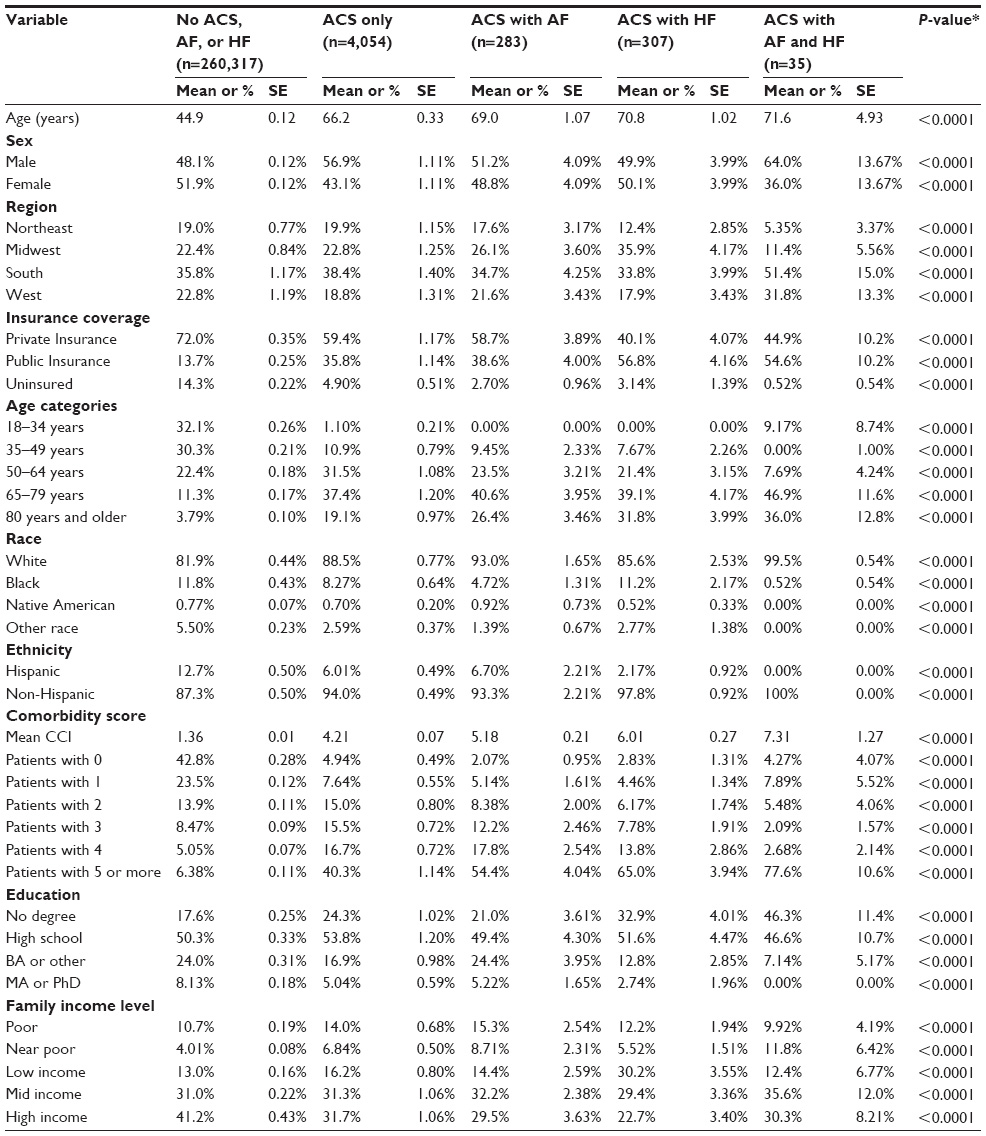 | Table 1 Demographic characteristics of cohorts |
Regarding health care utilization, the mean number of annual all-cause outpatient visits was lower for those without ACS, HF, or AF (7.41±0.09) compared with those with ACS only (22.8±1.14), ACS with AF (38.3±5.10), ACS with HF (43.1.±4.53), and all three conditions (43.2±6.86 visits; Table 2). Annual all-cause inpatient admissions were greatest for those with ACS with AF and HF (1.70±0.26) followed by those with ACS with HF (1.15±0.11), ACS with AF (0.84±0.10), and ACS alone (0.57±0.02). Additionally, these same cohorts had a longer inpatient stay (10.1±2.27, 7.68±0.89, 5.22±0.83, and 3.19±0.15 days, respectively) compared with those without these conditions (0.53±0.01 days, respectively). All-cause emergency room visits were more than three times more common among those with ACS and comorbidities compared with those without ACS, HF, or AF. Additionally, ACS patients with both AF and HF, as well as those with ACS with HF, had over 7-fold more prescriptions for any cause when compared with those without these conditions (77.8±9.19 and 75.1±4.27 versus 10.4±0.09, respectively).
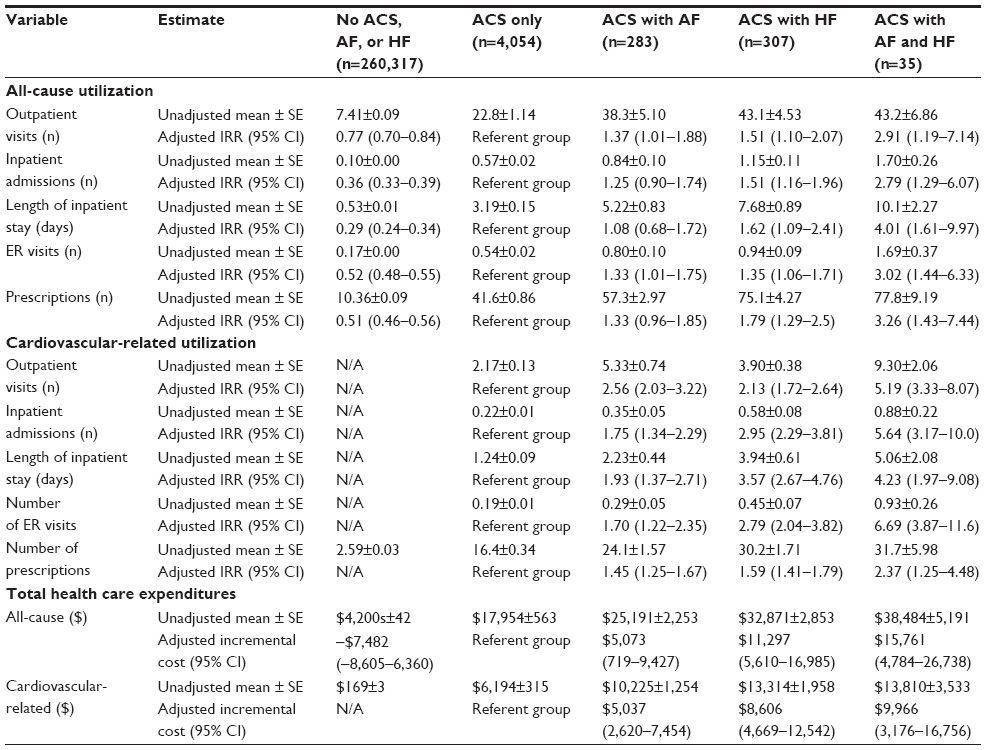 | Table 2 Annual health care utilization and health care expenditures stratified by all-cause and cardiovascular-related* |
For CV-related health care utilizations, the mean number of annual outpatient visits was highest for the ACS patients with both AF and HF cohort (9.30±2.06) relative to those with ACS only (2.17±0.13), as was the number of annual inpatient admissions (0.88±0.22 versus 0.22±0.01, respectively), length of inpatient stay (5.06±2.08 days versus 1.24±0.09 days, respectively), and number of annual emergency room visits (0.93±0.26 versus 0.19±0.01; Table 2). Compared with those without ACS, HF, or AF, patients with ACS only as well as ACS with AF had 6-fold to 9-fold more annual CV-related prescriptions (2.59±0.03 versus 16.4± 0.34 and 24.1±1.57, respectively). Additionally, patients with ACS with HF as well as those with ACS with both HF and AF had over eleven-fold more CV-related prescriptions than those without these conditions (30.2±1.71 and 31.7±5.98 versus 2.59±0.03, respectively).
The total annual unadjusted all-cause health care costs for those without ACS, AF, or HF was $4,200±$42 (Table 2). Total costs were greatest for ACS patients with both AF and HF ($38,484±$5,191) followed by ACS with HF ($32,871±$2,853), ACS with AF ($25,192±$2,253), and ACS only ($17,954±$563). Cardiovascular-related health care expenditures were also highest for those with ACS with both AF and HF at $13,811±3,533, followed by ACS with HF ($13,314±$1,958), ACS with AF ($10,225±$1,254), and ACS only ($6,194±$315).
Health care utilization: adjusted results
Outpatient visits
In the adjusted analysis, those without ACS, HF, or AF had a 23% lower expected rate of all-cause annual outpatient visits when compared with those with ACS only (IRR 0.77; 95% CI 0.70–0.84), while those with ACS with AF, ACS with HF, and ACS with both AF and HF had an expected rate of outpatient visits that were 37% (IRR 1.37, 95% CI 1.01–1.88), 51% (IRR 1.51, 95% CI 1.10–2.07), and 191% (IRR 2.91, 95% CI 1.19–7.14) higher compared with the ACS only cohort, respectively. The expected rate of CV-related outpatient stays for those with ACS with AF, ACS with HF, and ACS with both conditions was 2.56 (95% CI 2.03–3.22), 2.13 (95% CI 1.72–2.64), and 5.19 (95% CI 3.33–8.07) times higher when compared with those who had ACS only, respectively.
Inpatient visits
Compared with those with ACS only, patients without ACS, AF, or HF had a 64% lower expected rate of annual inpatient visits, (IRR 0.36, 95% CI 0.33–0.39). Additionally, patients with ACS with AF, ACS with HF, and ACS with both AF and HF experienced a 1.25 (95% CI 0.90–1.74), 1.51 (95% CI 1.16–1.96), and 2.79 (95% CI 1.29–6.07) times higher expected rate for annual inpatient visits than the ACS only group, respectively. The annual expected rate of CV-related inpatient visits was 1.75 (95% CI 1.34–2.29), 2.95 (95% CI 2.29–3.81), and 5.64 (95% CI 3.17–10.0) times greater for patients with ACS with AF, ACS with HF, and ACS with both AF and HF than those with ACS only, respectively.
Length of inpatient stay
The expected rate of all-cause related inpatient length of stay for those with ACS with AF, ACS with HF, and ACS with both AF and HF was 1.08 (95% CI 0.68–1.72), 1.62 (95% CI 1.09–2.41), and 4.01 (95% CI 1.61–9.97) times higher compared with the ACS only group, respectively. Compared with the ACS only group, the expected CV-related length of inpatient stay for these same three cohorts was 1.93 (95% CI 1.37–2.71), 3.57 (95% CI 2.67–4.76), and 4.23 (95% CI 1.97–9.08) times longer, respectively.
Number of emergency room visits
Patients without ACS, AF, or HF had an expected rate of all-cause emergency room visits that was 0.52 (95% CI 0.48–0.55) times lower than in the ACS only group. The expected rate of all-cause emergency room visits for those patients with ACS with AF, ACS with HF, and ACS with HF and AF was 1.33 (95% CI 1.01–1.75, ), 1.35 (95% CI 1.06–1.71), and 3.02 (95% CI 1.44–6.33) times greater than for the ACS only cohort, respectively. For CV-related emergency room visits, the expected rate of emergency room visits for these same three cohorts was 1.70 (95% CI 1.22–2.35), 2.79 (95% CI 2.04–3.82), and 6.69 (95% CI 3.87–11.6) times greater than those with ACS only, respectively.
Prescription use
Those patients without ACS, AF, or HF had an expected rate of prescription use that was 0.51 (95% CI 0.46–0.56) times less that of the ACS cohort. The ACS with AF, ACS with HF, and ACS with HF and AF cohorts had an expected rate of all-cause prescriptions that was 1.33 (95% CI 0.96–1.85), 1.79 (95% CI 1.29, 2.50) , and 3.26 (95% CI 1.43–7.44) times the expected rate for the ACS only group, respectively. Relative to the ACS only group, the CV-related prescription use for individuals with ACS with AF, ACS with HF, and ACS with HF and AF was 1.45 (95% CI 1.25–1.67), 1.59 (95% CI 1.41–1.79), and 2.37 (95% CI 1.25–4.48) times greater, respectively.
Health care expenditures
Total all-cause health care costs for those without ACS were $7,482 (95% CI −8,605, −$6,360) less than the ACS only group (Table 2). Compared with ACS only, all-cause adjusted health care costs associated with ACS with AF, ACS with HF, and ACS with AF and HF were $5,073 (95% CI 719–9,427), $11,297 (95% CI 5,610–16,985), and $15,761 (95% CI 4,784–26,738) higher, respectively. The adjusted CV-related health care costs were $5,037 (95% CI 2,620–7,454) more for ACS with AF, $8,606 (95% CI 4,669–12,542) more for ACS with HF, and $9,966 (95% CI 3,176–16,756) more for those with ACS with both AF and HF than the ACS only group.
ACS and productivity
As seen in Table 3, those patients diagnosed with ACS with and without AF and/or HF had higher levels of unemployment, lower wages, and more missed work days. On average, a patient with ACS with and without AF and/or HF missed 13.8±1.22 days of work due to illness, which was about three times greater than in patients without these conditions (4.06±0.05 days). Wages were highest for those without ACS, AF, or HF at $34,000±$278, and were lower for those with ACS with and without AF and/or HF ($25,783±$1,178). Nearly 40% of respondents with ACS alone or in combination with AF and/or HF were unemployed, relative to only 16% of those without these conditions.
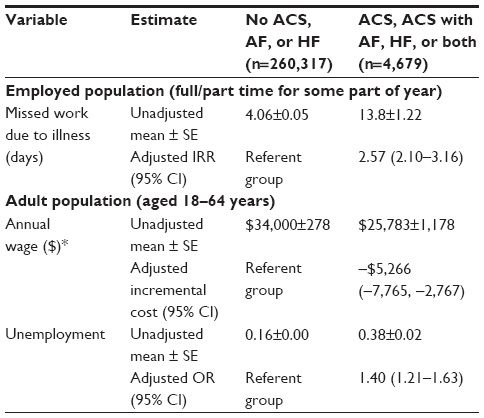 | Table 3 Annual productivity costs associated with those with and without acute coronary syndromes |
After adjusting for age, sex, race, ethnicity, insurance coverage, education, region, and comorbidity burden, the expected rate of missed work days for those with ACS with and without AF and/or HF was 2.57 (95% CI 2.1–3.16) times greater when compared with those without these conditions. All else constant, a diagnosis of ACS with or without AF and/or HF increased the odds of unemployment by a factor of 1.40 (95% CI 1.2–1.63). Further, annual wages were $5,266 (95% CI −7,765, −2,767) lower for those with ACS with and without AF and/or HF compared with those without these conditions. Thus, the per patient annual monetary value for productivity losses due to ACS and CV-related conditions was $5,266.
Discussion
Using the pooled 1998–2009 MEPS data, these data fill a gap in the literature by calculating the direct and indirect costs of ACS and accompanying comorbidities. Our estimates found substantial health care expenditures related to ACS alone and in combination with AF, HF or both.
A few studies have estimated the direct and indirect costs of ACS; however, the majority of these studies have used index hospitalization for identifying their cohorts.4–6 As hospitalization is a major driver in total annual health care costs, these study estimates of direct costs may be elevated possibly reflecting a sick study population. In a recent analysis, Page et al estimated the direct and indirect costs for employees with ACS.4 The investigators used pharmacy and medical claims along with short-term and long-term disability claims from 2007–2010 using two data sets, ie, the Integrated Benefits Institutes Health and Productivity Benchmarking Database and LifeLink. As with our study, patients were identified based upon any diagnosis for ACS during the study period and not upon index ACS hospitalization. All costs were also adjusted to 2011 dollar values. Regarding the impact on direct costs, the mean annual health cost for ACS per employee was $8,170±106, with $7,545±104 for mean annual medical costs. For indirect costs, the mean annual lost wage for the employee per short-term disability claim for ACS was $2,263±14.1, which translated into a productivity loss of $7,943±39.7 per disability claim. For long-term disability, the mean annual lost wage for the employee per disability claim for ACS was $20,609±446.4, which translated into a productivity loss of $52,473±1,114 per disability claim. Within our study, we found similar findings in which total annual health care expenditures ranged from $6,194±315; $10,225±1,254; $13,314±1,958; and $13,810±3,533 for those with ACS only, ACS with AF, ACS with HF, and ACS with both HF and AF, respectively.4 Furthermore, we found that per patient productivity losses due to ACS and CV-related conditions to be $5,266 annually compared with the short-term disability estimate of $7,943±39.7 per disability claim in the previous study.
Limited data exist regarding the effect that CV comorbidities have on direct and indirect costs in the management of ACS.24 In an analysis of the Medicare Current Beneficiary Survey, Chen et al evaluated 795 patients hospitalized for incident ACS between 2002 through 2006 and estimated their annual health care costs stratified by a comorbid diagnosis with and without AF or HF.24 In the adjusted analysis, the investigators found that ACS patients with AF had significantly higher total annual health care costs than those without AF, with mean costs of $66,586 and $48,031, respectively (P<0.001), which were driven primarily by inpatient admissions. In the case of comorbid HF, total annual health care costs were $64,548 compared with $46,268 (P<0.001), respectively, where again hospitalization costs accounted for 50% of the costs in the HF cohort.
As with the Chen et al analysis, our study indicated that ACS or ACS in combination with AF, HF, or both, not only resulted in substantial direct health care costs, but also greatly impacted productivity. Due to greater health care utilization, these costs significantly increased when ACS was accompanied by comorbid AF and/or HF. The per patient additional adjusted total annual health care cost of developing a complication in addition to ACS was $5,073 for AF, $11,297 for HF, and $15,761 for HF and AF. It is important to note that our adjusted estimates were lower than those found in the Chen et al analysis in that the investigators evaluated only those who had been hospitalized for ACS, therefore including a sicker, more critically ill population. Our analysis included all patients with ACS regardless of inpatient admission. Our analysis would therefore include those less sick patients potentially managed as outpatients, thus providing a broader investigation into health care costs. Additionally, our study cohort was much younger and not solely a Medicare population, so our data more truly reflect the impact of ACS on costs associated with a working population.
With this in mind, ACS with and without AF and HF had a major negative effect on productivity and in turn productivity costs, which could impact both employees and their employers. For context, the annual productivity of other chronic conditions are reported in Figure 1 for other chronic conditions calculated from a previously published analysis using MEPS during 1998–2009.25 Compared with other common chronic conditions, ACS with and without AF and HF would rank as one of the top diagnosis associated with annual lost wages.
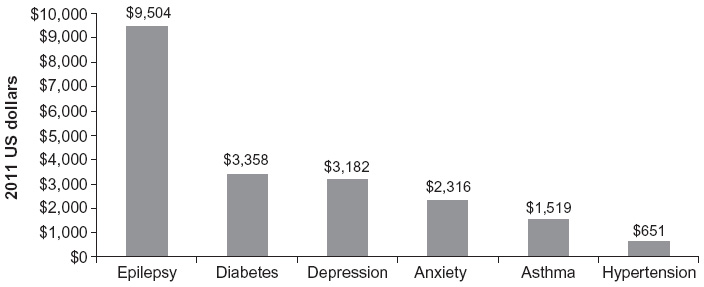 | Figure 1 Estimated annual lost productivity for the US population because of epilepsy and other chronic conditions. Marginal effects from generalized linear model using log link and gamma distribution adjusted for sex, race, ethnicity, region, age, insurance status, epilepsy, diabetes, depression, anxiety, asthma, hypertension, number of other chronic conditions, and survey years; wage income expressed in 2011 US dollars. |
In the MEPS sample, 1.56% had a diagnosis of ACS only, 0.11% ACS with AF, 0.12% ACS with HF, and 0.01% ACS with both AF and HF. From the societal perspective, given a working age population of 239,618,000 in 2011 and the adjusted marginal health care costs estimated in the analysis, approximately $1.3 billion could be saved annually by preventing the development of AF, $3.1 billion by preventing HF, and $500 million by preventing both AF and HF in patients with ACS. Our data suggest that the presence of ACS with and without comorbid conditions resulted in lost wages of $22.7 billion.
Nonetheless, our analysis does have inherent limitations due to the data source. First, MEPS is a national sample of people who were diagnosed by a medical provider that probably lacked the diagnostic rigor possible in clinical studies of the disease. Additionally, MEPS is a series of panels, which can limit true longitudinal analysis. Second, MEPS is also limited in its temporal details of diagnosis, treatment, and outcome, so we are unable to untangle ordering or timing of ACS, AF, or HF. Third, only the first three digits of the ICD-9 codes are reported in MEPS. Therefore, ICD-9 code 427 may include arrhythmias other than AF; however, AF is the most sustained cardiac arrhythmia.2 Fourth, respondents did not specify the cause of absenteeism. However, in the adjusted regression analysis, we controlled for comorbidity burden to identify the net effect of ACS on the number of missed work days. Fifth, estimates for ACS with both ACS and HF should be interpreted with caution, since the sample size for this group does not meet the minimum standard of 100 observations to produce nationally representative estimates. Finally, MEPS does not capture other sources of indirect costs such as caregiver burden. However, a major strength lies in that MEPS does provide the socioeconomic data to determine comprehensive measurement of indirect costs of illness that have not been previously reported in the literature.
In conclusion, our data suggest that ACS alone has a significant economic burden at both the individual and societal level; however, this impact is incrementally larger when AF, HF or both are included in a patient’s list of comorbidities. By specifically addressing comorbidities associated with ACS such as HF and AF, providers may not only improve patient outcome but could greatly decrease the total and individual direct and indirect costs of ACS at a societal level.
Acknowledgment
We would like to thank Catherine G Massey, PhD, for her assistance with this manuscript.
Disclosure
The authors report no conflicts of interest in this work.
References
Yeh RW, Sidney S, Chandra M, Sorel M, Selby JV, Go AS. Population trends in the incidence and outcomes of acute myocardial infarction. N Engl J Med. 2010;362(23):2155–2165. | |
Go AS, Mozaffarian D, Roger VL, et al. Heart disease and stroke statistics –2014 update: a report from the American Heart Association. Circulation. 2014;129(3):e28–e292. | |
Steg PG, Goldberg RJ, Gore JM, et al. Baseline characteristics, management practices, and in-hospital outcomes of patients hospitalized with acute coronary syndromes in the Global Registry of Acute Coronary Events (GRACE). Am J Cardiol. 2002;90(4):358–363. | |
Page RL 2nd, Ghushchyan V, Gifford B, et al. The economic burden of acute coronary syndromes for employees and their dependents: medical and productivity costs. J Occup Environ Med. 2013;55(7):761–767. | |
Johnston SS, Curkendall S, Makenbaeva D, et al. The direct and indirect cost burden of acute coronary syndrome. J Occup Environ Med. 2011;53(1):2–7. | |
Zhao Z, Winget M. Economic burden of illness of acute coronary syndromes: medical and productivity costs. BMC Health Serv Res. 2011;11:35. Available from: http://www.biomedcentral.com/content/pdf/1472-6963-11-35.pdf. Accessed May 7, 2014. | |
Chen SY, Crivera C, Stokes M, Boulanger L, Schein J. Clinical and economic outcomes among hospitalized patients with acute coronary syndrome: an analysis of a national representative Medicare population. Clinicoecon Outcomes Res. 2013;5:181–188. | |
Radovanovic D, Seifert B, Urban P, et al. Validity of Charlson Comorbidity Index in patients hospitalised with acute coronary syndrome. Insights from the nationwide AMIS Plus Pegistry 2002–2012. Heart. 2014;100(4):288–294. | |
Schmitt J, Duray G, Gersh BJ, Hohnloser SH. Atrial fibrillation in acute myocardial infarction: a systematic review of the incidence, clinical features and prognostic implications. Eur Heart J. 2009;30(9):1038–1045. | |
Saczynski JS, McManus D, Zhou Z, et al. Trends in atrial fibrillation complicating acute myocardial infarction. Am J Cardiol. 2009;104(2):169–174. | |
Crenshaw BS, Ward SR, Granger CB, Stebbins AL, Topol EJ, Califf RM. Atrial fibrillation in the setting of acute myocardial infarction: The GUSTO-I experience. Global utilization of streptokinase and tPA for occluded coronary arteries. J Am Coll Cardiol. 1997;30(2):406–413. | |
Eldar M, Canetti M, Rotstein Z, et al. Significance of paroxysmal atrial fibrillation complicating acute myocardial infarction in the thrombolytic era. Sprint and thrombolytic survey groups. Circulation. 1998;97(10):965–970. | |
Rathore SS, Berger AK, Weinfurt KP, et al. Acute myocardial infarction complicated by atrial fibrillation in the elderly: prevalence and outcomes. Circulation. 2000;101(19):969–974. | |
Steg PG, Dabbous OH, Feldman LJ, et al. Determinants and prognostic impact of heart failure complicating acute coronary syndromes: observations from the Global Registry of Acute Coronary Events (GRACE). Circulation. 2004;109(4):494–499. | |
Kaul P, Ezekowitz JA, Armstrong PW, et al. Incidence of heart failure and mortality after acute coronary syndromes. Am Heart J. 2013;165(3):379–385. | |
Ezekowitz JA, Kaul P, Bakal JA, Armstrong PW, Welsh RC, McAlister FA. Declining in-hospital mortality and increasing heart failure incidence in elderly patients with first myocardial infarction. J Am Coll Cardiol. 2009;53(1):13–20. | |
Mehta RH, Dabbous OH, Granger CB, et al. Comparison of outcomes of patients with acute coronary syndromes with and without atrial fibrillation. Am J Cardiol. 2003;92(9):1031–1036. | |
Jabre P, Roger VL, Murad MH, et al. Mortality associated with atrial fibrillation in patients with myocardial infarction: a systematic review and meta-analysis. Circulation. 2011;123(15):1587–1593. | |
Machlin S, Wu W, Zodet M. Computing standard errors for MEPS estimates. Agency for Health Care Research and Quality. 2005. Available from: http://www.meps.ahrq.gov/mepsweb/survey_comp/standard_errors.jsp. Accessed May 17, 2014. | |
Healthcare Costs and Utilization Project. Chronic condition indicator for ICD-9-cm. Available from: https://www.hcup-us.ahrq.gov/toolssoftware/chronic/chronic.jsp. Accessed September 20, 2014. | |
Cerner Multum. Drug Product Information. Available from: http://www.multum.com/lexicon.html. Accessed September 21, 2014. | |
United States Department of Labor. Bureau of Labor Statistics. Occupational employment and wages-May 2011. Available from: http://www.bls.gov/news.release/archives/ocwage_03272012.pdf. Accessed July 1, 2014. | |
United States Department of Labor. Bureau of Labor Statistics. National Compensation Survey: Employee Benefits in the United States, March 2011. Available from: http://www.bls.gov/ebs/benefits/2011/ebbl0048.pdf. Accessed July 1, 2014. | |
Chen SY, Crivera C, Stokes M, Boulanger L, Schein J. Outcomes associated with comorbid atrial fibrillation and heart failure in Medicare beneficiaries with acute coronary syndrome. BMC Health Serv Res. 2014;14:80. Available from: http://www.biomedcentral.com/1472-6963/14/80. Accessed September 21, 2014. | |
Libby AM, Ghushchyan V, McQueen RB, Slejko JF, Bainbridge JL, Campbell JD. Economic differences in direct and indirect costs between people with epilepsy and without epilepsy. Med Care. 2012;50(11):928–933. |
 © 2014 The Author(s). This work is published and licensed by Dove Medical Press Limited. The full terms of this license are available at https://www.dovepress.com/terms.php and incorporate the Creative Commons Attribution - Non Commercial (unported, v3.0) License.
By accessing the work you hereby accept the Terms. Non-commercial uses of the work are permitted without any further permission from Dove Medical Press Limited, provided the work is properly attributed. For permission for commercial use of this work, please see paragraphs 4.2 and 5 of our Terms.
© 2014 The Author(s). This work is published and licensed by Dove Medical Press Limited. The full terms of this license are available at https://www.dovepress.com/terms.php and incorporate the Creative Commons Attribution - Non Commercial (unported, v3.0) License.
By accessing the work you hereby accept the Terms. Non-commercial uses of the work are permitted without any further permission from Dove Medical Press Limited, provided the work is properly attributed. For permission for commercial use of this work, please see paragraphs 4.2 and 5 of our Terms.