")
Back to Journals » International Journal of Nanomedicine » Volume 10 » Issue 1
In vitro cytotoxicity analysis of doxorubicin-loaded/superparamagnetic iron oxide colloidal nanoassemblies on MCF7 and NIH3T3 cell lines
Authors Tomankova K, Polakova K, Pizova K, Binder S, Havrdova M, Kolarova M, Kriegova E, Zapletalova J, Malina L, Horakova J, Malohlava J, Kolokithas-Ntoukas A, Bakandritsos A, Kolarova H, Zboril R
Received 12 August 2014
Accepted for publication 11 October 2014
Published 29 January 2015 Volume 2015:10(1) Pages 949—961
DOI https://doi.org/10.2147/IJN.S72590
Checked for plagiarism Yes
Review by Single anonymous peer review
Peer reviewer comments 3
Editor who approved publication: Dr Thomas Webster
Katerina Tomankova,1 Katerina Polakova,2 Klara Pizova,1 Svatopluk Binder,1 Marketa Havrdova,2 Mary Kolarova,2 Eva Kriegova,3 Jana Zapletalova,1 Lukas Malina,1 Jana Horakova,1 Jakub Malohlava,1 Argiris Kolokithas-Ntoukas,4 Aristides Bakandritsos,4 Hana Kolarova,1 Radek Zboril2
1Department of Medical Biophysics, Institute of Translation Medicine, Faculty of Medicine and Dentistry, 2Regional Centre of Advanced Technologies and Materials, Departments of Physical Chemistry and Experimental Physics, Faculty of Science, 3Department of Immunology, Faculty of Medicine and Dentistry, Palacky University, Olomouc, Czech Republic; 4Department of Materials Science, University of Patras, Patras, Greece
Abstract: One of the promising strategies for improvement of cancer treatment is based on magnetic drug delivery systems, thus avoiding side effects of standard chemotherapies. Superparamagnetic iron oxide (SPIO) nanoparticles have ideal properties to become a targeted magnetic drug delivery contrast probes, named theranostics. We worked with SPIO condensed colloidal nanocrystal clusters (MagAlg) prepared through a new soft biomineralization route in the presence of alginate as the polymeric shell and loaded with doxorubicin (DOX). The aim of this work was to study the in vitro cytotoxicity of these new MagAlg–DOX systems on mouse fibroblast and breast carcinoma cell lines. For proper analysis and understanding of cell behavior after administration of MagAlg–DOX compared with free DOX, a complex set of in vitro tests, including production of reactive oxygen species, comet assay, cell cycle determination, gene expression, and cellular uptake, were utilized. It was found that the cytotoxic effect of MagAlg–DOX system is delayed compared to free DOX in both cell lines. This was attributed to the different mechanism of internalization of DOX and MagAlg–DOX into the cells, together with the fact that the drug is strongly bound on the drug nanocarriers. We discovered that nanoparticles can attenuate or even inhibit the effect of DOX, particularly in the tumor MCF7 cell line. This is a first comprehensive study on the cytotoxic effect of DOX-loaded SPIO compared with free DOX on healthy and cancer cell lines, as well as on the induced changes in gene expression.
Keywords: DOX/SPIO nanocarriers, superparamagnetic iron oxide nanoparticles, doxorubicin, in vitro cytotoxicity
Introduction
The cytostatic drug doxorubicin (DOX) is a well-known chemotherapeutic agent that is used in the treatment of a wide variety of cancers. A key mechanism in the response of cancer cells to chemotherapeutic drugs involves the activation of apoptotic pathway.1 However, the clinical use of DOX is limited by its side effects, the most dangerous being a cumulative dose-dependent cardiotoxicity. To minimize these side effects, DOX can be vectorized, that is associated with drug carriers that will favor its accumulation on the site of action and limit its dispersion into healthy tissues.2 Some tumors are supplied by a leaky neovasculature characterized by incomplete endothelial barrier and they possess poor lymphatic drainage. This phenomenon, known as enhanced permeability and retention, enables nanosized carriers to reach their target site.3
Nanotechnology provides an alternative strategy to drug delivery by offering a means to encapsulate or attach drugs to nanomaterials.4 Magnetic drug targeting is thus based on the association of a drug with magnetic nanoparticles (NPs).5 These magnetic systems, essentially based on non-toxic superparamagnetic iron oxide (SPIO) NPs, are currently used in the preclinical research as promising theranostics because of the combination of excellent performance as magnetic resonance imaging (MRI) diagnostics and as magnetic carriers of therapeutic drugs at the same time. Moreover, SPIO are being increasingly used in various biomedical applications such as hyperthermia, cell and protein separation, stem cell tracking, and molecular imaging.6,7 In addition to their magnetic properties, the high surface area to volume ratio and suitability for appropriate and broad surface functionalization provide the potential for high drug loading.2,8,9 SPIO are finally biocompatible, biodegradable, and have a satisfactory safety profile.10
Several SPIO/POLYMER/DOX composites have been developed and tested for their drug releasing properties at various pH values, temperature, or in the presence of external magnetic fields, followed by cell internalization studies and measurement of common cytotoxic assays.5,9,11–14
Cancer is ranked among the leading causes of death worldwide, accounting for 8.2 million deaths in 2012. Given the predicted annual rate of increase in diagnosed cancer cases from 14 million in 2012 to 22 million within the next two decades (Globocan 2012, IARC), the need for effective and progressive cancer therapy is a priority in today’s research. SPIO is a promising candidate in the new strategic field of nanomedicine and targeted antitumor drug delivery systems.5,9,13 It is therefore essential to shed more light on the cytotoxic action of both free DOX compared with DOX bound on SPIO NPs. To the best of our knowledge, there are no detailed reports on the complex cytotoxic effects of SPIO/POLYMER/DOX nanocarriers compared with free DOX.
Therefore, the aim of this study was to test the in vitro cytotoxic effects of MagAlg–DOX nanocarriers prepared recently through a new soft biomineralization route in the presence of alginate in comparison with free DOX. We used MCF7 and NIH3T3 cell lines and evaluated the effects on the kinetic production of reactive oxygen species (ROS), cell viability, mitochondrial membrane change, genotoxicity, cell cycle, microscopic analysis, C-FOS and C-MYC gene expression. The results were supported by following the internalization pathways of free DOX and MagAlg–DOX imaged by fluorescence/optical microscopy.
Materials, methods, and procedures
Materials and instruments
NIH3T3 cell line (Mouse fibroblast cells) and MCF7 (Caucasian breast adenocarcinoma cells) were used as biological materials. The chemicals used were DOX (EBEWE Pharma GMBH), MagAlg SPIO NPs (RCPTM UP Palacky University), Dulbecco’s Modified Eagle Medium (DMEM), phosphate buffered saline (PBS, pH 7.4), 5-(and-6)-chloromethyl-2′,7′-dichlorodihydrofluorescein diacetate (CM-H2DCFDA; Invitrogen), thiazolyl blue tetrazolium bromide (MTT, Sigma-Aldrich), 5,5′,6,6′-tetrachloro-1,1′,3,3′-tetraethyl-imidacarbocyanine iodide (C25H27Cl4IN4, JC-1, Sigma-Aldrich), dimethyl sulfoxide (DMSO, Sigma-Aldrich), HMP agarose (Serva), LMP agarose (Qbiogene), trypsin-ethylenediaminetetraacetic acid (EDTA) (Sigma), ethanol (Sigma), fetal bovine serum (FBS, Sigma-Aldrich), NaCl (Tamda), EDTA (Lachema), tris [tris(hydroxymethyl) aminomethane, Sigma-Aldrich], Triton X-100 (Serva), NaOH (Sigma-Aldrich), SYBR® Green (Invitrogen), anti-phospho-histone H3 (Millipore), Alexa fluor 488 goat anti-rabbit IgG (Molecular Probes), propidium iodide (Sigma), ribonuclease A (Sigma), Total RNA Purification Kit (Norgen), Protector RNase Inhibitor (Roche Applied Science), Transcriptor High Fidelity cDNA Synthesis Kit (Roche Applied Science), PCR-Mix (FastStart Taq DNA Polymerase, dNTPack, Roche Applied Science), PSMB2–50 primers 5′gtgagagggcagtggaactc 3′ 5′gaaggttggcagattcagga 3′ (Metabion), fluorescently labeled locked nucleic acid probe #50 (Universal ProbeLibrary, Roche Applied Science), TaqMan® Gene Expression Assay (Human MYC or Human FOS, Life Technologies), human universal reference RNA (Stratagene). Measurements were carried out on multi-detection microplate reader Synergy HT (BioTek), transmission microscope Olympus IX81 with DSU unit (Olympus), centrifugal machine (Biotech), electrophoretic tank (Bio-RAD), Mastercycler pro (Eppendorf), RotorGene Q (Qiagen), flow cytometer BD FACSCanto (BD Biosciences) and Atomic Force Microscope Bioscope Catalyst (Bruker). Results were proceeded using Phototox Version 2.0 software (Zebet, Berlin, Germany), Comet Score freeware 1.5 (Tritek Corp, Sumerduck, VA, USA), Nanoscope analysis (Bruker, Santa Barbara, CA, USA), and Rotor Gene software Q Series Version 2.0.2, (Qiagen, Venlo, Netherlands).
Preparation and characterization of MagAlg SPIO NPs and MagAlg–DOX nanocarriers
The prepared magnetic NPs were synthesized as condensed clustered colloids through a soft biomineralization process in the presence of the biopolymer alginate. Briefly, 300 mg of alginate was dissolved in H2O (60 mL). NH3 (4 mL, 30%) was added to the polymer solution. Then, 1,440 mg of FeSO4·7H2O (in 20 mL of H2O containing 60 μL of 37% HCl) was added. The mixture was heated at 50°C under magnetic stirring and the reaction was stopped after 1 hour and 30 minutes. The product was purified from by-products and fractionated. Detailed description of the synthesis and characterization of MagAlg SPIO NPs can be found in a previous work.15 These magnetic nanoclusters (40 nm in diameter consisting of 13 nm individual crystals of magnetite) coated with alginate display high relaxivity index in MRI (r2 =243 mM−1 s−1), superparamagnetic behavior with saturation magnetization of 70 emu/g (7T, 300 K), high drug loading (26±2 wt% of DOX), high cytocompatibility, and magnetophoretic response. The binding of DOX on the surface of alginate chains is very strong (through hydrogen bonds and electrostatic interactions) allowing the release of drug only during magnetic hyperthermia or high temperature (see previous results reported in Ref. 15).
In vitro experiment preparation
104 NIH3T3 and MCF7 cells were incubated in thermobox at 37°C and 5% CO2 for 24 hours in 96-well plates with fresh DMEM. Cells were incubated in thermobox for 1 hour (ROS), 6 hours (mitochondrial membrane potential [MMP] change, comet assay, cell cycle, and gene analysis), or 24 hours (MTT) with 50 μM, 5 μM, and 0.5 μM of DOX or MagAlg–DOX (equivalent concentration of SPIO was 100 μg/mL, 10 μg/mL, and 1 μg/mL, which corresponds to 544 μM, 54.4 μM, and 5.44 μM iron oxide, respectively). All assays were performed in triplicate. Samples were adjusted to the appropriate concentrations in order to contain the same amount of drug as in the studies of the free drug.
Measurement of ROS production
Immediately after DOX and MagAlg–DOX addition, the ROS kinetic production was assessed for 1 hour using CM-H2DCFDA fluorescence probes and microplate reader Synergy HT. Time of incubation with 5 μM CM-H2DCFDA probes (dissolved in DMSO) was 30 minutes.
MTT viability test
DOX or MagAlg–DOX was added at concentrations 0–50 μM (with respect to DOX). The cytotoxic effect and LC50 on NIH3T3 and MCF7 cells was determined using the MTT assay. We replaced DMEM with PBS prior to starting the MTT measurements, added 20 μL of 20 mM MTT (dissolved in PBS) and incubated the cells for 3 hours at 37°C and 5% CO2. The MTT solution was carefully removed and 100 μL DMSO was added in order to solubilize the violet formazan crystals. Data were calculated using the Phototox Version 2.0 software.
MMP change assay (Δψm)
MMP change was monitored by the fluorescent cationic voltage-dependent dye JC-1. Cells were loaded in PBS media with JC-1 (5 μg/mL, dissolved in DMSO), for 20 minutes at 37°C, 5% CO2, and then washed twice with PBS. Results were expressed as the ratio of the fluorescence retained within the cells in green (excitation 485 nm and emission 548 nm) and in red wavelengths (excitation 520 nm and emission 590 nm) using the microplate reader Synergy HT.
Comet assay
We used the methods from our previous study.16 Briefly, microscope slides were first precoated with 1% HMP agarose. The cells were trypsinized, rinsed with DMEM with 10% FBS, and centrifuged (6 minutes, 1,000 rpm). A quantity of 85 μL of 1% LMP agarose was added to cell suspension and 85 μL of this was added to the microscope with agarose gel. The microscope slides were immersed in a lysis buffer for 1 hour, then placed in an electrophoretic tank and dipped into a cool electrophoresis solution for 40 minutes. Electrophoresis was run at 0.8 V/cm and 380 mA for 20 minutes. After neutralization in buffer (0.4 M Tris, pH =7.5), the samples were stained with SYBR® Green and immediately scored using SW Comet Score.
Cell cycle, phosphorylation of histone H3, and apoptosis determination
The cell cycle was monitored using the protocol of phosphorylation of histone H3. Briefly, after treatment, the cells were trypsinized using 0.25% trypsin-EDTA, rinsed with DMEM with 10% FBS, and centrifuged (5 minutes, 2,500 rpm). Cell suspension was fixed with cold 70% ethanol and stored in a freezer for future use. Fixed cells were rinsed with PBS with 1% FBS and centrifuged (5 minutes, 2,500 rpm). Then, 1 mL PBS with 0.25% Tritox X-100 was added, rinsed, and centrifuged for 15 minutes on ice. Hundred microliters of primary antibody anti-phospho-histone H3 was added for 1 hour at room temperature, rinsed, and centrifuged. Hundred microliters of secondary antibody Alexa Fluor 488 goat anti-rabbit IgG was incubated for 30 minutes in dark, rinsed, and centrifuged. Propidium iodide and Ribonuclease A were added to the 700 μL of cell suspension. Measurements were carried out with flow cytometer BD FACSCanto using FACS (Fluorescence Activated Cell Sorting) method.
Gene expression analysis
Total RNA was isolated from cells after treatment with Total RNA Purification Kit according to the manufacturer’s protocol. All samples were treated with Protector RNase Inhibitor. Total RNA was converted to cDNA using the Transcriptor High Fidelity cDNA Synthesis Kit in a 20 μL reaction volume according to the manufacturer’s protocol. Reverse transcription was performed on Mastercycler pro. Template primer mix was incubated for 10 minutes at 65°C and the final reaction (13 μL of template mix with 7 μL of reverse transcription mix) was incubated for 60 minutes at 50°C and then 5 minutes at 85°C. PCR mixes were prepared as follows: 5 μL of cDNA was added to 20 μL PCR-Mix with primers (Table 1) and fluorescently labeled locked nucleic acid probe #50 or with TaqMan® Gene Expression Assay. The final concentrations of each component: 900 nM of each sense and antisense primers and 100 nM probe 3.5 mM MgCl2, 200 μM each dNTPs, 1 U FastStart Taq DNA Polymerase, 1× PCR reaction buffer. cDNA was stored at −20°C before further use. After initial denaturation (one cycle at 94°C for 15 minutes), 40 cycles amplification (94°C for 45 seconds, 60°C for 30 seconds) were performed on RotorGene Q. The primer sequences, probes, and amplicon sizes for investigated genes are listed in Table 1. Relative expression was calculated using the second derivative method as follows: Expression = average amplification(CTtcalibrato−CTtsample). The GAPDH gene was used as a reference gene and human universal reference RNA was used as calibrator (in triplicates) at concentration of 1.25 ng/reaction.
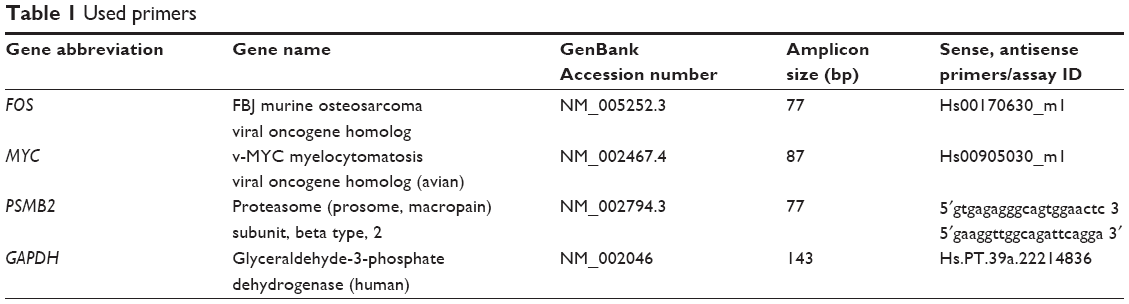 | Table 1 Used primers |
Cell uptake analysis
Visual determination of cell uptake and incorporation of free DOX and MagAlg–DOX were performed using optical microscopy Olympus IX70 with fluorescent mode. The type of filter used was U-MWG2 FILTER BLOCK (ex: 510–550 nm, em: ≤590 nm; Olympus). For comparison with in vitro battery tests used in this work, we tracked the efficiency of labeling and cell morphology after 1 hour, 6 hours, and 24 hours of incubation of cells with 0.5 μM, 5 μM, and 50 μM free DOX and MagAlg–DOX. All experiments were performed on two types of cell lines (MCF7 and NIH3T3).
Nanoparticle imaging
NPs were spread on the bottom of a Petri dish (Willco wells, the Netherlands) and dried at 50°C. Imaging was performed in air using atomic force microscopy (AFM) tip ScanAsyst Air with resonant frequency 45–95 kHz and spring constant 0.2–0.8 N/m with tip radius 2 nm. Scan rate was set at 0.3 Hz. AFM surface images were acquired in a ScanAsyst mode.
The sample for transmission electron microscopy (TEM) was prepared by casting a droplet of a dilute aqueous suspension (0.01% w/v in Fe2O3) of the hybrids on copper grids coated with Formvar carbon film. Micrographs were obtained on a JEOL, JEM-2100 instrument operating at 200 kV.
Statistical analysis
The results were processed using the software SPSS Version 15 (SPSS Inc, Chicago, IL, USA). The data are from three independent experiments. To describe the ROS, cell viability, MMP change, and gene expression, we used ANOVA with Dunnet post hoc tests. Comet samples were compared using the Kruskal–Wallis test and Mann–Whitney U-test with Bonferroni correction for multiple comparisons. Tests to determine a phosphorylation of histone H3 and apoptosis were processed using Fisher’s exact test with Bonferroni correction. The cell cycle was statistically analyzed using the χ2 test with Bonferroni correction, and the method of adjusted residuals. All concentrations were compared with a relevant control group and with relevant treatment comparisons.
Results
The effect of free DOX and MagAlg–DOX nanocarriers on ROS formation in NIH3T3 and MCF7 cells was continuously monitored during the 60 minutes after addition of 0.5 μM, 5 μM, and 50 μM of DOX in both samples. Regression coefficient of ROS kinetic production determined the rate of production of peroxy radical (H2O2), hydroxyl radical (HO–), hypochlorous acid (HOCl), and peroxyl radical (COO–) at each minute of measurement. The rate of ROS was calculated using linear regression analysis. A summary of rate values is presented in Figure 1. The data show significant increase in ROS production between the control and DOX concentration window of 50 μM to 5 μM DOX in the cell line NIH3T3. Comparison of free-DOX and MagAlg–DOX groups at 50 μM DOX concentration shows significantly higher ROS production in the free-DOX group in both the cell lines. These results show the potential decreasing of the toxic effects of DOX when incorporated into SPIO NPs.
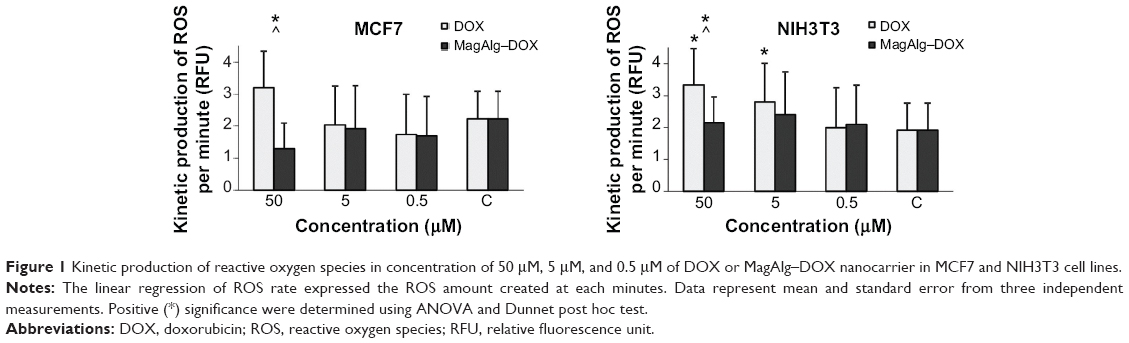 | Figure 1 Kinetic production of reactive oxygen species in concentration of 50 μM, 5 μM, and 0.5 μM of DOX or MagAlg–DOX nanocarrier in MCF7 and NIH3T3 cell lines. |
The effects of DOX and/or MagAlg–DOX nanocarriers on cell viability were determined using MTT assay. The absorbance measured, using this assay, reflects the total metabolic activity of a cell population and is therefore also an indirect measurement of cell proliferation. Although commonly used as a viability assay, the MTT assay more specifically represents a measure of mitochondrial function. The results from MTT viability tests are presented in Figure 2 and in the form of IC50 (Table 2). After 24 hours of incubation, a significant decrease in cell viability was found at all DOX concentrations in both groups (free-DOX and MagAlg–DOX) and in both the cell lines. Cell viability systematically decreased with increasing DOX concentration. However, low level (>80%) of cell viability can be seen only in DOX concentrations between 5 μM and 50 μM in both the cell lines of the free-DOX group. On the other hand, in MagAlg–DOX group, we found low cell viability only at the concentration of 50 μM in the MCF7 cell line. IC50 values show the higher cytotoxic effect of DOX (either free or bound to MagAlg) in the MCF7 cell line. IC50 values (Table 2) also manifest the significantly lower cytotoxicity of MagAlg–DOX (IC50 =18.245 μM of DOX) as compared to free-DOX (IC50 =1.2009 μM of DOX). Mitochondria are considered as one of the primary targets of DOX through mitochondria-mediated apoptosis associated with changes in mitochondrial functional parameters.17 The MMP change (Δψm) assay was used to evaluate these changes in cells 6 hours after treatment (Figure 3). The ratio of median formation of green monomer and red aggregate expresses the probability of apoptosis. Higher values reflect greater cell perturbation. However, statistical analysis showed no significant changes for individual concentrations. In the NIH3T3 cell line, higher values of mitochondrial membrane depolarization were observed in the early stage of the cell death process in concentrations 0.5 μM and 5 μM in the free-DOX group. In the MagAlg–DOX group, no significant changes were found in both the cell lines.
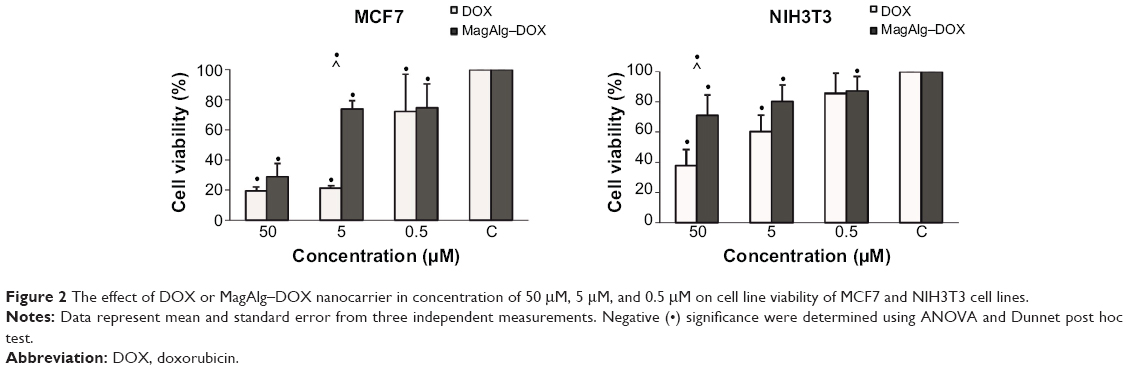 | Figure 2 The effect of DOX or MagAlg–DOX nanocarrier in concentration of 50 μM, 5 μM, and 0.5 μM on cell line viability of MCF7 and NIH3T3 cell lines. |
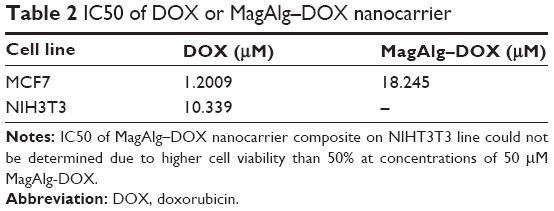 | Table 2 IC50 of DOX or MagAlg–DOX nanocarrier |
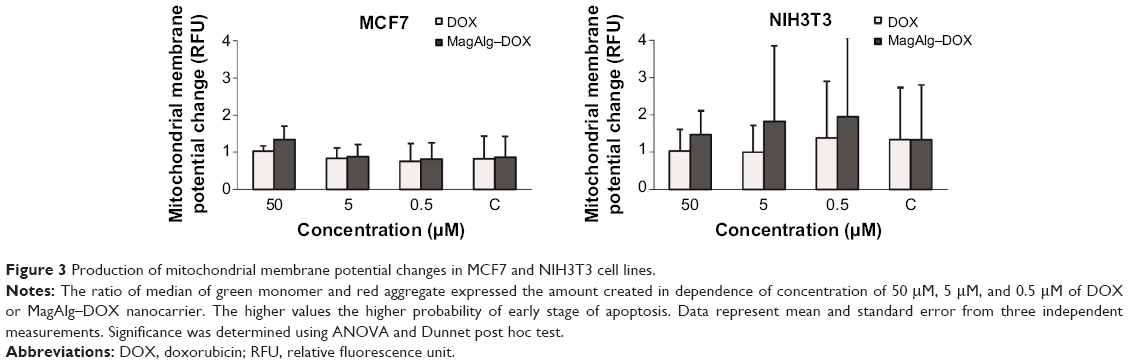 | Figure 3 Production of mitochondrial membrane potential changes in MCF7 and NIH3T3 cell lines. |
Comet assay is a method for determination of genotoxicity. In this case, we specified the fragmentation of DNA after 6 hours of treatment. The comet length and percentage of DNA in the tail are depicted as histograms in Figure 4. Comet length was significantly greater at concentrations 50 μM and 5 μM in the free-DOX group and 50 μM and 0.5 μM in the MagAlg–DOX group in both the cell lines and in comparison to the control group. The significantly greater comet length was found for both the cell lines after administration of 50 μM and 5 μM DOX. Higher percentage of DNA in tail was observed at the concentrations of 50 μM and 5 μM in DOX group and at the concentration of 50 μM in MagAlg–DOX group in both the cell lines. A significantly higher percentage of DNA in the tail was observed only at a concentration of 5 μM in DOX group in comparison with MagAlg–DOX group in the MCF7 cell line.
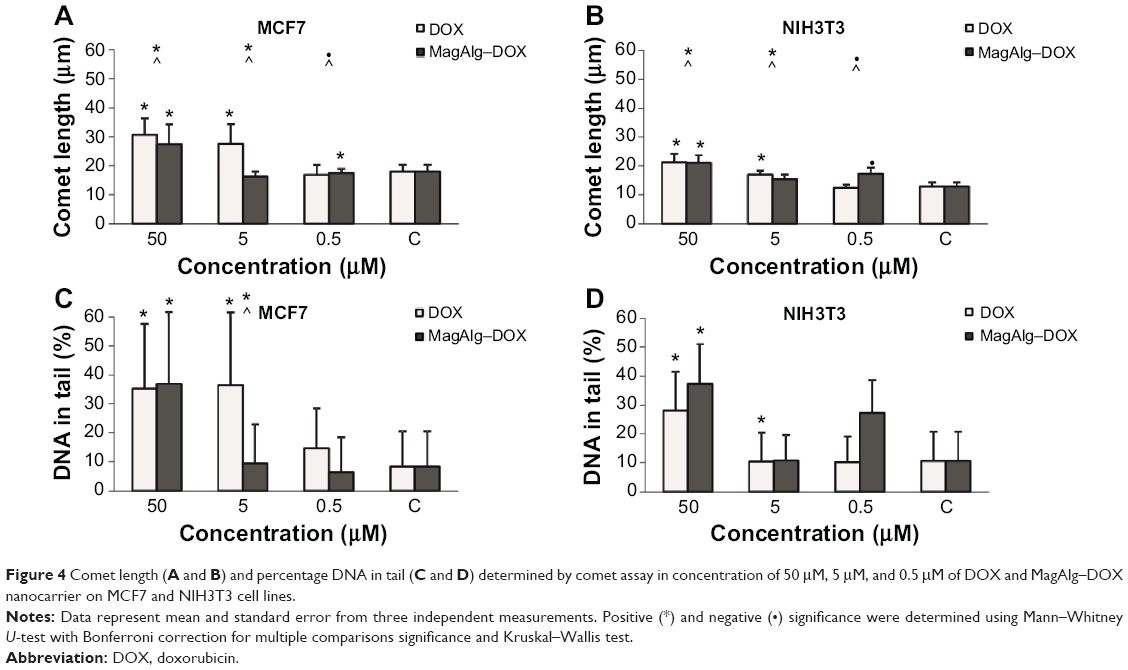 | Figure 4 Comet length (A and B ) and percentage DNA in tail (C and D ) determined by comet assay in concentration of 50 μM, 5 μM, and 0.5 μM of DOX and MagAlg–DOX nanocarrier on MCF7 and NIH3T3 cell lines. Notes: Data represent mean and standard error from three independent measurements. Positive (*) and negative (•) significance were determined using Mann–Whitney U-test with Bonferroni correction for multiple comparisons significance and Kruskal–Wallis test. Abbreviation: DOX, doxorubicin. |
Cell cycle determination experiments, for MagAlg–DOX (at 0.5 μM DOX) in the MCF7 cell line performed after 6 hours of treatment, showed decrease in cell number in phases G0/G1 and S and increase in phase G2/M (Figure 5). Conversely, in the NIH3T3 cell line in the free-DOX group (at 0.5 μM DOX), we found increase in cell number in phases G0/G1 and S and decrease in phase G2/M. In the MCF7 cell line at concentration of 5 μM, the free-DOX group showed decrease in cell number in phase G0/G1 and increase in phases S and G2/M. On the other hand, in the NIH3T3 cell line at a concentration of 5 μM for MagAlg–DOX, we found fewer cells in phases G0/G1 and S and more cells in phase G2/M compared with control. The effect of free DOX on the cell cycle in the MCF7 cell line showed a larger number of cells in phase S and fewer cells in phase G2/M at concentrations of 5 μM and 0.5 μM, unlike the case in the MagAlg–DOX group. The same trend was observed in the NIH3T3 cell line at a concentration of 5 μM.
 | Figure 5 The influence of DOX and MagAlg–DOX nanocarrier in concentration of 5 μM, 0.5 μM, and 0 μM on cell cycle of MCF7 and NIH3T3 cell lines. |
The cells for the free-DOX and the MagAlg–DOX groups showed significant decrease in phosphorylation of histone H3 at all concentrations when compared with the control group in both the cell lines. Greater decrease in phosphorylation of histone H3 was observed for free DOX than for MagAlg–DOX (Figure 6).
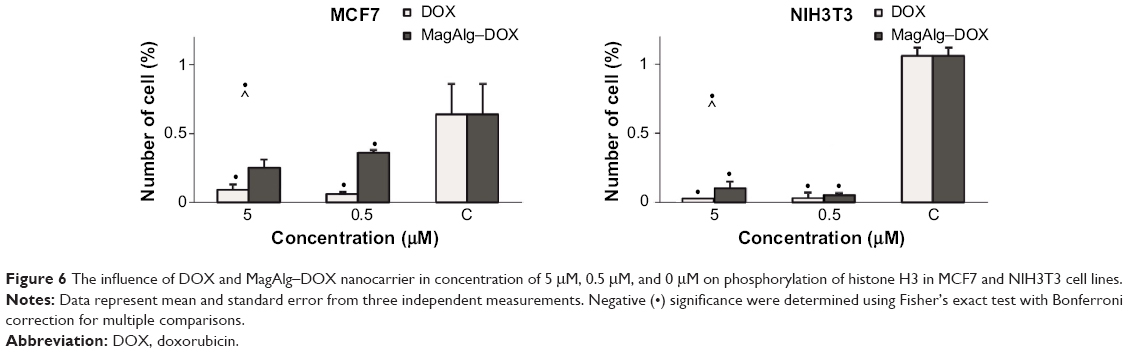 | Figure 6 The influence of DOX and MagAlg–DOX nanocarrier in concentration of 5 μM, 0.5 μM, and 0 μM on phosphorylation of histone H3 in MCF7 and NIH3T3 cell lines. |
The effect of DOX and MagAlg–DOX on the number of apoptotic cells mirrored drug concentration. Greater number of the apoptotic cells was found in the NIH3T3 cell line at all tested concentrations in both DOX and MagAlg–DOX groups. A significantly larger number of apoptotic cells were detected in the free-DOX group (21.5% at 0.5 μM; 24.5% at 5 μM) than in the MagAlg–DOX group (19% at 0.5 μM; 20.2% at 5 μM) in the NIH3T3 cell line. Also, apoptotic cells were detected in the MCF7 cell line in the free-DOX group (14.7% at 0.5 μM; 18.6% at 5 μM) when compared with the MagAlg–DOX group (13.8% at 0.5 μM; 18.1% at 5 μM).
We observed downregulation of C-MYC and C-FOS after DOX treatment in a dose-dependent manner (higher DOX concentration and lower expression were observed) in the case of MCF7 tumor cells. Application of MagAlg–DOX induced return of values closer to the control levels (Figure 7). The effect of MagAlg–DOX on C-MYC expression in NIH3T3 cells was not as marked as in MCF7 cells because NIH3T3 are non-tumor cells, thus with lower response to DOX. For C-FOS expression after treatment in NIH3T3 cells, we observed strong upregulation after treatment with 0.5 μM DOX, but downregulation after treatment with 5 μM DOX. Apparently, the higher C-FOS expression after treatment with lower dose of DOX is a reaction to oxidation or other after treatment stress, since C-FOS is involved in the stress response. On the other hand, 5 μM DOX is probably too high and cells and their DNA are damaged and the process of nucleic acid synthesis is inhibited. Importantly, NPs induced a return of values closer to control levels. C-FOS expression was increased after treatment with 5 μM MagAlg–DOX, probably due to oxidation or other stress, but this increase was not as high as in the case of 0.5 μM DOX only. C-FOS expression after treatment with 0.5 μM MagAlg–DOX was lower than when treated with 0.5 μM free DOX.
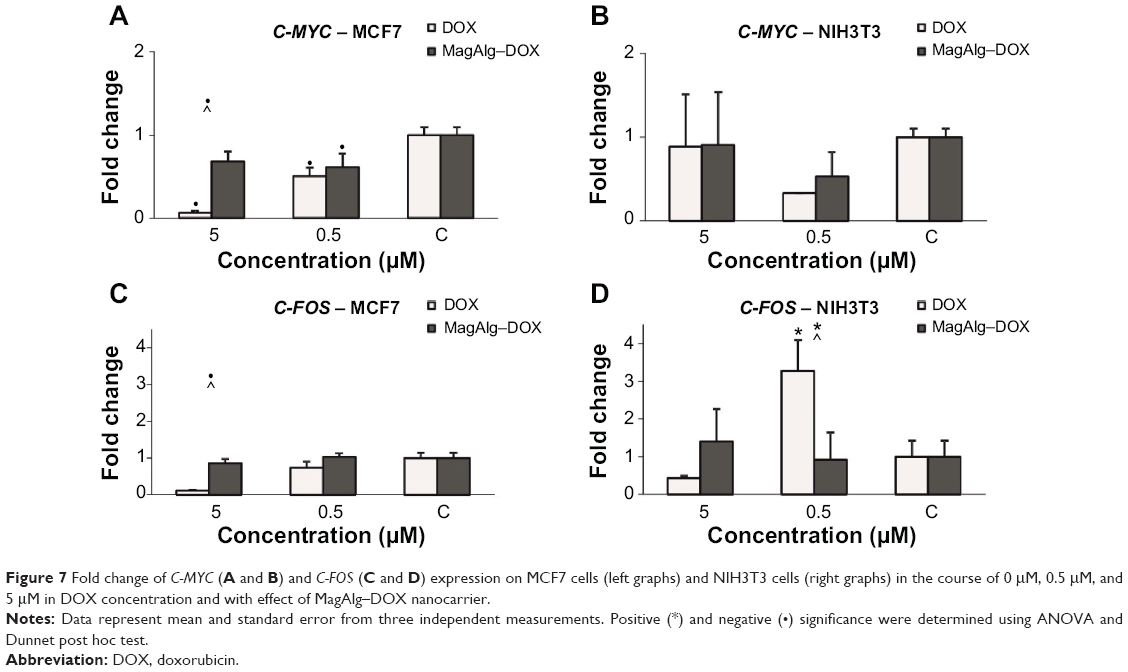 | Figure 7 Fold change of C-MYC (A and B ) and C-FOS (C and D ) expression on MCF7 cells (left graphs) and NIH3T3 cells (right graphs) in the course of 0 μM, 0.5 μM, and 5 μM in DOX concentration and with effect of MagAlg–DOX nanocarrier. |
Microscopic analysis revealed the morphology and distribution of SPIO particles (Figure 8). AFM was used for imaging of individual clusters. The TEM images of the colloidal nanoassemblies demonstrate that densely packed SPIO NPs of MagAlg are arranged into superclusters with a mean size of about 40 nm, while individual crystals have a mean size of 13 nm. From high-resolution TEM analysis (Figure 8) and Mössbauer spectroscopy (data not shown), it is evident that large areas of the clusters are built from crystallographically aligned nanocrystallites of magnetite.
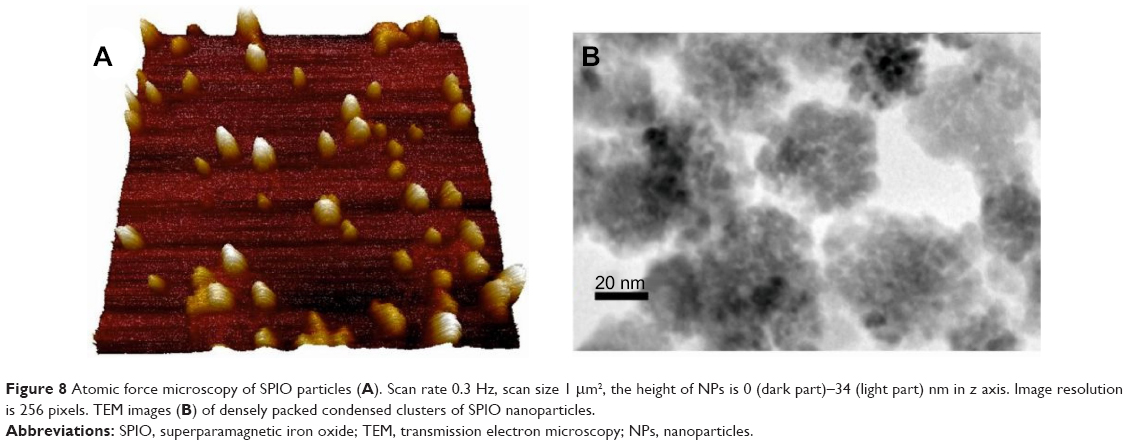 | Figure 8 Atomic force microscopy of SPIO particles (A ). Scan rate 0.3 Hz, scan size 1 μm2, the height of NPs is 0 (dark part)–34 (light part) nm in z axis. Image resolution is 256 pixels. TEM images (B ) of densely packed condensed clusters of SPIO nanoparticles. |
Cell uptake and internalization of free DOX and MagAlg–DOX was monitored at 1 hour, 6 hours, and 24 hours at 0.5 μM, 5 μM, and 50 μM of DOX using fluorescence optical microscopy, since DOX is autofluorescent and emits in the red region of the spectrum. Although, the most relevant results are those imaged after 24 hours of incubation, which is a standard time for MTT assays, it is also important to know the pathways and distribution of samples from the beginning of their administration and observe the morphology and uptake of samples during the cytotoxicity assay. In both the cell lines, free DOX was significantly more effective, that is, the signal was found in the cytoplasm and then in the nucleus faster and more intensely than for MagAlg–DOX. After 1 hour, red DOX fluorescence was clearly visible (Figure 9A), while in the case of MagAlg–DOX, this signal was negligible due to the different internalization pathway. As was described elsewhere,7,12,17,18 SPIO clusters are taken up by endocytosis. Our observation from time-lapse microscopy shows that the cells are waiting till the most appropriate size of cluster composed of SPIO NPs is created for the safe endocytosis (data not shown). After 6 hours of administration of DOX or MagAlg–DOX (Figure 9C), the signal from intracellular cytoplasm was strong in both the cell lines, but fluorescence for free DOX was higher than that for MagAlg–DOX. For both free DOX and MagAlg–DOX, fluorescence signal due to cell internalization was recorded in a dose-dependent manner; with increasing DOX concentration, the intensity of the intracellular fluorescence increased. Fibroblasts generally tolerated larger amounts of DOX in comparison with tumor cells, as can be seen in Figure 9B. Many fibroblasts were still adhered with preserved morphology even at 24 hours after administration of 50 μM of free DOX.
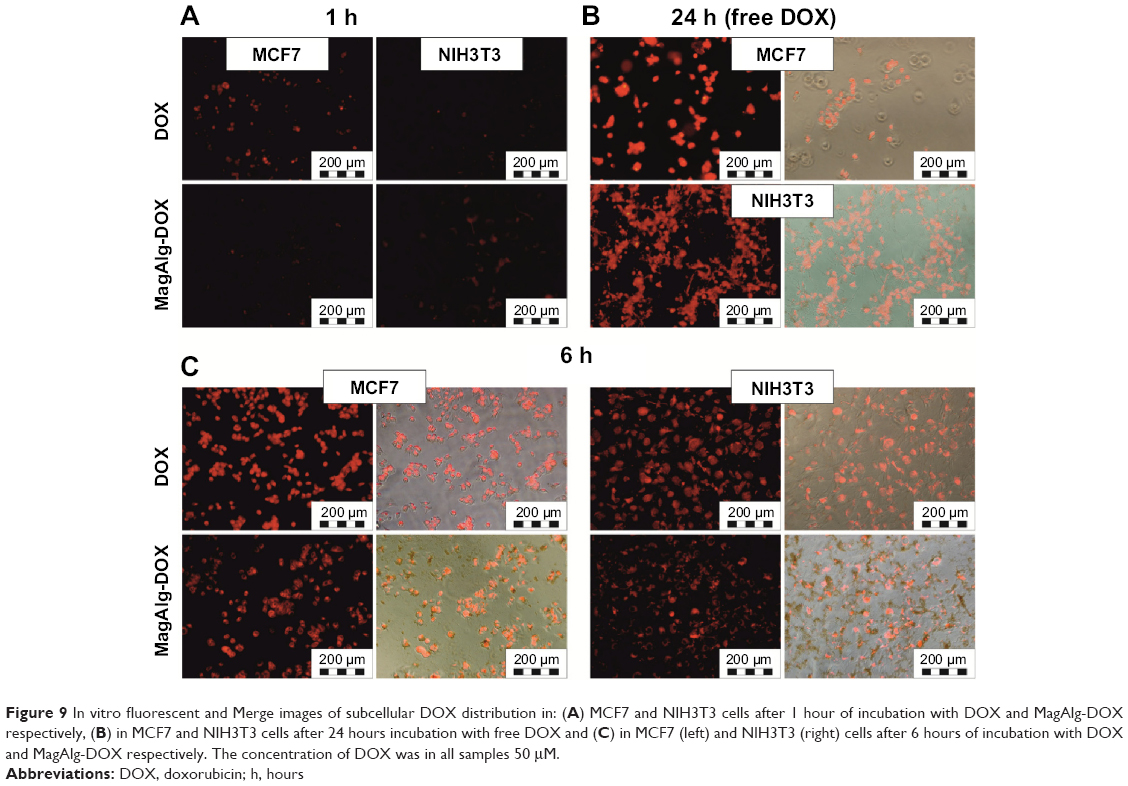 | Figure 9 In vitro fluorescent and Merge images of subcellular DOX distribution in: (A ) MCF7 and NIH3T3 cells after 1 hour of incubation with DOX and MagAlg-DOX respectively, (B ) in MCF7 and NIH3T3 cells after 24 hours incubation with free DOX and (C ) in MCF7 (left) and NIH3T3 (right) cells after 6 hours of incubation with DOX and MagAlg-DOX respectively. The concentration of DOX was in all samples 50 μM. |
Discussion
Iron oxide-based magnetic nanoassemblies are a family of drug delivery systems with high potential due to their low toxicity, size-dependent superparamagnetism, large surface area, and biocompatibility. In this study, we tested a novel MagAlg–DOX nanocarrier and its effects on normal and cancer cell lines. One factor that can contribute to nanotoxicity is the size of the particles. Smaller particles have a greater reactive surface area, are more chemically reactive, and produce higher numbers of ROS than larger particles. This is one of the primary mechanisms of nanotoxicity and it may result in the oxidative stress causing inflammation and damage to proteins, membranes, and DNA.6 The size and surface charge of NPs are important physiochemical parameters in designing drug delivery vehicles. Transition metal ions such as Fe(II) and Fe(III) can generate ROS. Superoxide, produced via normal metabolic processes and redox cycling within the cell, reacts with hydrogen peroxide to form hydroxyl free radicals. The catalysts in the present case are the iron ions on the surface of SPIO. Free radicals generated by SPIO or MagAlg–DOX are responsible for oxidative stress and cell damage (lipid peroxidation and protein oxidation).19
The major mechanism of action of free DOX involves its intercalation in the DNA and inhibition of topoisomerase II. Several secondary mechanisms of DOX action are described as DOX-induced production of ROS.2 Mitochondrially located ROS can also be detected rapidly after DOX administration, most probably due to respiratory chain-produced superoxide radicals.20 One feature of DOX is to produce ROS via one-electron reduction to the corresponding semiquinone free radicals that then react rapidly with oxygen to generate superoxide radical anions.1
The presence of oxidative stress on exposure of cells to SPIO NP may imply DNA damage and the early effect would be evidenced in cell cycle progression.21 Mahmoudi et al determined the cytotoxicity of SPIO particles and their impact on the cell cycle studied with adhesive mouse fibroblast cell line (L929). High concentrations of coated SPIO (up to 400 mM) showed high cell viability. Treated cells had no evidence of necrosis, apoptosis, or cell cycle arrest in concentrations up to 200 mM.6 Therefore, the highest concentration of SPIO (544 μM iron oxide), which we use in our experiments, cannot affect the cell viability or cell cycle.
In the most recent studies, free DOX showed greater cytotoxicity than DOX/POLYMER/SPIO, regardless of DOX concentration. Yang et al observed the cell viability of HeLa cells incubated with DOX/POLYMER/SPIO-loaded vesicles. Viability was decreased with increasing DOX concentration.12 High cytotoxicity is based on successful delivery of DOX into the nuclei of cancer cells.14 As in our study, Fan et al observed that treatment with DOX alone produced a very substantial decrease in cell viability.5 On the other hand, several publications describe the reverse: Kievit et al studied free DOX and DOX-conjugated NPs against wild-type and drug-resistant C6 cells. Their results showed reduced cell viability when treated with DOX-conjugated NPs when compared with cells treated with free DOX.8 In addition, Javid et al studied the cytotoxicity of DOX/POLYMER/SPIO composite in A2780 and OVCAR-3 cell lines using MTT assay. The authors claimed that the incorporation of DOX into SPIO core strongly enhanced the cytotoxic effect of drug when compared with the free drug.11
One explanation for the differences observed on the cytotoxic effects of DOX and SPIO-DOX nanocarriers may be the different transport mechanisms. Free DOX passes from the extracellular to the intracellular matrix by simple passive diffusion and reaches the nucleus easily. In the case of NP-bound DOX, the drug is released from the SPIO surface in lysosomes due to the acidic pH environment and hence DOX can reach the nucleus and intercalate DNA.
DOX significantly damages energy-transferring and -signaling systems like creatine kinase and AMP-activated protein kinase. However, the detailed mechanisms by which DOX interferes with mitochondrial function treatment remain largely unknown. Kuznetsov et al observed mitochondrial change after DOX treatment: shift toward a more oxidized state of mitochondria, decrease in the inner MMP, and elevated mitochondrial calcium level.20
The different effects on the cell cycle may depend on the intracellular location of the NPs and studies report varying results. Magnetite NPs showed oxidative DNA lesions via comet assay and arrest in the G1 phase may be related to the repair of damaged DNA.6 A composite of magnetic NPs and DOX could have the ability to induce apoptosis. However, we discovered decrease in the apoptotic population using MagAlg–DOX nanocarriers in comparison with free DOX. On the other hand, Maeng et al showed an increasing apoptotic population, inhibition of cell proliferation, and angiogenesis on liver cancer cells due to the irreversible DNA damage by SPIO-DOX nanocarriers more than free DOX.22 Chekhun et al found a significant decrease in the cell population in the S-phase together with increasing number of cells in sub G0/G1 phase of the cells treated with DOX-ferromagnetic NPs in vitro.19 Finally, Javid et al observed that DOX/POLYMER/SPIO composite caused a significant amount of apoptosis (84.4% and 80.84%) in A2780 and OVCAR-3 cells compared with the free drug.11
DOX is known to mediate cell cycle arrest in cancer cells, and G0/G1 and G2 cell cycle check points can be regulated by p53. Kuznetsov et al found that DOX inhibits cell proliferation through cell cycle arrest in the G2/M phase in a time- and dose-dependent manner, also causing massive cell death.20 Lüpertz et al observed G2/M arrest and p53/p21 induction after treatment with 1 μM DOX and found G1 arrest accompanied by phosphorylation and activation of p53, but not enhanced expression of p21 after treatment with 5 μM DOX.1 Javid et al observed that NF-κB and bax showed high expression, which caused significant apoptosis in A2780 and OVCAR-3 cell lines, while bcl-2 and surviving proteins had a sharp decrease in both the cell lines in group treated by DOX/POLYMER/SPIO.11
Next, we investigated the effect of DOX and MagAlg–DOX on C-FOS and C-MYC, key genes involved in the regulation of many processes ongoing in the cell. C-FOS is an immediate-early, stress response gene. Fos protein dimerizes with jun proteins and, together with the activating transcription factor, form the transcription factor complex AP-1 (activator protein 1), which binds to DNA. AP-1 participates in the stress response, differentiation, cell proliferation, and cell survival by signal transduction of growth factors in the cytoplasm to the nucleus via the MAP-kinases signaling pathway. C-MYC is a transcription factor of many cell cycle genes (such as late G1 cyclins and cyclin-dependent kinases, essential for transition from G1 to S phase). C-MYC is also a major apoptotic inducer that intervenes in the mitochondrial apoptotic pathway by induction of Cyt c release or by targeting the anti-apoptotic Bcl2-family.23,24 Numerous diverse mechanisms have been suggested for the function of DOX against cancer cells (inhibition of nucleic acid and protein synthesis, DNA-cross-linking, interaction with membrane, and production of ROS).25,26 In any case, DOX has an antiproliferative effect and presumably this is the cause of lower C-MYC and C-FOS expression (as genes involved in cell proliferation and survival). There are many publications on gene expression in the course of treatment with DOX27–31 but, this is the first report of changes in expression pattern in cell cultures NIH3T3 and MCF7 with magnetic NP-conjugated DOX. Our observations on gene expression level are in accordance with our other tests and indicate that NPs can attenuate or even inhibit the effect of DOX, in particular in tumor MCF7 cell line.
The transport process of DOX/POLYMER/SPIO nanocarrier within the cells or cells in vivo is strongly dependent on the type of chemical binding between drug and surface derivatized SPIO NPs. In our case, the planar DOX interacts with alginate shell via electrostatic interactions and hydrogen bonding. Temperature increase causes the weakening of both electrostatic and H-bonding followed by diffusion and release of DOX. In our previous study, it was showed that from the drug-release stimulation, the release of drug without external stimuli is very low. Thus, in view of this fact, when the cells are exposed to the MagAlg–DOX nanocarriers, it is expected that the whole composite is taken into the cells via endocytosis and then transported into acidic endosomes/lysosomes where controlled DOX release takes place.2,8,12
While MagAlg–DOX accumulates throughout the cell and is concentrated in the perinuclear region8 or cytoplasm,12 free DOX accumulates in the cell nucleus. From our microscopic analysis, we observed faster uptake of free DOX compared with MagAlg–DOX. We did not establish the quantitative amount of DOX within the cells during 24 hours but the free DOX is logically more toxic since it goes to the nucleus faster via diffusion compared with MagAlg–DOX. The cytotoxic effect of MagAlg–DOX is therefore delayed compared with free DOX within the 24 hours interval. On the other hand, Zhu et al showed that the uptake amount of the DOX/SPIO composites by the HeLa cells is higher than that of free DOX, which might be related to the different cell internalization pathways of the composites and free DOX.9 Liao et al found that different cell lines (A431 and MDA-MB-453) have different micelle uptake.4 From the observed results, we can assume that subcellular DOX interaction and distribution confirm the interesting potential of MagAlg NPs as controlled delivery carriers for DOX. Our results suggest that strong binding of DOX to SPIO can result in lower cytotoxicity of DOX to the non-cancer and cancer cell lines. Anyway, sometimes in vitro results are difficult to be projected into actual in vivo action. For instance, in our case, lower cytotoxicity apparently results from the very slow release of DOX from the nanocarrier. Otherwise released DOX (released either from MagAlg outside or inside the cell) would result into similar action as of the free drug. Such a slow release might be beneficial in the in vivo scenario, since slow release might provide the necessary time to the nanocarrier to concentrate into the tumor and then release its payload (for example, through a trigger such as hyperthermia, as we have shown successfully for MagAlg in our previous publication).15 On the other hand, systems displaying higher cytotoxicity than the free drug might result into fast in vivo cytotoxic action, unless the drug is released only after specific trigger or must be very selective. Otherwise side effects might be more severe than the free drug. One of the main pathways that magnetic carriers are planned to act is through magnetic targeting, and MagAlg has been proven to be exceptional in magnetic manipulation with external magnetic fields as we have shown in our previous publication.15
As a next step, we will continue with cytotoxic study of this system by using the application of external magnetic field to increase the temperature of the system, which causes the controlled drug release in the desired tumor cells and tissue.
Conclusion
In conclusion, we have shown that in vitro effects of free DOX differed considerably in comparison with MagAlg–DOX nanocarriers after administration to NIH3T3 non-cancer cells and MCF7 cancer cells. The results demonstrated that DOX has higher cytotoxic effect on cells at all used in vitro tests in comparison with MagAlg–DOX nanocarriers. This phenomenon may be attributed to the different pathways that the free drug and the drug loaded on NPs follow in the time up to 24 hours. Our results suggest that DOX and MagAlg–DOX are able to induce cell death by apoptosis. The MCF7 cancer cells are more sensitive to both the free drug and the nanocarrier. Conjugation of DOX to SPIO could reduce the risk of free DOX toxicity.
Acknowledgment
This work was supported by the Grant Project IGA MZCR NT 14060-3/2013, by the Operational Program Research and Development for Innovations – the European Regional Development Fund (CZ.1.05/2.1.00/03.0058), and by the Operational Program Education for Competitiveness – the European Social Fund (CZ.1.07/2.3.00/20.0155, CZ.1.07/2.3.00/20.0183, IGA_PrF_2014017, and CZ.1.05/3.1.00/14.0302). The authors gratefully acknowledge the support by the project LO1304 and LO1305 of the Ministry of Education, Youth and Sports of the Czech Republic.
Disclosure
The authors report no conflicts of interest in this work.
References
Lüpertz R, Wätjen W, Kahl R, Chovolou Y. Dose- and time-dependent effects of doxorubicin on cytotoxicity, cell cycle and apoptotic cell death in human colon cancer cells. Toxicology. 2010;271:115–121. | ||
Gautier J, Munnier E, Paillard A, et al. A pharmaceutical study of doxorubicin-loaded PEGylated nanoparticles for magnetic drug targeting. Int J Pharm. 2012;424:16–25. | ||
Lai JR, Chang YW, Yen HC, et al. Multifunctional doxorubicin/superparamagnetic iron oxide-encapsulated pluronic F127 micelles used for chemotherapy/magnetic resonance imaging. J Appl Phys. 2010;107:09B318. | ||
Liao C, Sun Q, Liang B, Shen J, Shuai X. Targeting EGFR-overexpressing tumor cells using Cetuximab-immunomicelles loaded with doxorubicin and superparamagnetic iron oxide. Eur J Radiol. 2011;80:699–705. | ||
Fan CH, Ting CY, Lin HJ, et al. SPIO-conjugated, doxorubicin-loaded microbubbles for concurrent MRI and focused-ultrasound enhanced brain-tumor drug delivery. Biomaterials. 2013;34:3706–3715. | ||
Mahmoudi M, Simchi A, Imani M. Cytotoxicity of uncoated and polyvinyl alcohol coated superparamagnetic iron oxide nanoparticles. J Phys Chem C. 2009;113:9573–9580. | ||
Bulte JWM, Kraitchman DL. Iron oxide MR contrast agents for molecular and cellular imaging. NMR Biomed. 2004;17:484–499. | ||
Kievit FM, Wang FY, Fang C, et al. Doxorubicin loaded iron oxide nanoparticles overcome multidrug resistance in cancer in vitro. J Control Release. 2011;152:76–83. | ||
Zhu L, Wang D, Wei X, et al. Multifunctional pH-sensitive superparamagnetic iron-oxide nanocomposites for targeted drug delivery and MR imaging. J Control Release. 2013;169:228–238. | ||
Corot C, Robert P, Ideé JM, Port M. Recent advances in iron oxide nanocrystal technology for medical imaging. Adv Drug Deliver Rev. 2006;58:1471–1504. | ||
Javid A, Ahmadian S, Saboury AA, Kalantar SM, Rezaei-Zarchi S, Shahzad S. Biocompatible APTES – PEG modified magnetite nanoparticles: effective carriers of antineoplastic agents to ovarian cancer. Appl Biochem Biotechnol. 2014;173:36–54. | ||
Yang X, Grailer JJ, Rowland IJ, et al. Multifunctional SPIO/DOX-loaded wormlike polymer vesicles for cancer therapy and MR imaging. Biomaterials. 2010;31:9065–9073. | ||
Yang X, Chen Y, Yuan R, et al. Folate-encoded and Fe3O4-loaded polymeric micelles for dual targeting of cancer cells. Polymer. 2008;49:3477–3485. | ||
Yang HM, Oh BC, Kim JH, et al. Multifunctional poly (aspartic acid) nanoparticles containing iron oxide nanocrystals and doxorubicin for simultaneous cancer diagnosis and therapy. Colloids Surf A Physicochem Eng Asp. 2011;391:208–215. | ||
Zoppellaro G, Argiris KN, Polakova K, et al. Theranostics of epitaxially condensed colloidal nanocrystal clusters, through a soft biomineralization route. Chem Mater. 2014;26:2062–2074. | ||
Tomankova K, Kejlova K, Binder S, et al. In vitro cytotoxicity and phototoxicity study of cosmetics colorants. Toxicol In Vitro. 2011;25:1242–1250. | ||
Al Faraj A. Preferential magnetic nanoparticle uptake by bone marrow derived macrophages sub-populations: effect of surface coating on polarization, toxicity, and in vivo MRI detection. J Nanopart Res. 2013;15:1797. | ||
Hong SCH, Lee JH, Lee J, et al. Subtle cytotoxicity and genotoxicity differences in superparamagnetic iron oxide nanoparticles coated with various functional groups. Int J Nanomed. 2011;6:3219–3231. | ||
Chekhun VF, Todor IN, Lukyanova NY, et al. The use of nanoferromagnetics to increase the cytotoxic effect of antitumor drugs. Exp Oncol. 2009;31:163–167. | ||
Kuznetsov AV, Margreiter R, Amberger A, Saks V, Grimm M. Changes in mitochondrial redox state, membrane potential and calcium precede mitochondrial dysfunction in doxorubicin-induced cell death. Biochim Biophys Acta. 2011;1813:1144–1152. | ||
Ishikawa K, Ishii H, Saito T. DNA damage-dependent cell cycle checkpoints and genomic stability. DNA Cell Biol. 2006;25:406–411. | ||
Maeng JH, Lee DH, Jung KH, et al. Multifunctional doxorubicin loaded superparamagnetic iron oxide nanoparticles for chemotherapy and magnetic resonance imaging in liver cancer. Biomaterials. 2010;31:4995–5006. | ||
Ruhdorfer S, Sanovic R, Sander V, Krammer B, Verwanger T. Gene expression profiling of the human carcinoma cell line A-431 after 5-aminolevulinic acid-based photodynamic treatment. Int J Oncol. 2007;30:1253–1262. | ||
Sanovic R, Krammer B, Grumboeck S, Verwanger T. Time-resolved gene expression profiling of human squamous cell carcinoma cells during the apoptosis process induced by photodynamic treatment with hypericin. Int J Oncol. 2009;35:921–939. | ||
Hekmat A, Saboury AA, Divsalar A. The effects of silver nanoparticles and doxorubicin combination on DNA structure and its antiproliferative effect against T47D and MCF7 cell lines. J Biomed Nanotechnol. 2012;8:968–982. | ||
Hekmat A, Saboury AA, Divsalar A, Seyedarabi A. Structural effects of TiO2 nanoparticles and doxorubicin on DNA and their antiproliferative roles in T47D and MCF7 cells. Anticancer Agents Med Chem. 2013;13:932–951. | ||
Malekinejad H, Janbaz-Acyabar H, Razi M, Varasteh S. Preventive and protective effects of silymarin on doxorubicin-induced testicular damages correlate with changes in c-myc gene expression. Phytomedicine. 2012;15:1077–1084. | ||
Johnson NA, Slack GW, Savage KJ, et al. Concurrent expression of MYC and BCL2 in diffuse large B-cell lymphoma treated with rituximab plus cyclophosphamide, doxorubicin, vincristine, and prednisone. J Clin Oncol. 2012;30:3452–3459. | ||
Florou D, Patsis C, Ardavanis A, Scorilas A. Effect of doxorubicin, oxaliplatin, and methotrexate administration on the transcriptional activity of BCL-2 family gene members in stomach cancer cells. Cancer Biol Ther. 2013;14:587–596. | ||
Huang L, Perrault C, Coelho-Martins J, et al. Induction of acquired drug resistance in endothelial cells and its involvement in anticancer therapy. J Hematol Oncol. 2013;6:49. | ||
Jardim BV, Moschetta MG, Leonel C, et al. Glutathione and glutathione peroxidase expression in breast cancer: an immunohistochemical and molecular study. Oncol Rep. 2013;13:1119–1128. |
 © 2015 The Author(s). This work is published and licensed by Dove Medical Press Limited. The full terms of this license are available at https://www.dovepress.com/terms.php and incorporate the Creative Commons Attribution - Non Commercial (unported, v3.0) License.
By accessing the work you hereby accept the Terms. Non-commercial uses of the work are permitted without any further permission from Dove Medical Press Limited, provided the work is properly attributed. For permission for commercial use of this work, please see paragraphs 4.2 and 5 of our Terms.
© 2015 The Author(s). This work is published and licensed by Dove Medical Press Limited. The full terms of this license are available at https://www.dovepress.com/terms.php and incorporate the Creative Commons Attribution - Non Commercial (unported, v3.0) License.
By accessing the work you hereby accept the Terms. Non-commercial uses of the work are permitted without any further permission from Dove Medical Press Limited, provided the work is properly attributed. For permission for commercial use of this work, please see paragraphs 4.2 and 5 of our Terms.