")
Back to Journals » International Journal of Nanomedicine » Volume 10 » Issue 1
In vitro and in vivo effects of graphene oxide and reduced graphene oxide on glioblastoma
Authors Jaworski S, Sawosz E , Kutwin M , Wierzbicki M , Hinzmann M, Grodzik M , Winnicka A, Lipińska L, Wlodyga K, Chwalibog A
Received 16 November 2014
Accepted for publication 20 December 2014
Published 25 February 2015 Volume 2015:10(1) Pages 1585—1596
DOI https://doi.org/10.2147/IJN.S77591
Checked for plagiarism Yes
Review by Single anonymous peer review
Peer reviewer comments 3
Editor who approved publication: Dr Thomas Webster
Sławomir Jaworski,1 Ewa Sawosz,1 Marta Kutwin,1 Mateusz Wierzbicki,1 Mateusz Hinzmann,1 Marta Grodzik,1 Anna Winnicka,2 Ludwika Lipinska,3 Karolina Włodyga,1 Andrè Chwalibog4
1Warsaw University of Life Science, Faculty of Animal Science, Division of Biotechnology and Biochemistry of Nutrition, 2Department of Pathology and Veterinary Diagnostics, Faculty of Veterinary Medicine, Warsaw University of Life Sciences, 3Institute of Electronic Materials Technology, Warsaw, Poland; 4University of Copenhagen, Department of Veterinary Clinical and Animal Sciences, Copenhagen, Denmark
Abstract: Graphene and its related counterparts are considered the future of advanced nanomaterials owing to their exemplary properties. However, information about their toxicity and biocompatibility is limited. The objective of this study is to evaluate the toxicity of graphene oxide (GO) and reduced graphene oxide (rGO) platelets, using U87 and U118 glioma cell lines for an in vitro model and U87 tumors cultured on chicken embryo chorioallantoic membrane for an in vivo model. The in vitro investigation consisted of structural analysis of GO and rGO platelets using transmission electron microscopy, evaluation of cell morphology and ultrastructure, assessment of cell viability by XTT assay, and investigation of cell proliferation by BrdU assay. Toxicity in U87 glioma tumors was evaluated by calculation of weight and volume of tumors and analyses of ultrastructure, histology, and protein expression. The in vitro results indicate that GO and rGO enter glioma cells and have different cytotoxicity. Both types of platelets reduced cell viability and proliferation with increasing doses, but rGO was more toxic than GO. The mass and volume of tumors were reduced in vivo after injection of GO and rGO. Moreover, the level of apoptotic markers increased in rGO-treated tumors. We show that rGO induces cell death mostly through apoptosis, indicating the potential applicability of graphene in cancer therapy.
Keywords: graphene oxide, reduced graphene oxide, toxicity, glioma, apoptosis
Introduction
Glioblastoma multiforme (GBM) is a common, highly aggressive, interparenchymal primary brain tumor, classified as a World Health Organization grade IV astrocytoma.1 It originates from glial cells and is characterized by intensive migration and infiltrative growth. Even after surgical resection and intensive radiotherapy and chemotherapy, the median survival following diagnosis of GBM is only 14.6 months.2 However, there are new experimental strategies for the treatment of glioma, including mechanisms associated with programmed cell death, raising hopes for effective cancer treatments.3 Our recent studies have shown that carbon nanomaterials may have potential applications in cancer therapy.4,5 One of the carbon allotropes that can potentially be used in cancer treatment is graphene. Graphene is a two-dimensional allotrope of carbon. In this material, carbon atoms are densely packed in a regular sp2-bonded atomic-scale hexagonal pattern.6 A unique property of a graphene sheet is the ratio of its thickness to its surface area, which distinguishes this material from all other nanomaterials. Carbon atoms at the edge of graphene platelets have special chemical reactivity, and graphene has a very high ratio of peripheral to central carbon atoms compared with similar materials such as carbon nanotubes.7 An active surface and edges means that graphene can adhere to cell membranes. This connection may block the supply of nutrients, induce stress, and activate apoptotic mechanisms in cancer cells. Graphene and its oxidized forms have drawn intense attention in recent years for biological and medical applications. Both in vitro and in vivo evaluations of the toxicity of graphene oxide (GO) and reduced graphene oxide (rGO) have recently been investigated.7,8 It is now generally accepted that the in vitro cellular toxicity of graphene is closely related to its surface functionalization. Moreover, the reactive groups on graphene surface may facilitate conjugation with various systems, such as polymers,9 biomolecules,10 DNA,11 protein,12 quantum dots,13 and others, imparting GO with multifunctionalities for diverse biological and medical applications.
We achieved promising results in our previous studies with glioma cell lines treated with graphene hydrophobic platelets.14,15 Graphene caused damage to the plasma membrane (lactate dehydrogenase leakage), increased cytotoxicity (trypan blue exclusion, XTT), and induced apoptosis (Annexin V/propidium iodide [PI] staining), thus indicating potential efficacy in brain tumor therapy. In this study, we hypothesized that GO and rGO platelets also have a toxic influence on glioma cells. Two different human cell lines were used, ie, U87 and U118. These lines are characterized by different phenotypes and the activity of genes involved in regulation of the cell cycle.16 The objectives of this study are to measure the toxicity of GO and rGO, and the proapoptotic and necrotic activities of graphene in glioma cells and tumors cultured on chorioallantoic membrane.
Materials and methods
Preparation and characterization of GO and rGO
Graphene powders, GO and rGO, were purchased from the Institute of Electronic Materials Technology (Warsaw, Poland). GO was prepared by a modified Hummers method from acid-washed graphite platelets: 5 g of graphite was added to 125 mL of sulfuric acid and 3.25 g of potassium nitrate was added before the start of the reaction. The mixture was stirred with a mechanical stirrer. Subsequently, the beaker with reagents was kept below 5°C in a water/ice bath while 15 g of potassium permanganate was gradually added. The beaker was taken out of the bath and kept at 30°C–35°C with continuous stirring, then left at room temperature. In the next step, deionized water was added to the stirred mixture so that the temperature did not exceed 35°C. The beaker was put into a water bath at a temperature of 35°C and stirred for another 1 hour. The constantly stirred mixture was then heated to 95°C for 15 minutes. To stop the reaction, 280 mL of deionized water and 5 mL of hydrogen peroxide were added. The mixture was rinsed with hydrogen chloride solution to remove sulfate ions, and then rinsed with deionized water to remove chloride ions.
To prepare the rGO, a water suspension of 50 mg of GO was acidified to pH 1 and heated to 90°C. Next, 12 mL of reducing mixture (0.01 g of ammonium iodide, 9 g of hydrated sodium hypophosphite, and 1.21 g of sodium sulfite dissolved in 100 mL of deionized water) was added. A black material (rGO) immediately precipitated. The product was filtered, washed with deionized water, and dried.
The rGO powder was dispersed in ultrapure water to prepare a 1.0 mg/mL solution. After 45 minutes of sonification, the solution was diluted to different concentrations with 1× Dulbecco’s Modified Eagle’s culture Medium (Sigma-Aldrich, St Louis, MO, USA) immediately prior to exposure to the cells.
The size and shape of the graphene platelets were inspected using a JEM-1220 (JEOL, Tokyo, Japan) transmission electron microscope (TEM) at 80 keV, with a Morada 11 megapixel camera (Olympus Soft Imaging Solutions, Münster, Germany) and a Quantana 200 scanning electron microscope (FEI, Hillsboro, OR, USA).
Samples for the TEM were prepared by placing droplets of hydrocolloids onto formvar-coated copper grids (Agar Scientific, Stansted, UK). Immediately after air-drying the droplets, the grids were inserted into the TEM. The test was performed in triplicate.
Cell cultures and treatments
Human glioblastoma cell lines U87 and U118 were obtained from the American Type Culture Collection (Manassas, VA, USA) and maintained in Dulbecco’s Modified Eagle’s culture Medium containing 10% fetal bovine serum (Life Technologies, Houston, TX, USA) and 1% penicillin and streptomycin (Life Technologies) at 37°C with a humidified atmosphere of 5% CO2/95% air in a DH AutoFlow CO2 air-jacketed incubator (NuAire, Plymouth, MN, USA).
Cell ultrastructure and morphology
U87 and U118 glioma cells were seeded in six-well plates (1×10⁵ cells per well) and incubated for 24 hours. Cells cultured in medium without the addition of GO and rGO were used as the control. Graphene was introduced to the cells at increasing concentrations (5, 10, 20, 50, and 100 μg/mL). Cell morphology was recorded using an optical microscope 24 hours after exposure.
To investigate the cellular ultrastructure, the glioma cells were washed three times with ice-cold phosphate-buffered saline (Sigma-Aldrich). The cells were collected after centrifugation (1,200 rpm for 10 minutes) and prefixed with 2.5% glutaraldehyde, then post-fixed in 1% osmium tetroxide, dehydrated in ethanol gradients, impregnated with epoxy embedding resin (Fluka Epoxy embedding medium kit; Sigma-Aldrich), and cut with an ultramicrotome (EM UC6, Leica Microsystems GmbH, Wetzlar, Germany). Thin sections were post-stained with uranyl acetate and lead citrate and evaluated by TEM.
Cell viability
Cell viability was evaluated using a 2.3-Bis-(2-methoxy-4-nitro-5-sulfophenyl)-2H-tetrazolium-5-carboxyanilide salt (XTT)-based cell proliferation assay kit (Life Technologies, Taastrup, Denmark). U87 and U118 were plated in 96-well plates (5×10³ cells per well) and incubated for 24 hours. The medium was then removed, and GO and rGO samples were introduced to the cells. In the next step, 50 μL of XTT solution was added to each well and incubated for an additional 3 hours at 37°C. The optical density of each well was recorded at 450 nm on an enzyme-linked immunosorbent assay reader (Infinite M200, Tecan, Durham, NC, USA). Cell viability was expressed as the percentage (ODtest − ODblank)/(ODcontrol − ODblank), where ODtest is the optical density of cells exposed to GO and rGO, ODcontrol is the optical density of the control sample, and ODblank is the optical density of wells without glioma cells.
Cell proliferation
Cell proliferation was evaluated using a Cell Proliferation ELISA BrdU kit (Roche Diagnostics GmbH, Mannheim, Germany). U87 and U118 glioma cells were plated in 96-well plates (5×10³ cells per well) and incubated for 24 hours. The medium was then removed, and GO and rGO samples were introduced to the cells. BrdU reagent was added to each well and incubated for 4 hours. At the end of this period, the next stages were performed according to the company’s protocol. The absorbance was measured at 450 nm using enzyme-linked immunosorbent assay reader (Infinite M200, Tecan).
Apoptosis/necrosis assay
An Annexin V/PI assay (Alexa Fluor® 488 Annexin V/Dead Cell Apoptosis Kit with Alexa Fluor 488 Annexin V and PI for flow cytometry, Life Technologies) was performed to examine whether the cell death occurred by apoptotic or necrotic pathways. After 24 hours of incubation of U87 and U118 glioma cells in 75 mL flasks (1×10⁶ cells per flask), the medium was removed, and GO and rGO samples were added at 100 μg/mL. After further 24 hours of incubation, the medium was removed and the cells were washed in ice-cold phosphate-buffered saline. Harvested cells were suspended in 100 μL of Annexin binding buffer (Invitrogen, Carlsbad, CA, USA), and subsequently 5 μL of Annexin V linked with Alexa Fluor 488 and 1 μL of PI were added (Invitrogen, Carlsbad, CA, USA). Cells were analyzed using FACStrak (Becton Dickinson, Heidelberg, Germany; SimulSet software), measuring the fluorescence emission at 530 nm and 575 nm (or equivalent) using excitation at 488 nm.
Culture of GMB on a chorioallantoic membrane
The fertilized eggs (Gallus gallus; n=60) were supplied by a commercial hatchery (Debowka, Poland). After 6 days of egg incubation, a silicone ring containing 3–4×10⁶ U87 glioma cells suspended in 30 μL of culture medium was placed on the chorioallantoic membrane. The eggs were incubated for the following 7 days, and then divided into three groups (n=20 each): GO and rGO groups injected with 200 μL of 500 μg/mL solutions, and the control group (not injected). The solutions were injected directly into the tumor tissue. After 3 days, the tumors were resected for further analysis.
Measurement of tumor volume
A stereomicroscope (SZX10, CellD software version 3.1; Olympus Corporation, Japan) was used to take digital photographs of the tumors. The measurements were taken with cellSens Dimension Desktop version 1.3 (Olympus). The tumor volumes were calculated using the following equation:
|

Histological and immunohistochemical analysis
After resection, tumors were fixed in 4% buffered formalin (Sigma-Aldrich). Samples were dehydrated and embedded in paraffin (Sigma-Aldrich). Sections 5 μm in thickness were placed on poly-L-lysine-coated slides (Equimed, Krakow, Poland) and stained with hematoxylin and eosin. Cells and tissues were measured using an optical microscope (DM750; Leica Microsystems) and LAS EZ version 2.0 software. Morphometric estimation and image analysis were done using 20 measurements of each sample at 400× magnification. The mitotic index was evaluated as the number of mitotic figures in ten visual fields. For immunohistochemical analysis, frozen (–80°C) tumors were cut on a cryostat (CM1900; Leica Microsystems) into 5 μm thick sections and put on microscopic slides covered with poly-L-lysine (Equimed). The slides were fixed in 4% paraformaldehyde for 30 minutes and then in 0.5% Tween® 20 (Bio-Rad Laboratories, Hercules, CA, USA) for 5 minutes. Fixed slides were kept at –20°C until further processing. Specimens were hydrated with 10 minutes of incubation in phosphate-buffered saline at room temperature. The slides were stained in the dark, using a solution containing 1 μg/mL 4,6-diamidino-2-phenylindole (DAPI; Sigma-Aldrich) in phosphate-buffered saline. The incubation lasted for 20 minutes and was followed by a triple rinse of the slides with phosphate-buffered saline. The specimens were then coverslipped using ProLong® Gold Antifade Reagent (Life Technologies). Fixed preparations were hydrated for 10 minutes in phosphate-buffered saline at room temperature. Specimens were incubated in a solution containing 2% goat serum (Sigma-Aldrich) and 1% bovine serum albumin (Sigma-Aldrich) for 20 minutes at room temperature to block nonspecific binding, then with the primary antibody (catalog number NB100-56708, Novus Biologicals, Aachen, Germany) diluted 1:500 for 24 hours at 4°C. Excess antibodies were washed off with three rinses of phosphate-buffered saline, and the secondary antibody (anti-rabbit immunoglobulin Alexa488-conjugated produced in goat; catalog number 4412, Cell Signaling Technology Inc, Danvers, MA, USA), diluted 1:1,000, was applied. After a triple rinse of the slides in phosphate-buffered saline, the slides were stained with DAPI.
TEM analysis of tumors
Tumor tissues were cut immediately after dissection into pieces of approximately 1 mm3 and fixed using a 2.5% glutaraldehyde solution (Sigma-Aldrich) in 0.1 M phosphate-buffered saline (pH 6.9). The samples were washed in the same buffer and transferred to a 1% osmium tetroxide solution (Sigma-Aldrich) in 0.1 M phosphate-buffered saline (pH 6.9) for 1 hour, then washed in distilled water, dehydrated in ethanol gradients, and impregnated with epoxy embedding resin (Fluka Epoxy embedding medium kit; Sigma-Aldrich). The next day, the samples were embedded in the same resin and baked for 24 hours at 36°C, then transferred to a 60°C incubator and baked for a further 24 hours. The blocks were cut into ultrathin sections (50–80 nm) using an ultramicrotome (Ultratome III; LKB Products, Uppsala, Sweden) and transferred onto 200-mesh copper grids (Agar Scientific Ltd, Stansted, UK). Sections were contrasted using uranyl acetate dihydrate (Sigma-Aldrich) and lead citrate [lead (II) citrate tribasic trihydrate; Sigma-Aldrich], and examined by TEM.
Western blot analysis
Tumor protein levels (caspase-3, Bcl-2, Beclin 1, and nuclear factor kappa B) were examined by Western blot analysis. Protein extracts were prepared with TissueLyser LT (Qiagen, Hilden, Germany) using ice-cold RIPA buffer (150 mM sodium chloride, 0.5% sodium deoxycholate, 1% NP-40, 0.1% sodium dodecyl sulfate, 50 mM Tris, pH 7.4) with protease and phosphatase inhibitors (Sigma-Aldrich). The protein concentration was determined by the Total Protein Kit, Micro Lowry, Peterson’s Modification (Sigma-Aldrich). An equal volume (50 mg) of samples was denatured by addition of sample buffer (Bio-Rad Laboratories, Munich, Germany) and boiled for 4 minutes. Proteins were resolved under reductive conditions with sodium dodecyl sulfate polyacrylamide gel electrophoresis and transferred onto a polyvinylidene difluoride membrane (Life Technologies, Gaithersburg, MD, USA). Protein bands were visualized with the GelDoc scanner (Bio-Rad Laboratories, Munich, Germany), using the fluorescent method of the WesternDot Kit (Life Technologies) and the primary antibodies nuclear factor kappa B (catalog number NBP1-77395, Novus Biologicals, Cambridge, UK), Bcl-2 (catalog number NB100-92142, Novus Biologicals), caspase-3 (catalog number NB100-56708, Novus Biologicals), and Beclin 1 (catalog number 3495, Cell Signaling Technology Inc) with glyceraldehyde-3-phosphate dehydrogenase (catalog number NB300-327, Novus Biologicals) as the loading control (dilutions recommended by the producers). Protein bands were characterized using Quantity One 1-D analysis software (Bio-Rad Laboratories, Germany).
Statistical analysis
The data were analyzed using monofactorial and multifactorial analysis of variance with Statgraphics® Plus 4.1 (StatPoint Technologies, Warrenton, VA, USA). The differences between groups were tested using Tukey’s multiple range tests. All mean values are presented with the standard deviation or standard error. Differences with P<0.05 were considered significant.
Results
Characterization of GO and rGO
Figure 1 shows representative TEM and scanning electron microscopic images of GO and rGO platelets. Most of the graphene platelets were visible as a single layer or a few layers. The shape of rGO and GO platelets was irregular, and their edges were jagged. Hydrophilic GO platelets formed a single layer and hydrophobic rGO platelets often created agglomerates. The thickness of platelets was at a nanoscale, but the surface was not. The surface diameter of the GO platelets ranged from 100 nm to 10 μm after sonification. The rGO platelets were smaller, ranging from 100 nm to 1.5 μm in diameter, but agglomerates were more than 5 μm in diameter.
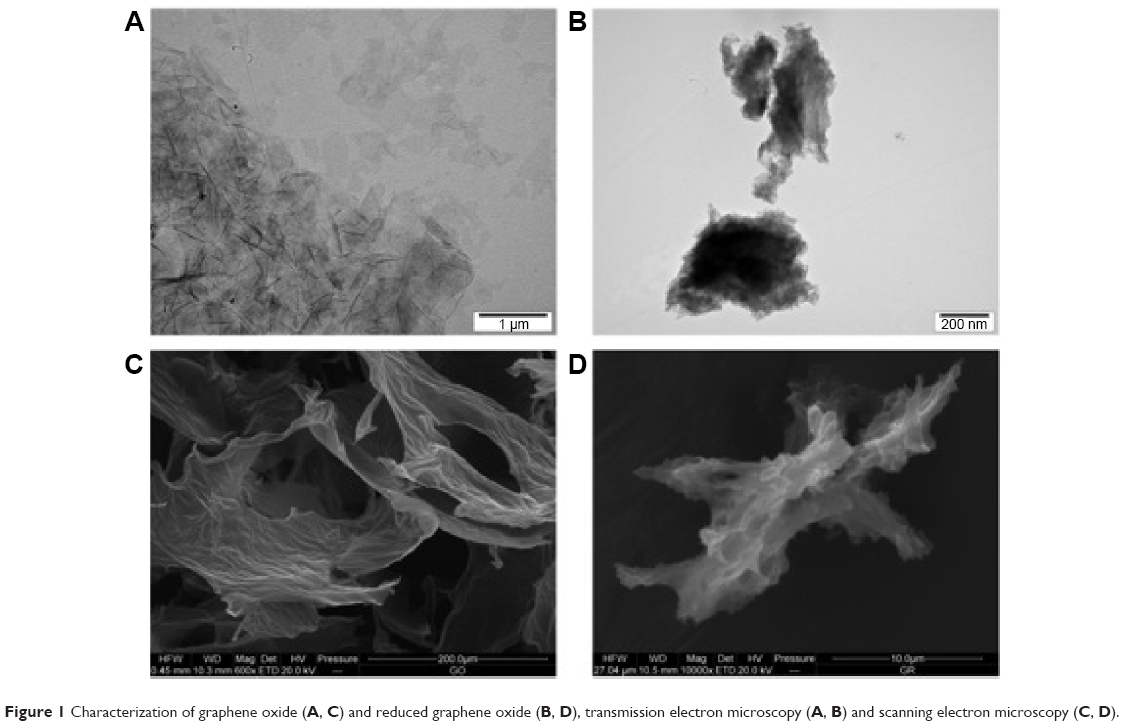 | Figure 1 Characterization of graphene oxide (A, C) and reduced graphene oxide (B, D), transmission electron microscopy (A, B) and scanning electron microscopy (C, D). |
Cell morphology
In both glioma cell lines, it was noticeable that GO and rGO agglomerates attached to the cell body but not to protrusions. The GO-treated cells looked similar to the control group. There was a clear difference between the rGO-treated cells and the control cells. The rGO-treated cells were more oval, denser, and their protrusions were shorter in comparison with the control cells (Figure 2).
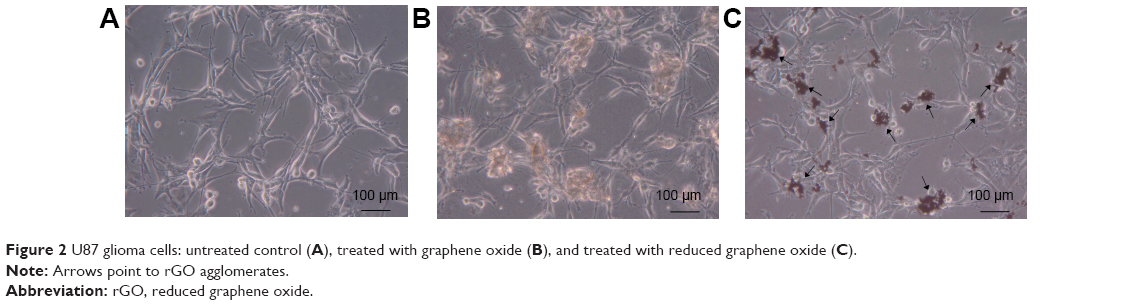 | Figure 2 U87 glioma cells: untreated control (A), treated with graphene oxide (B), and treated with reduced graphene oxide (C). |
Cell viability
Increased concentrations of GO and rGO resulted in decreased vitality in both glioma cell types. In GO-treated samples, the lowest vitality was observed at a concentration of 100 μg/mL, ie, 72%±4.6% in U87 cells and 78%±9.1% in U118 cells (Figure 3A and B). In samples treated with rGO, the lowest vitality was also observed at a concentration of 100 μg/mL, ie, 36%±6.3% and 49%±7.9% in U87 and U118 cells, respectively.
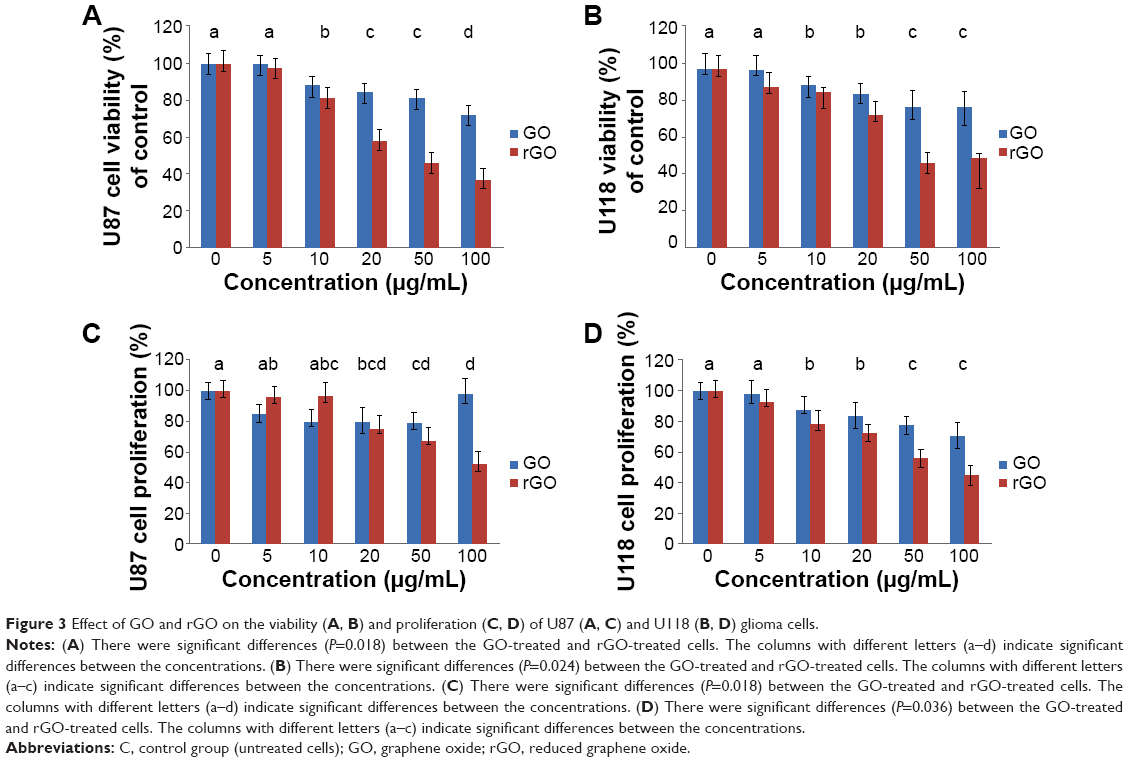 | Figure 3 Effect of GO and rGO on the viability (A, B) and proliferation (C, D) of U87 (A, C) and U118 (B, D) glioma cells. |
Cell proliferation
Increased concentrations of GO and rGO resulted in decreased cell proliferation in both glioma cell types. In GO-treated U87 cells, the lowest proliferation of 80%±10.2% was observed at a concentration of 50 μg/mL; in U118 cells, the lowest proliferation of 71%±7.8% was observed at a concentration of 100 μg/mL. In rGO-treated samples, the lowest proliferation was observed at a concentration of 100 μg/mL, ie, 52%±7.6% and 45%±10.2% in U87 and U118 cells, respectively (Figure 3C and D).
Apoptosis assay
GO induced apoptosis to a small degree in U87 and U118 glioma cells (12%±2.1% in U87 cells and 10.5%±1.9% in U118 cells). rGO induced apoptosis to a higher degree. The degree of apoptosis was similar in U87 and U118 glioma cells (58%±2.8% in U87 and 51%±2.5% in U118). The degree of necrosis was 1.8%±0.4% in U87 and 1.7%±0.6% in U118 cells (Figure 4).
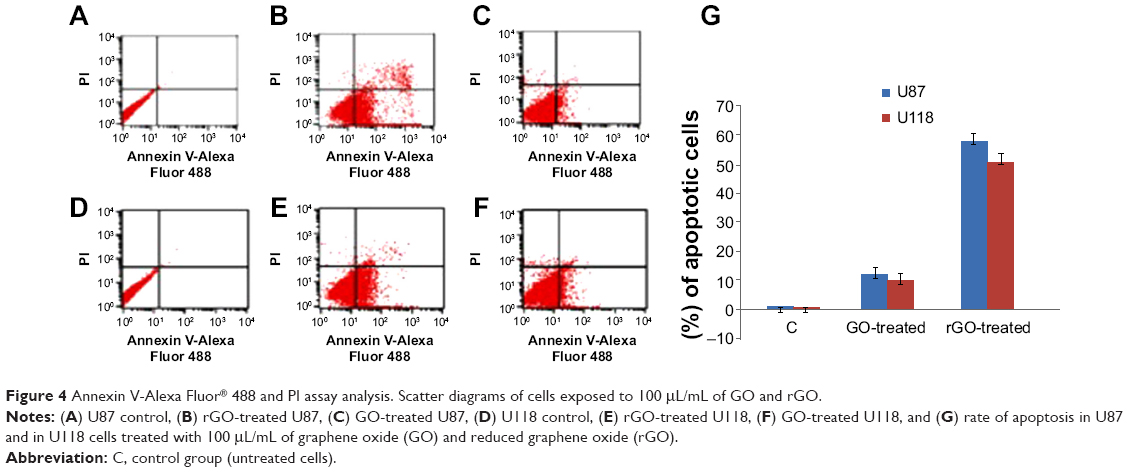 | Figure 4 Annexin V-Alexa Fluor® 488 and PI assay analysis. Scatter diagrams of cells exposed to 100 μL/mL of GO and rGO. |
TEM analysis of cells
The electron microscopic images of all groups (control, GO, rGO) showed a typical ultrastructure of glioma cells. They had oval bodies, a rough endoplasmic reticulum, vacuoles, and groups of endocytotic vesicles (Figure 5). The nuclei were elongated and had an irregular shape and unevenly distributed chromatin. Parts of the nuclei contained spheroid bodies composed of granular material. Each cell line had mitochondria that varied in size and shape, but most were usually oval or elongated. We observed that GO and rGO caused changes in the cell ultrastructure. A fraction of glioma cells was deformed. Inside the cell, cell structures also had different morphology compared with the control group. Endoplasmic reticulum was less visible in both treated groups. GO-treated cells had a greater number of vacuoles than those in the control group. We also found GO and rGO platelets inside the cells; GO in both vacuoles and cytoplasm, rGO only in cytoplasm. In rGO-treated cells, we saw degradation of the mitochondria, rounded nuclei with dispersed chromatin, and vacuoles in the cytoplasm.
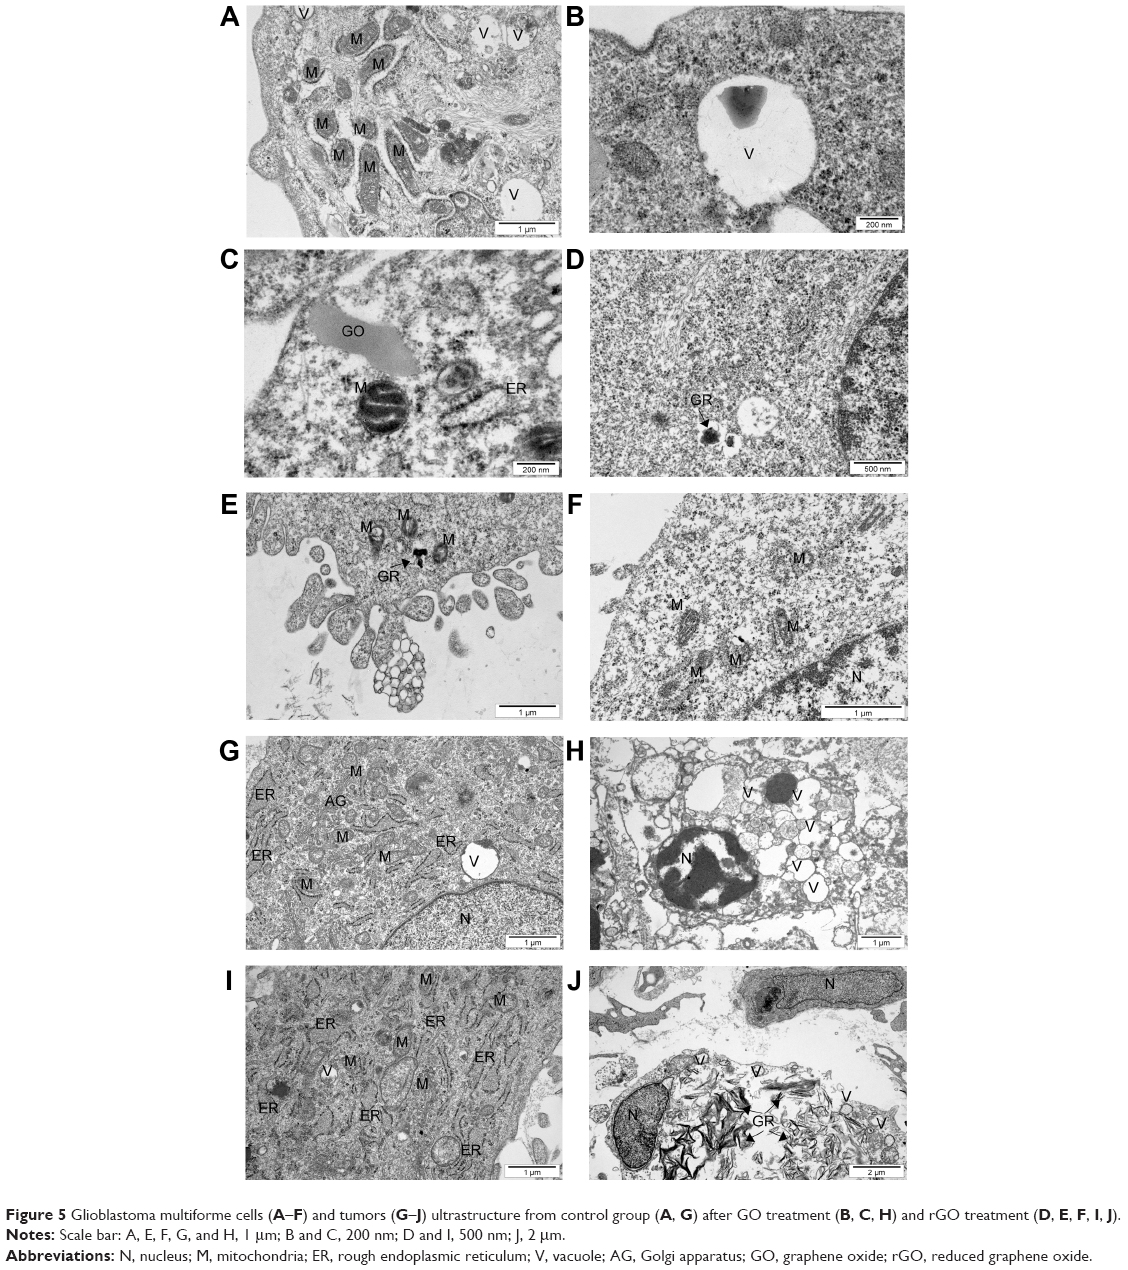 | Figure 5 Glioblastoma multiforme cells (A–F) and tumors (G–J) ultrastructure from control group (A, G) after GO treatment (B, C, H) and rGO treatment (D, E, F, I, J). |
Analysis of tumor
The glioblastoma invaded chorioallantoic membrane along its vessels. In many cases, tumors were observed outside the silicone ring. U87 tumors had an oval shape and visible blood vessels on the surface (Figure 6A–C). A decrease in tumor weight and volume was observed in both treated groups (Table 1). In the GO group, the weight decreased by 41% and the volume by 43% compared with the control group; in the rGO group, the weight decreased by 35% and the volume reduced the weight by 42% (P<0.05 for all comparisons).
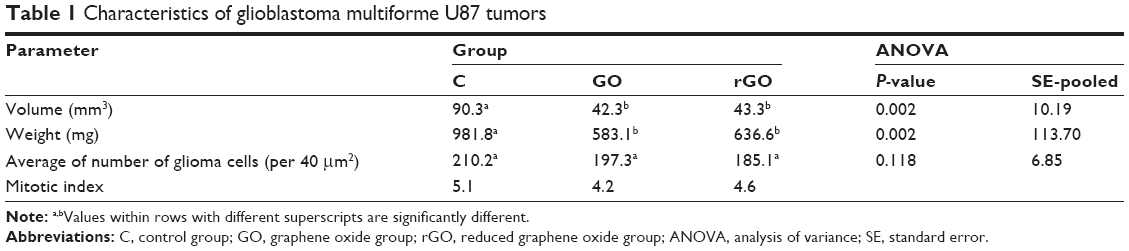 | Table 1 Characteristics of glioblastoma multiforme U87 tumors |
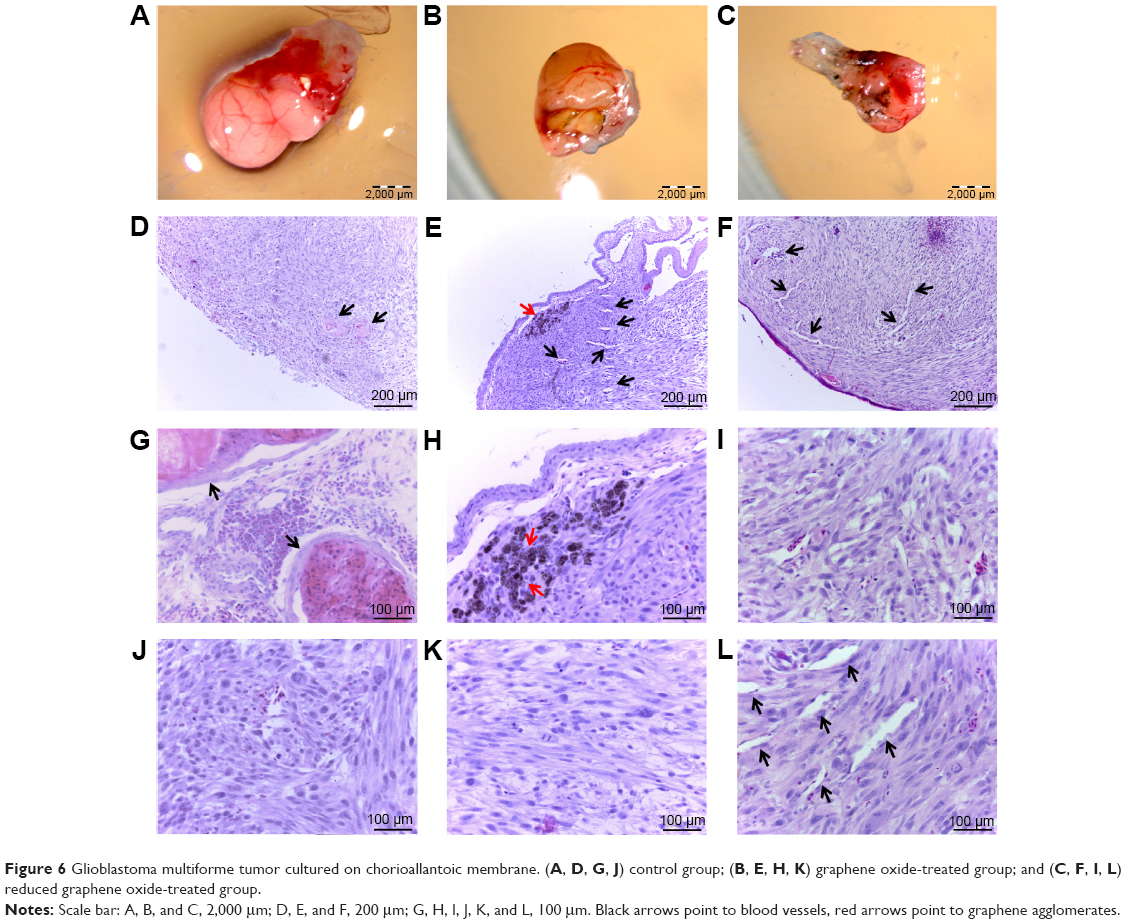 | Figure 6 Glioblastoma multiforme tumor cultured on chorioallantoic membrane. (A, D, G, J) control group; (B, E, H, K) graphene oxide-treated group; and (C, F, I, L) reduced graphene oxide-treated group. |
Histological and immunohistological analysis
Microstructure in all groups was similar. The size and shape of U87 cells were highly polymorphic (Figure 6D–L). All pictures of glioma histology were characterized by the presence of different cells with small and larger atypical nuclei and a high ratio of nucleus to cytoplasm. Histological analysis revealed the presence of multinucleated giant cells. In treated tumors, graphene platelets were visible between glioma cells. There were no differences among groups in the average number of glioma cells per 40 μm2. In the control group we observed well-developed blood vessels. In the GO-treated and rGO-treated groups the vessels were smaller. All tumors showed high mitotic activity; the mitotic index varied from 4.2 in the GO group and 4.6 in the rGO group to 5.1 in the control group. Caspase-9 staining showed greater expression of this protein in the rGO-treated group than in the control group (Figure 7).
 | Figure 7 Protein expression level. |
TEM analysis of tumors
The electron microscopy images of GBM tumors showed a typical ultrastructure of glioma cells, epithelium cells, and erythrocytes. Glioma cells had elongated bodies. Cell structures (nucleus, mitochondria, vacuoles, Golgi apparatus, rough endoplasmic reticulum) were visible in the control group. Well-developed endoplasmic reticulum and numerous secretory and endocytotic vesicles demonstrated high secretory activity of glioma cells and intensive cellular metabolism. The morphology of the glioma cells in GO-treated and rGO-treated groups differed from the control group (Figure 5). In treated groups, we found rGO and GO platelets inside cells. Large empty spaces were visible between glioma cells. Treated cells had irregular shapes, and cell structures were morphologically different from those in the control group. There were fewer of the organelles needed for regular metabolism. In the rGO-treated group, endoplasmic reticulum was less visible and mitochondrial crests were destroyed. Some cells were almost completely filled with graphene, and we could not see most of the cellular structures. In the GO-treated group, most cellular structures (nucleus, mitochondria, membranes) were destroyed, appearing as if cut. The ultrastructural images of these cells showed vesicles characteristic of autophagy.
Western blot analysis
There were no differences in the expression of Beclin 1, Bcl-2, and nuclear factor kappa B between the control and treated groups. However, expression of caspase-3 in the rGO-treated increased by 96% compared with the control group (Figure 7; Table 2).
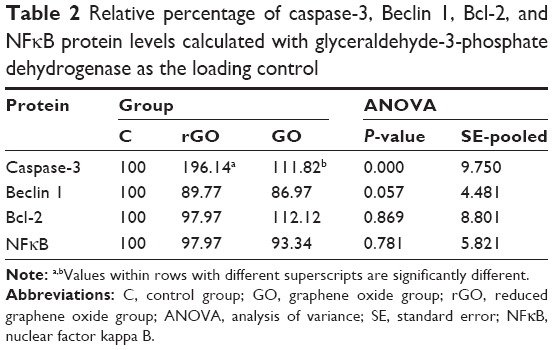 | Table 2 Relative percentage of caspase-3, Beclin 1, Bcl-2, and NFκB protein levels calculated with glyceraldehyde-3-phosphate dehydrogenase as the loading control |
Discussion
In this work, we compared the effects of GO and rGO in glioma cells. We used well-established in vitro and chicken embryo chorioallantoic membrane models.17 It has recently been demonstrated that both surface chemistry and size of graphene platelets play a key role in the toxicity, distribution, and excretion of graphene and that, therefore, different graphene materials may have different influences on the organism.18 GO is well dispersed in water while rGO is hydrophobic, often creating agglomerates in water. The formation of hydrogen bonds between polar functional groups on the GO surface and water molecules creates a stable GO colloid, indicating potential advantages of using graphene in biomedicine19 comparing with other carbon-based materials.20 Images of GO and rGO showed that the thickness of platelets was characteristic for graphene, but rGO platelets created agglomerates. Although the surface diameter of platelets was between 100 nm and 1.5 μm for GO and between 100 nm and 10 μm for rGO, nanoplatelets of GO and rGO smaller than 200 nm were observed inside the U87 and U118 cells. This contrasts with the work of Chang et al21 who did not observe entry of GO into A549 cells. We also noted a strong tendency for the graphene platelets to cluster close to the body of the cells, indicating a strong affinity of both types of graphene for the cells, as previously demonstrated by Chwalibog et al,22 Liao et al23 and Jaworski et al.14 Microscopic visualization of interactions between graphene and glioma cells showed that both GO and rGO platelets adhered to the cells. Moreover, the platelets were usually connected to the cell body, not to its protrusions, as in our previous studies.14 The rGO-treated cells were more oval and denser, and their protrusions were shorter in comparison with the control cells.
Assessment of cell viability showed a toxic influence of rGO on glioma cells. Thus, our results indicate that GO is highly biocompatible, consistent with other studies.10,25,26 Our results collectively demonstrate that the surface and functionalization of graphene play a key role in the physicochemical characteristics and thereby the biocompatibility of different graphene materials. In addition to the dependence of toxicity on surface functionalization, the size and dose of graphene also influence cellular toxicity. For example, exposure of A549 cells to GO did not show cell uptake, although size-dependent cytotoxicity and dose-dependent oxidative stress were observed.21 Furthermore, Akhavan et al27 in an investigation using human mesenchymal stem cells demonstrated that the cytotoxicity and genotoxicity of GO platelets depended on the size and dose of GO.
Similar to other results, the concentrations of GO applied in this study did not result in significant differences in the formation of apoptotic cells. There were no obvious cytotoxicity effects or apoptosis activation when GO was administered at low concentrations to human-derived cell lines, A549 and SH-SY5Y.26,28 However, in murine RAW 264.7 macrophages, GO induced cytotoxicity through depletion of the mitochondrial membrane potential, increasing production of intracellular reactive oxygen species and triggering apoptosis.29 In this study, we observed induction of apoptosis but not necrosis in rGO-treated cells. The number of apoptotic cells was higher in the U87 cell line than in the U118 cell line. Activation of apoptosis processes was also observed in rGO-treated U87 tumors, where expression of caspase-3 was higher by 96%. Apoptosis is a coordinated process that can be triggered through two different pathways: the death receptor pathway located on the cell membrane and the mitochondrial pathway. Theoretically, both of these pathways could be triggered because rGO platelets could interact with death receptors on the cell membrane, and we also observed degradation of mitochondria in rGO-treated cells. rGO may also interact with cell membrane surface receptors to block the transport of various substances into the cell, inducing cellular stress and apoptosis. The mechanism of apoptosis is still unknown, but it is certain that gene p53 is not involved in activation of apoptosis because of mutations of this gene in the U118 cell line.30 This suggests that there must be another mechanism. Zhu and Weiss,31 in studies with murine protein in primary cultured cells, have demonstrated that inactivation of Hus1 protein leads to chromosomal instability during DNA replication, triggering apoptosis and impairing proliferation through p53-independent mechanisms. In our case, it is likely that Hus1 protein was blocked, causing apoptosis without activation of the p53 gene. Li et al29 suggested that the mitochondrial pathway might be the dominant mechanism underlying pristine graphene-induced apoptosis. They assumed that pristine graphene altered mitochondrial integrity via a mechanism related to the activation of a proapoptotic member of the Bcl-2 family (Bim, Bax, Bcl-2) and the mitogen-activated protein kinase cascades. Although changes in mitochondria (lower number and damage) were observed in rGO-treated cells and U87 glioma tumors, we did not observe any differences in the expression of Bcl-2 protein between control and treated groups, indicating that this gene is not involved in activation/repression of apoptosis.
In the present study, GO and rGO solutions were injected directly into the tumor tissue in a particular dose. We assumed that injection into the tumor would restrict the toxicity of graphene only to the target tissue. Nevertheless, the method of administration and the chosen dose might only be relevant for the present model, and administration and effective doses for human treatments must be evaluated in further investigations. We observed a decrease in tumor growth in weight and volume. In GO-treated tumors, weight decreased by 41% and volume by 43%, while in rGO-treated tumors, weight was reduced by 35% and volume by 42% compared with the control group. However, the average number of glioma cells per 40 μm2 area did not differ between the control and treated groups. Reduction of mass and volume has previously been measured in U87 tumors treated with nanodiamond,4 probably caused by inhibition of angiogenesis.32 However, in our study, the reduction in weight and volume is not related to angiogenesis but to apoptosis in rGO treatments, and to lower proliferation in both GO-treated and rGO-treated groups. Furthermore, Wierzbicki et al5 demonstrated that graphene had no antiangiogenic properties. We propose that reduction of mass and volume in treated tumors is associated with lower proliferation, supported by the BrdU assay and mitotic index. In GO-treated tumors, we observed significant damage to cell organelles, but Western blot and immunohistochemistry analyses did not show activation of apoptotic and necrotic pathways. The destruction of organelles may be due to the specific physical properties of GO. GO is permeable to water33,34 but during specific filtration inside the cell, suspended substances on the surface of GO may be retained and disturb the metabolism of the cell.
Conclusion
Our in vitro results indicate that GO is less toxic to glioma cells than rGO. rGO induced cell death mostly through the apoptosis pathway, suggesting the potential applicability of graphene in cancer therapy. The contact between rGO and glioma cell membranes may be the key cause of rGO toxicity. The in vivo results demonstrated that both GO and rGO injected into glioblastoma tumors decreased the volume and weight of tumors. These findings demonstrate that the interaction between graphene platelets and glioma cells in tumors that leads to their severe toxicity depends on the form of the graphene surface.
Acknowledgment
This work was supported by the Polish National Research Council (grant NCN Preludium 2013/09/N/NZ9/01898).
Disclosure
This paper is a part of Slawomir Jaworski’s PhD thesis. The authors report no conflict of interest in this work.
References
Bernardi A, Frozza RL, Hoppe JB, et al. The antiproliferative effect of indomethacin-loaded lipid-core nanocapsules in glioma cells is mediated by cell cycle regulation, differentiation, and the inhibition of survival pathways. Int J Nanomedicine. 2013;8:711–728. | ||
Shakur SF, Bit-Ivan E, Watkin WG, Merrell RT, Farhat HI. Multifocal and multicentric glioblastoma with leptomeningeal gliomatosis: a case report and review of the literature. Case Rep Med. 2013;2013:1–8. | ||
Tabunoki H, Saito N, Suwanborirux K, Charupant K, Satoh J. Molecular network profiling of U373MG human glioblastoma cells following induction of apoptosis by novel marine-derived anti-cancer 1,2,3,4-tetrahydroisoquinoline alkaloids. Cancer Cell Int. 2011;12(1):14. | ||
Grodzik M, Sawosz E, Wierzbicki M, et al. Nanoparticles of carbon allotropes inhibit glioblastoma multiforme angiogenesis in ovo. Int J Nanomedicine. 2011;6:3041–3048. | ||
Wierzbicki M, Sawosz E, Grodzik M, Prasek M, Jaworski S, Chwalibog A. Comparison of anti-angiogenic properties of pristine carbon nanoparticles. Nanoscale Res Lett. 2013;8:195. | ||
Geim AK, Novoselov KS. The rise of graphene. Nat Mater. 2007;6:183–191. | ||
Uo M, Akasaka T, Watari F, Sato Y, Tohji K. Toxicity evaluations of various carbon nanomaterials. Dent Mater J. 2011;30:245–263. | ||
Guo X, Mei N. Assessment of the toxic potential of graphene family nanomaterials. J Food Drug Anal. 2014;22:105–115. | ||
Shan CS, Yang HF, Han DX, et al. Water-soluble graphene covalently functionalized by biocompatible poly-L-lysine. Langmuir. 2009;25:12030–12033. | ||
Sun XM, Liu Z, Welsher K, Goodwin A, Zaric S, Dai H. Nano-graphene oxide for cellular imaging and drug delivery. Nano Res. 2008;1:203–212. | ||
Lei HZ, Mi LJ, Zhou XJ, et al. Adsorption of double-stranded DNA to graphene oxide preventing enzymatic digestion. Nanoscale. 2011;3:3888–3892. | ||
Zhang JL, Zhang F, Yang HJ, et al. Graphene oxide as a matrix for enzyme immobilization. Langmuir. 2010;26:6083–6085. | ||
Dong HF, Gao WC, Yan F, et al. Fluorescence resonance energy transfer between quantum dots and graphene oxide for sensing biomolecules. Anal Chem. 2010;82:5511–5517. | ||
Jaworski S, Sawosz E, Grodzik M, et al. In vitro evaluation of the effects of graphene platelets on glioblastoma multiforme cells. Int J Nanomedicine. 2013;8:413–420. | ||
Hinzmann M, Jaworski S, Kutwin M, et al. Nanoparticles containing allotropes of carbon have genotoxic effects on glioblastoma multiforme cells. Int J Nanomedicine. 2014:9:2409–2417. | ||
Jaworski S, Sawosz E, Grodzik M, et al. Comparison of tumour morphology and structure from U87 and U118 glioma cells cultured on chicken embryo chorioallantoic membrane. Bull Vet Inst Pulawy. 2013;57:593–598. | ||
Ribatti D, Vacca A, Roncali L, Dammacco F. The chick embryo chorioallantoic membrane as a model for in vivo research on anti-angiogenesis. Curr Pharm Biotechnol. 2000;1:73–82. | ||
Yang Y, Rigdon W, Huang X, Li X. Enhancing graphene reinforcing. Sci Rep. 2013;3:1–7. | ||
Shih CJ, Lin S, Sharma R, Strano MS, Blankschtein D. Understanding the pH-dependent behavior of graphene oxide aqueous solutions: a comparative experimental and molecular dynamics simulation study. Langmuir. 2012;28:235–241. | ||
Bitounis D, Ali-Boucetta H, Hong BH, Min DH, Kostarelos K. Prospects and challenges of graphene in biomedical applications. Adv Mater. 2013;25:2258–2268. | ||
Chang Y, Yang ST, Liu JH, et al. In vitro toxicity evaluation of graphene oxide on A549 cells. Toxicol Lett. 2011;200:201–210. | ||
Chwalibog A, Sawosz E, Hotowy A, et al. Visualization of interaction between inorganic nanoparticles and bacteria or fungi. Int J Nanomedicine. 2010;5:1085–1094. | ||
Liao KH, Lin YS, Macosko CW, Haynes CL. Cytotoxicity of graphene oxide and graphene in human erythrocytes and skin fibroblasts. ACS Appl Mater Interfaces. 2011;3:2607–2615. | ||
Yang W, Ratinack KR, Ringer SP, Thordarson P, Gooding JJ, Braet F. Carbon nanomaterials in biosensors: should you use nanotubes or graphene? Angew Chem Int Ed Engl. 2010;49: 2114–2138. | ||
Liu JH, Anilkumar P, Cao L. Cytotoxity evaluations of fluorescent carbon nanoparticles. Nano Life. 2010;1:153–161. | ||
Liu Z, Robinson JT, Sun X, Dai H. PEGylated nanographene oxide for delivery of water-insoluble cancer drugs. J Am Chem Soc. 2008;130:10876–10877. | ||
Akhavan O, Ghaderi E, Akhavan A. Size-dependent genotoxicity of graphene nanoplatelets in human stem cells. Biomaterials. 2012;33:8017–8025. | ||
Lv M, Zhang Y, Liang L, et al. Effect of graphene oxide on undifferentiated and retinoic acid-differentiated SH-SY5Y cells line. Nanoscale. 2012;4:3861–3866. | ||
Li Y, Liu Y, Fu Y, et al. The triggering of apoptosis in macrophages by pristine graphene through the MAPK and TGF-beta siGPaling pathways. Biomaterials. 2012;33:402–411. | ||
Stockmann-Juvala H, Naarala J, Loikkanen J, Vähäkangas K, Savolainen K. Fumonisin B1-induced apoptosis in neuroblastoma, glioblastoma and hypothalamic cell lines. Toxicology. 2006;225:234–241. | ||
Zhu M, Weiss RS. Increased common fragile site expression, cell proliferation defects, and apoptosis following conditional inactivation of mouse hus1 in primary cultured cells. Mol Biol Cell. 2007;18:1044–1055. | ||
Murugesan S, Mousa SA, O’Connor LJ, Lincoln DW, Linhardt RJ. Carbon inhibits vascular endothelial growth factor- and fibroblast growth factor-promoted angiogenesis. FEBS Lett. 2007;581:1157–1160. | ||
Xu Y, Bai H, Lu G, Li C, Shi G. Flexible graphene films via the filtration of water-soluble. J Am Chem Soc. 2008;130:5856–5857. | ||
Cohen-Tanugi D, Grossman JC. Water desalination across nanoporous graphene. Nano Lett. 2012;12:3602–3608. |
 © 2015 The Author(s). This work is published and licensed by Dove Medical Press Limited. The full terms of this license are available at https://www.dovepress.com/terms.php and incorporate the Creative Commons Attribution - Non Commercial (unported, v3.0) License.
By accessing the work you hereby accept the Terms. Non-commercial uses of the work are permitted without any further permission from Dove Medical Press Limited, provided the work is properly attributed. For permission for commercial use of this work, please see paragraphs 4.2 and 5 of our Terms.
© 2015 The Author(s). This work is published and licensed by Dove Medical Press Limited. The full terms of this license are available at https://www.dovepress.com/terms.php and incorporate the Creative Commons Attribution - Non Commercial (unported, v3.0) License.
By accessing the work you hereby accept the Terms. Non-commercial uses of the work are permitted without any further permission from Dove Medical Press Limited, provided the work is properly attributed. For permission for commercial use of this work, please see paragraphs 4.2 and 5 of our Terms.