")
Back to Journals » Journal of Multidisciplinary Healthcare » Volume 8
Improving patient experience in a pediatric ambulatory clinic: a mixed method appraisal of service delivery
Authors Soeteman M, Peters V, Busari J
Received 20 January 2015
Accepted for publication 3 February 2015
Published 23 March 2015 Volume 2015:8 Pages 147—156
DOI https://doi.org/10.2147/JMDH.S81245
Checked for plagiarism Yes
Review by Single anonymous peer review
Peer reviewer comments 2
Editor who approved publication: Dr Scott Fraser
Marijn Soeteman,1 Vera Peters,2 Jamiu O Busari1,3
1Department of Pediatrics, Atrium Medical Center, Heerlen, 2Faculty of Health, Medicine and Life Sciences, 3Department of Educational Development and Research, Faculty of Health, Medicine and Life Sciences, University of Maastricht, Maastricht, the Netherlands
Objective: In 2013, customer satisfaction surveys showed that patients were unhappy with the services provided at our ambulatory clinic. In response, we performed an appraisal of our services, which resulted in the development of a strategy to reduce waiting time and improve quality of service. Infrastructural changes to our clinic’s waiting room, consultation rooms, and back offices were performed, and schedules were redesigned to reduce wait time to 10 minutes and increase consultation time to 20 minutes. Our objective was to identify if this would improve 1) accessibility to caregivers and 2) quality of service and available amenities.
Design: We conducted a multi-method survey using 1) a patient flow analysis to analyze the flow of service and understand the impact of our interventions on patient flow and 2) specially designed questionnaires to investigate patients’ perceptions of our wait time and how to improve our services.
Results: The results showed that 79% of our respondents were called in to see a doctor within 20 minutes upon arrival. More patients (55%) felt that 10–20 minutes was an acceptable wait time. We also observed a perceived increase in satisfaction with wait time (94%). Finally, a large number of patients (97%) were satisfied with the quality of service and with the accessibility to caregivers (94%).
Conclusion: The majority of our patients were satisfied with the accessibility to our ambulatory clinics and with the quality of services provided. The appraisal of our operational processes using a patient flow analysis also demonstrated how this strategy could effectively be applied to investigate and improve quality of service in patients.
Keywords: patient flow, pediatrics, wait time, satisfaction, physicians, quality
Strengths and limitations of this study
This study demonstrates the application of an iterative two-stage multi-method strategy to improve quality of service (ie, design-based research). It represents a continuous and systematic appraisal of an operational process with the objective of improving the quality of health service. There was a notable difference between the sizes of the first and second survey samples (n=282 vs n=121). The ratio of first time to follow-up patients, however, was similar in both of the survey samples. The patient flow analysis (PFA) used in our study was adapted and did not cover all the stages from the entry point to the exit point within the health care process. Finally, our study corroborates previous research that the perception of waiting considerably influences patient satisfaction. However, providing information about wait time as well as distractions from waiting can improve the perception of quality of service.
Background
Health care delivery is currently at the midpoint of a period of transition; a period characterized by the appraisal and continuous improvement of services that health care providers are offering to patients. Steered by increased consumer demands for easily accessible, cost-effective, and efficient health services, many health systems have been forced to redesign and standardize their operational processes. In 2001, the Institute of Health Care published a report that defined six aims to help improve the quality of health care, and these were outlined in a framework of guiding principles that would help health institutions stay abreast of an increasingly competitive health care market.1 Timeliness was one of these six aims and involved providing timely care to patients that would help reduce harmful delays. Better recognized as wait time in the literature, this important but understudied aspect of health care has been described as an essential determinant of patient satisfaction in health care practice,2 particularly because long wait times have been found to result in negative perceptions of the quality of services provided in outpatient departments3,4 and the resultant decrease in patient satisfaction in turn may influence the return rate to outpatient departments, an essential element in the treatment of complex and chronic conditions.5
The context
The Atrium Medical Center is a large non-university teaching hospital in the southern part of the Netherlands. The hospital houses about 1,300 hospital beds spread over three locations, ie, Heerlen (main hospital site), and Kerkrade and Brunssum (satellite hospital sites). In addition to the outpatient consultations provided at the three sites, the site in Heerlen provides clinical services, ie, long-term hospital admission and the delivery of acute, intensive, and complex care. Elective (non)surgical procedures are provided in Brunssum, while medical diagnostic services are provided in Kerkrade. Approximately 200 medical specialists, 150 specialist registrars, and 3,600 other hospital staff are responsible for the health care services to the 300,000 inhabitants of the region. As a teaching hospital, the Atrium Medical Center also caters for the professional training of undergraduate (90 medical students) and postgraduate (135 specialist registrars) physicians, as well as nursing staff (200 trainee nurses and midwives) and in-house employees. Each year, the hospital records about 30,000 long-term and 35,000 short-term (<24 hours) clinical admissions. Hospital admission records show that our pediatric department notes approximately 1,900 long-term and 770 short-term clinical admissions, while the pediatric ambulatory clinic (spread over the three locations) notes yearly 4,900 first consultations and 7,800 follow-up consultations.6
Assessment of problem
In 2011, we observed a decline in the positive patient satisfaction ratings of the services delivered in our pediatric ambulatory clinic. We also found out that there was growing dissatisfaction from our hospital management board with respect to the utility of resources for our operational processes, and patients were unhappy with some of our services as evidenced by the outcome of a focus group interview on the quality of our care pathway for pediatric asthma care. One of the major complaints on further analysis was about patients’ ease of access to our services and, in particular, wait time.
As it has been found in the literature that teaching hospitals tend to have longer wait times than non-teaching hospitals,2,5 and because our institution (specifically our department) had a teaching setting, the need arose to perform a formal evaluation of patients’ perceptions of our services, ie, operational processes, and also to investigate for methods to help 1) reduce patient wait time; 2) overcome barriers to effective patient flow; and 3) improve the efficiency of care.
Research question
Based on the identified problem, we decided to investigate wait time in our pediatric ambulatory clinic and investigate patients’ perception of the services provided. The goal of the survey was to improve the ultimate customer experience of patients and their parents. More specifically, we aimed to obtain more insight into the operational processes of our services, including identifying elements that influence the wait time, the specific expectations of patients regarding our services, and recommendations on how to serve them better. Not only was it essential for us to understand the impact of wait times and their effect on our patients’ experience of care, but it was equally important for us to understand the managerial implications of these findings and what is required to restore and/or improve patient satisfaction. As the project was a service improvement initiative, we decided to design a two-stage process improvement study made up of a process evaluation, an intervention, and a re-evaluation at a later stage (see Figure 1).
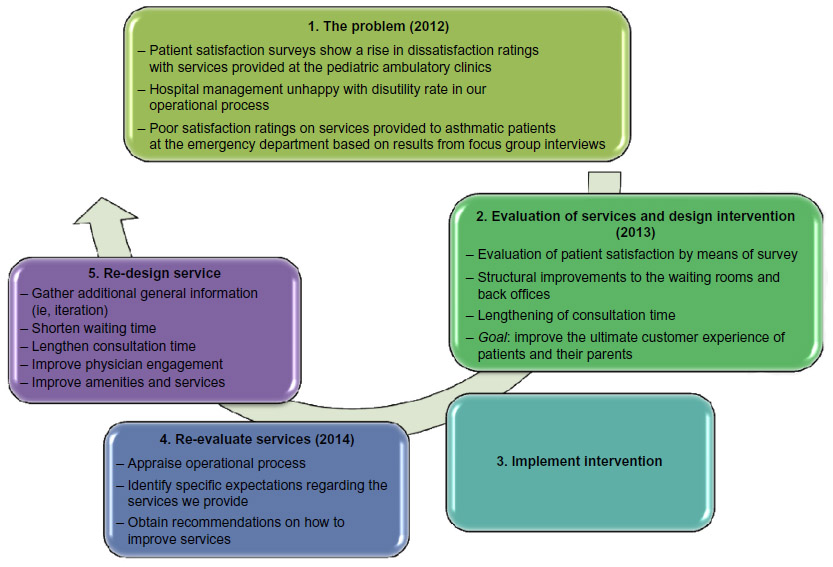 | Figure 1 Stages of the service improvement project at the pediatric ambulatory clinic. |
Methods
We decided to conduct an explorative survey to investigate the operational process within our ambulatory care setting. We chose to investigate our wait time using a PFA, and with the help of a standardized questionnaire investigated patients’ perceptions of the services provided in our clinic. The study was conducted at the three locations of the outpatient department of the Atrium Medical Center. As the Atrium Medical Center is a teaching hospital, both pediatricians and pediatric residents work in the ambulatory clinics, which serve patients aged 0–18 years with a wide range of socioeconomic backgrounds. All patients who took part in the survey were insured, as this is obligatory in the Netherlands. An explanation of the objective of the survey and the request for informed consent from all respondents was achieved through the questionnaire prior to participation in the survey. Furthermore, participation in the survey was voluntary and conducted anonymously. All the physicians involved in the delivery of care during the survey were blinded to who and when ratings were taking place. As the survey was service improvement oriented and did not involve research on human, ethical review board approval was not sought.
We designed an 18-item questionnaire that included a simple written survey to assess the wait time. Some of the items included in the questionnaire focused on investigating patients’ satisfaction with the wait time, the quality of the facilities provided in the waiting area, whether patients were provided with information about the wait time, whether they were willing to see other health care providers in case of long wait times, and finally, for general recommendations on how to serve them better. In addition to answering to specific short answer questions, respondents could add qualitative comments to the items (Figure S1).
The first stage of the study (process evaluation) was conducted in the months of June, August, and September of 2013. Based on the findings of the process evaluation, a three-stage intervention was designed to address the identified problems. Stage 1 involved reporting the outcome of the survey back to the health workers at different points of the service chain, ie, the attendants at the reception desks, the medical team (pediatrician and residents), and the back-office administrative staff. Stage 2 on the other hand involved analyzing the various recommendations obtained from the different stakeholders, while Stage 3 involved synthesizing the various recommendations into concrete improvement plans that resulted in structural improvements to the waiting rooms, consultation rooms, and back offices. The most important improvement plan was where the changes were performed to wait time, ie, the length was limited to a maximum of 10 minutes and to consultation time, which was increased to 20 minutes for residents, and a “15-minute buffer” was added to the allocated consultation time for the pediatricians. All of these interventions were formally implemented between October and November 2013. The second survey, ie, re-evaluation study, was performed between January and March 2014 at the three locations of the pediatric ambulatory clinic. The objective of this second survey was to evaluate the effect of the process improvement intervention we performed in 2013.
We analyzed the data by means of descriptive statistics and chi-square analysis using SPSS 22.0 (IBM Corporation released 2013, IBM SPSS Statistics for Windows, Version 22.0; IBM Corporation, Armonk, NY, USA). Qualitative data were clustered into an Excel spreadsheet (2003, Microsoft Corporation, Redmond, WA, USA).
Results of assessment
Survey I
Two hundred and eighty-two respondents, of which 71% were follow-up patients, completed the first survey. The majority of patients arrived on time at the outpatient clinic; only 8% arrived >10 minutes after the appointment. Seventy-nine percent of the patients were called in within 20 minutes after their appointment time. At baseline, the majority of the respondents were satisfied with the wait time to see the doctor (89%) and with the available amenities provided (96%–97%), eg, waiting room, consultation rooms, and the atmosphere of the clinics’ setting (see Table 1). The satisfaction with length of wait time, atmosphere, waiting area, and provided amenities is displayed in Table 2.
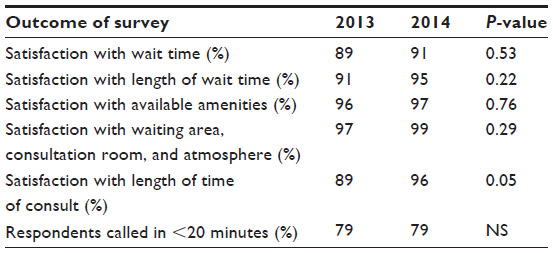 | Table 1 Overview of respondents’ satisfaction with wait time, amenities, waiting environment, and length of time of consult and the percentage of respondents called in within 20 minutes of the arranged consultation |
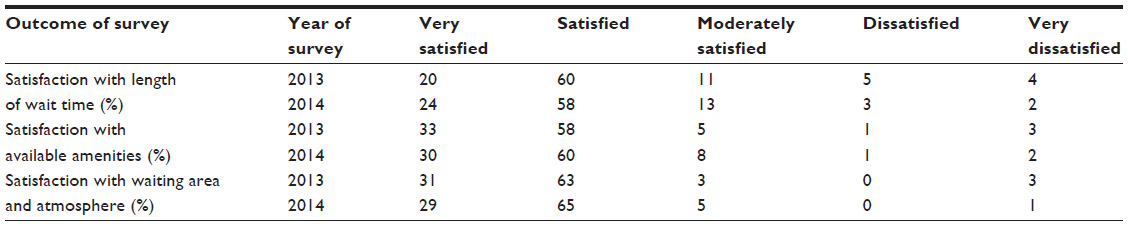 | Table 2 Overview of respondents’ satisfaction with length of wait time, amenities, and waiting environment, displayed for both surveys (2013 pre intervention, 2014 post intervention) |
Only 50% of the follow-up patients were aware that the consultations with the doctor lasted 15 minutes. Eighty-nine percent of the respondents thought that the length of the consultation was sufficient, while 11% preferred that the consultation time be lengthened. A large number (99%) of the participants responded that there was enough time to ask questions to the doctor. The majority (90%) of the respondents were of the opinion that the wait time did not influence the quality of the consultation. Of the respondents who were dissatisfied with the wait time, 20% thought that this influenced the quality of the consultation, whereas 80% thought that it did not influence the quality of the consultation. Thirty-two percent of the respondents were informed about the wait time, whereas 25% were not informed. Forty-two percent of patients responded that this was not applicable as they were attended to promptly, ie, no wait time.
Survey II
One hundred and twenty respondents, 75% of whom were follow-up patients, completed the second survey, performed 2 months after implementation of the intervention. After intervention, 79% was called in within 20 minutes after the appointment (see Tables 1 and 3). The patients’ satisfaction with the wait time was 91% (see Table 1). For the majority of the patients (55%), 10–20 minutes was felt to be an acceptable wait time (see Table 3). The satisfaction with the length of time of the consultation has risen to 96% (P=0.05) (see Table 1). The majority (98%) thought that there was enough time to ask questions to the doctor. The satisfaction with the waiting environment was high (97%–99%), although some parents responded that the waiting area was inconvenient to oversee playing children (see Tables 1 and 2). A minority (24%) was informed about the wait time, 32% was not informed, and 42% of patients responded that this was not applicable due to no wait time.
 | Table 3 Overview of actual wait time versus acceptable wait time for respondents |
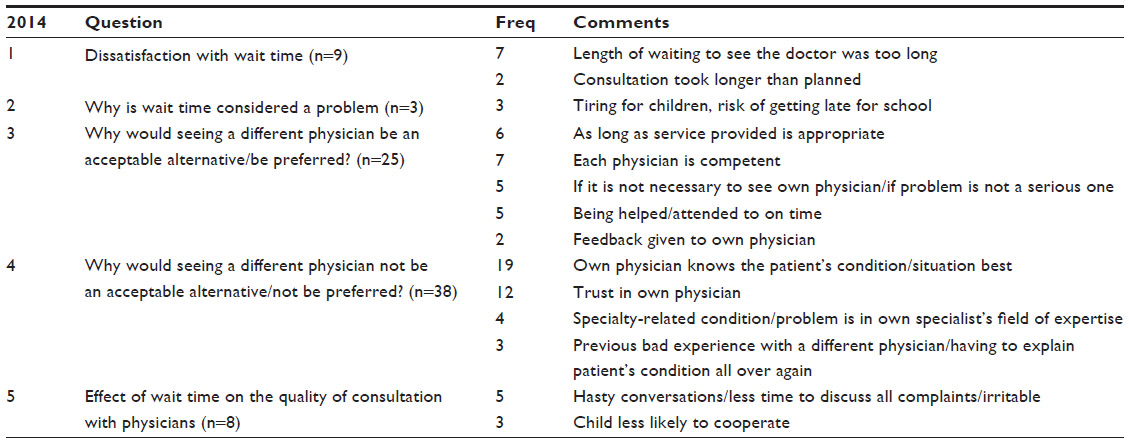
In both surveys, half of the patients were willing to see a different pediatrician if this would lead to a shorter wait time. The main argument to see the same pediatrician was that the child was familiar with the pediatrician and that the pediatrician had all the inside information about the child and its background. Other parents were neutral about seeing the same pediatrician, as long as the pediatrician had access to the medical history of the child, or preferred a shorter wait time instead of waiting to see the same pediatrician (see Tables 4 and 5). It should be noted that for some questions where respondents could add qualitative comments, only a few did make use of this by providing their comments. Waiting with infants or children with known behavioral problems was the most reported reason for why parents experienced wait time as a problem. Also, having a scheduled appointment after the consult was a reason for dissatisfaction with waiting (see Tables 4 and 5). Parents reported that they would like to be informed about the expected wait time, preferably as soon as they checked in at the front desk.
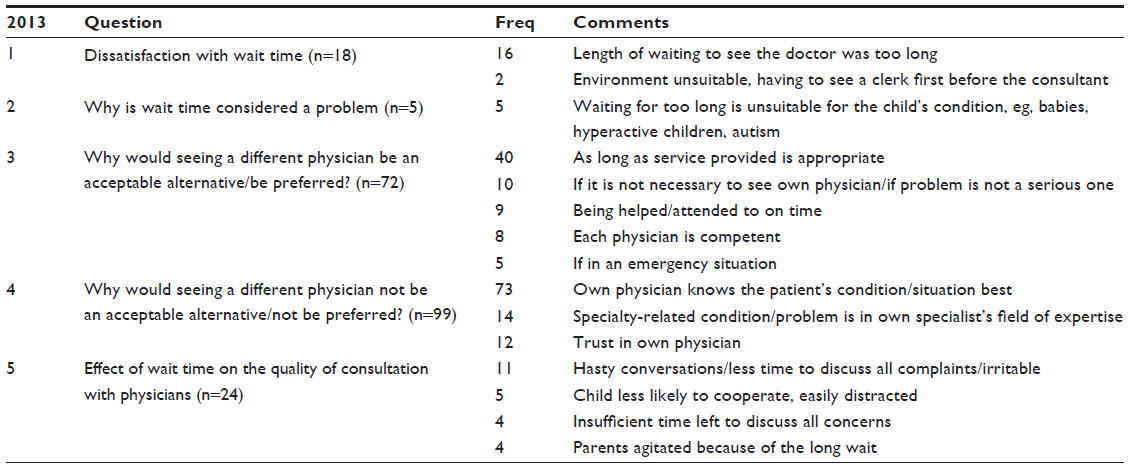 | Table 4 Overview of respondents’ responses to some of the questions on quality of service in the pediatric ambulatory clinic (2013) |
 | Table 5 Overview of respondents’ responses to some of the questions on quality of service in the pediatric ambulatory clinic (2014) |
Lessons learnt
In this paper, we describe the process of how a PFA was used to gain a better insight of the wait time in our pediatric ambulatory clinic. A questionnaire was designed to identify elements that influenced wait time, specific customer expectations, and perceptions of the quality of our services. Our aim was to improve the ultimate customer experience of our patients (and their parents) and, in particular, increase their satisfaction with our wait times and waiting environment in our clinic. In addition, an intervention based on the outcomes of the first survey was designed, which included increasing consultation time and carrying out structural improvements in the waiting rooms. In general, our findings showed that there was high satisfaction with the wait time, both prior to and after the intervention. Satisfaction with the available amenities and the waiting area and atmosphere was also high among the respondents. We also saw an increasing trend of higher satisfaction with the increase in duration of the consultations from 15 minutes to 20 minutes for residents and addition of a 15-minute buffer to the total allocated time for pediatricians’ consultations. Unfortunately, the intervention did not result in a decrease in wait time or a significant increase in patient satisfaction with wait time.
It has been well established that patient satisfaction is significantly influenced by wait time, with longer wait times decreasing patients’ satisfaction of the overall quality of the services.2,4,7,8 Moreover, increased wait time negatively influences the perceived quality of care received from the clinician, including various quality elements, such as reliability, assurance, and empathy, as well as the likelihood of return visits.4,8 So minimizing wait time is of essence in establishing good quality of care. The findings of our survey suggest that for the majority of the patients, a wait time of no more than 20 minutes was acceptable. These findings are consistent with Hill and Joonas who reported 16–30 minutes to be an acceptable wait time for the majority of patients. If a patient would have an unacceptable wait time, this could lead to negative overt action by the patient, including switching to a different medical service provider.4 For the majority of patients, unacceptable experiences would have to occur fairly frequently before they would lead to some type of response. However, for some patients, an infrequently occurring unacceptable wait time would be the reason to undertake action and, in the worst case, switch doctors.4
Another thing we observed in our study was the ambivalence among our respondents toward seeing a different pediatrician even if this would lead to a shorter wait time. The physician’s familiarity with the patient’s problem and their expertise were the most reported reasons for why respondents preferred the same specialist. As was discussed by Hill and Joonas, patients are able to separate their assessment of how competent the doctor is from how they feel about him/her as a person and their ultimate satisfaction with the total experience.4 In our study, 90% of the respondents found that the wait time did not influence the quality of the consult. Of the respondents who were dissatisfied with the wait time, the majority (80%) of them felt that this did not influence the quality of the consult. Wait time did not appear to influence patients to like the doctor less.4 However, it was discussed that at some point, regardless of how good the doctor is perceived to be, patients become dissatisfied with the provider as they experience unacceptable wait time.4 These abovementioned points further buttress the importance of minimizing wait time.
It has been shown in the literature that the use of a time-flow study can be a useful and effective technique to identify inefficiencies in the patient visits, target interventions, and measure effectiveness of interventions.5 Furthermore, the ease of performing a PFA in an ambulatory setting negates the need to hire external consultants, thus avoiding additional expenditures . In addition, it allows clinical staff members who are familiar with patient flow designs, develop a sense of ownership in the process.5 In contrast to other studies using PFA,3,5,9 the patients and their parents in our survey were able to provide qualitative comments. As mentioned earlier, the perception of waiting time has been shown to be a better indicator of patient satisfaction than actual waiting time.8,10 Therefore by assessing our patients’ opinions, we gained additional insights into the patients’ perception of our operational process. This enabled us to identify specific expectations regarding our services and obtain patients’ recommendations on how to improve these services. In this way, we were able to design an intervention based on patients’ perception of care and assess the patients’ satisfaction after the intervention.
There are several factors that have been found to influence the perception of wait time. For example, anxiety makes waiting seem longer, unexplained waits are longer than explained waits, and unoccupied wait time feels longer than occupied wait time.11 Additionally, some of the comments provided in our study showed that waits with infants or children with behavioral problems could be of particular inconvenience and lead to a negative perception of wait time. Furthermore, the waiting environment also contributes to the perception of wait time. For example, the provision of specific activities or toys to engage children with in waiting rooms, distracts their attention from the length of waiting and minimizes the chances of unwanted tantrums. Therefore, it could be an important contributor to improve the waiting experience for children in hospitals by improving environmental attractiveness.10 Providing information about wait time can be an important factor in establishing patients’ satisfaction. In our study, respondents preferred to be informed about the wait time as soon as they checked in at the front office. As was previously discussed, dissatisfaction with wait time was of less influence on the overall satisfaction of emergency room patients when appropriate information about delays was provided.2
There are a number of limitations in our study that should be mentioned, including the difference between the sample sizes (n=282 vs n=121). It is our assumption that this difference may have been as a result of redundancy, ie, patients refusing to participate again having taken part in the first survey. However, as the ratio of the new to follow-up patients was approximately equal in both surveys despite the different sample sizes, it is unlikely that this is the explanation for the smaller group in the second study. It is our assumption that the difference was probably due to a loss of motivation among the reception desk staff who were responsible for handing out the questionnaires. Nonetheless, since this observational study was performed to obtain information about the patients’ view of accessibility to caregivers and the quality of care received, we believe the sample sizes were large enough to achieve this goal. A second limitation was the fact that we used a PFA to identify the wait time from entrance to the doctor’s room. Ideally, a PFA should include the time the patient is seen by the nurse (for obtaining physical measurements) to identify inefficiencies in the whole care process. Considering minimizing wait time, it would be better to perform a PFA from entrance to exit, including the time spent with the nurses to identify elements that could lead to delay. On the other hand, our study aimed to gain insight into the patients’ perception of our operational process and identify areas for improving care. As perceived wait time is more important than actual wait time, we chose to focus on qualitative comments and included measuring wait time by means of PFA.
Message for others
In summary, our study showed that the satisfaction with wait time was high and equal, both prior to and after the intervention. Satisfaction with the available amenities and the waiting area and atmosphere was also high among the respondents. We also saw an increasing trend of higher satisfaction with the increase in duration of the consultations from 15 minutes to 20 minutes for residents and addition of a 15-minute buffer to the total allocated time for pediatricians’ consultations. Unfortunately, the intervention did not result in a decrease in wait time or a significant increase in patient satisfaction with wait time. On further analysis, we think that this finding may have been biased by the already highly perceived satisfaction with our services. Another possible explanation could be because of the preferential lengthening of the consultation time for residents alone. It is theoretically possible that due to their additional expertise, increasing the consultation time for the specialists may have resulted in a significant improvement in the patient satisfaction scores and reduced wait time. As our study represents the continuous appraisal of operational processes, the search for ways to reduce wait time and improve patients’ satisfaction with the provided care remains an area for further investigation.
Authors’ contributions
JOB made 1) substantial contribution to the concept and design of the survey, acquisition of data, the analysis and interpretation of data; 2) was involved in drafting the manuscript and revising it critically for important intellectual content; and 3) gave final approval of the version to be published. MS made 1) substantial contribution to the design of the survey; 2) was involved in drafting the manuscript and revising it critically for important intellectual content; and 3) gave final approval of the version to be published. VP made 1) substantial contribution to the concept and design of the survey and acquisition of data; 2) was involved in revising the manuscript critically for important intellectual content; and 3) gave final approval of the version to be published.
Disclosure
The authors report no conflicts of interest in this work.
References
Institute of Medicine. Crossing the Quality Chasm: A New Health System for the 21st Century. Washington, DC: National Academies Press; 2001. | |
Leddy KM, Kaldenberg DO, Becker BW. Timeliness in ambulatory care treatment. An examination of patient satisfaction and wait times in medical practices and outpatient test and treatment facilities. J Ambul Care Manage. 2003;26(2):138–149. | |
Babalola D, Meng YX, Nichols M, Omole F, Sow C, Perkins V. Improving the patient flow at an academic primary care teaching clinic serving African American patients. Clin Exp Med Sci. 2013;1(5): 241–250. | |
Hill CJ, Joonas K. The impact of unacceptable wait time on health care patients’ attitudes and actions. Health Mark Q. 2005;23(2):69–87. | |
Potisek NM, Malone RM, Shilliday BB, et al. Use of patient flow analysis to improve patient visit efficiency by decreasing wait time in a primary care-based disease management programs for anticoagulation and chronic pain: a quality improvement study. BMC Health Serv Res. 2007;7:8. | |
Carity IOK. Annual Report Paediatrics. Middletown, OH: Atrium Medical Centre; 2013. | |
Camacho F, Anderson R, Safrit A, Jones AS, Hoffmann P. The relationship between patient’s perceived waiting time and office-based practice satisfaction. N C Med J. 2006;67(6):409–413. | |
Bleustein C, Rothschild DB, Valen A, Valatis E, Schweitzer L, Jones R. Wait times, patient satisfaction scores, and the perception of care. Am J Manag Care. 2014;20(5):393–400. | |
Racine AD, Davidson AG. Use of a time-flow study to improve patient waiting times at an inner-city academic pediatric practice. Arch Pediatr Adolesc Med. 2002;156(12):1203–1209. | |
Pati D, Nanda U. Influence of positive distractions on children in two clinic waiting areas. Health Environ Res Design J. 2011;4(3): 124–140. | |
Maister D. The Psychology of Waiting Lines; 1985. Available from: http://davidmaister.com/articles/5/52/. Accessed: January, 10, 2015. |
Supplementary material
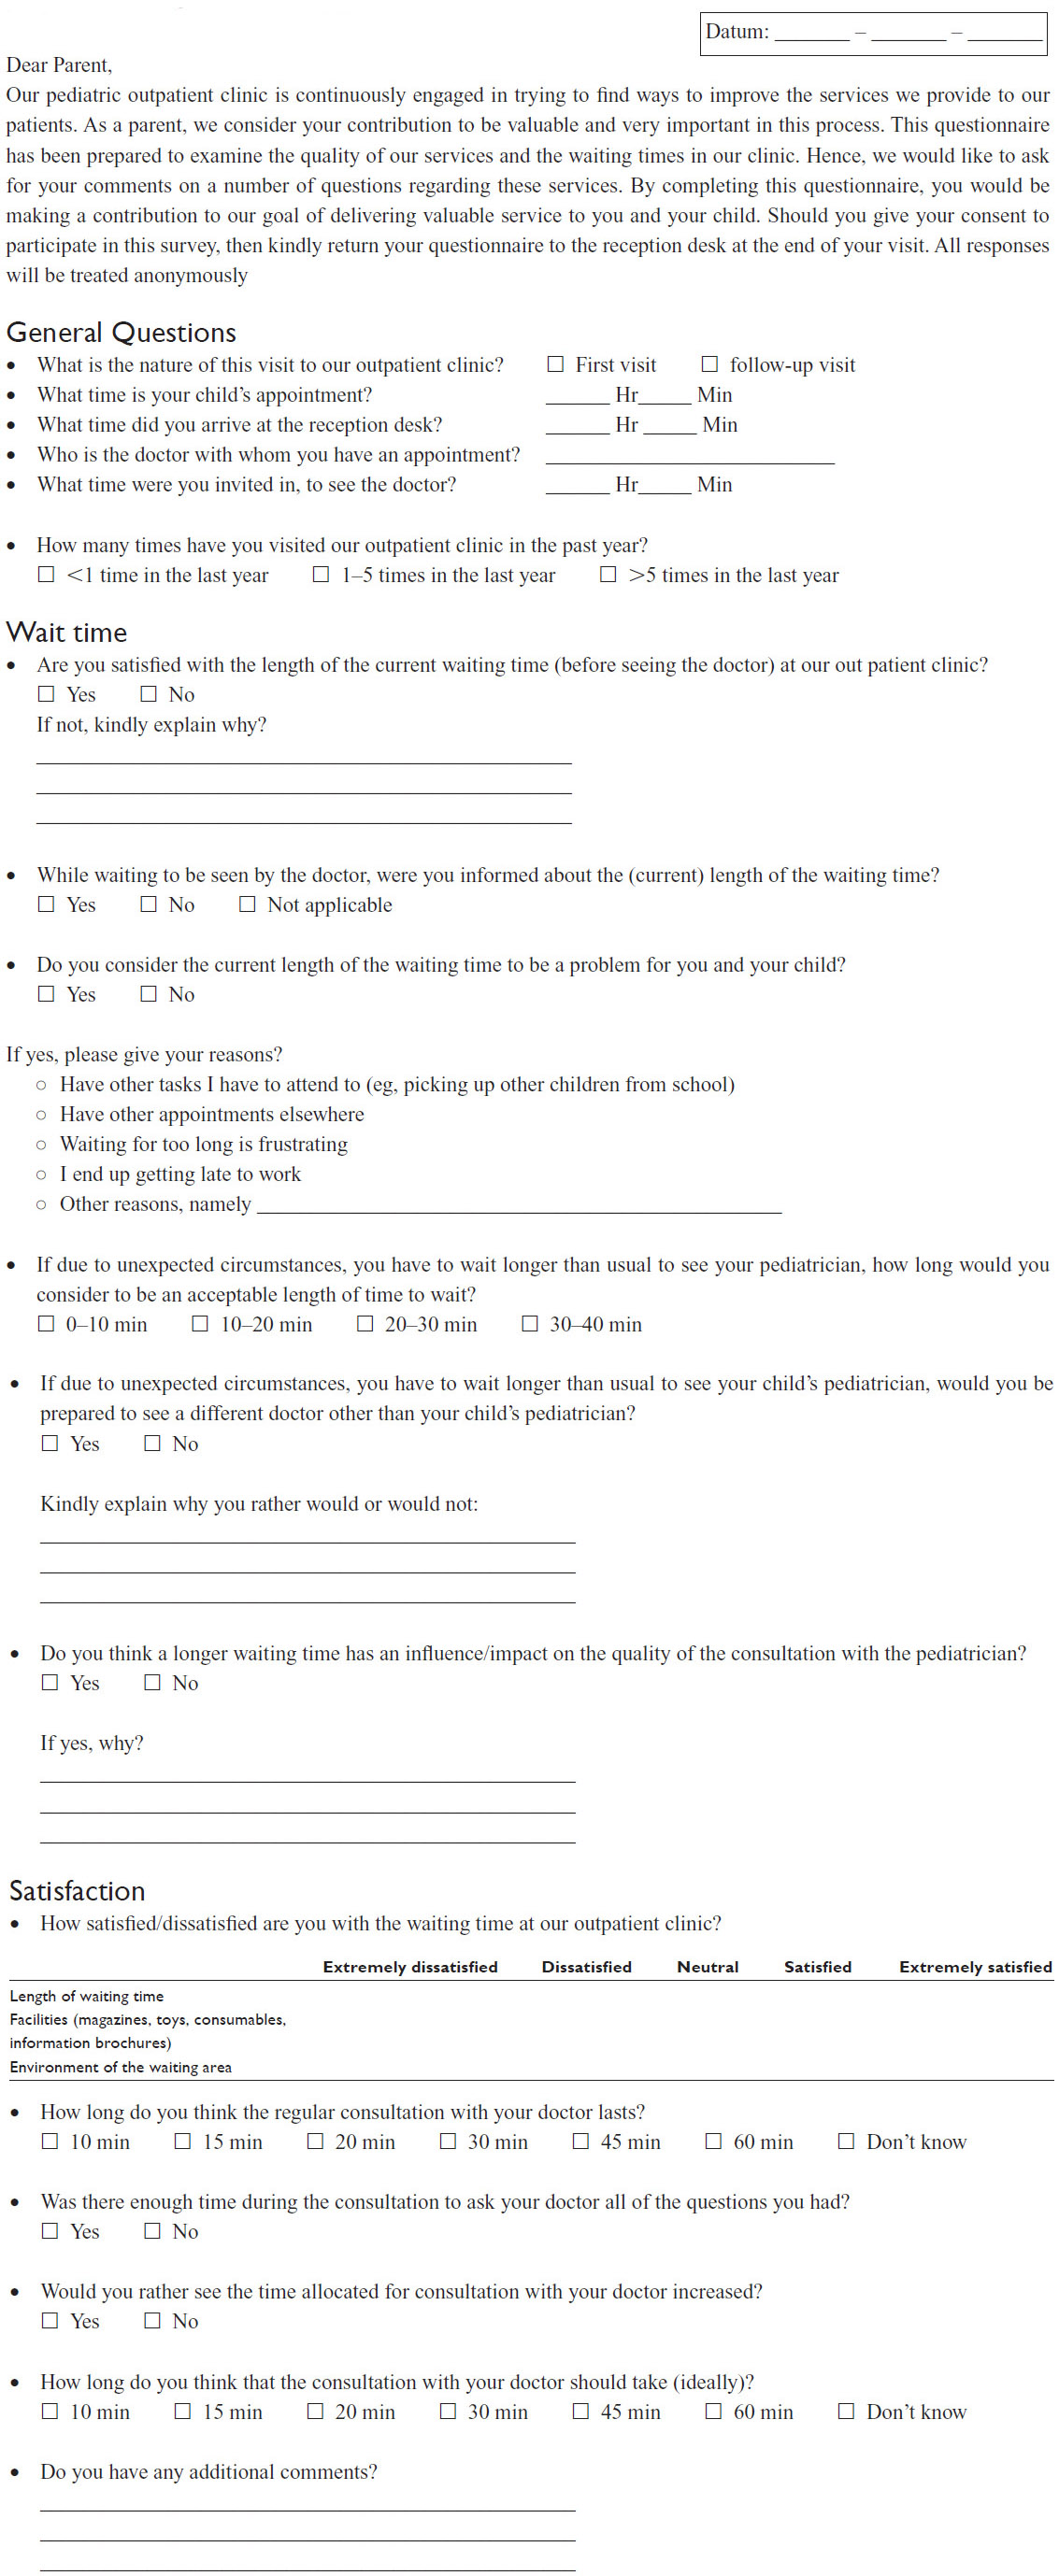 | Figure S1 Questionnaire “No wait, no waste”. |
 © 2015 The Author(s). This work is published and licensed by Dove Medical Press Limited. The full terms of this license are available at https://www.dovepress.com/terms.php and incorporate the Creative Commons Attribution - Non Commercial (unported, v3.0) License.
By accessing the work you hereby accept the Terms. Non-commercial uses of the work are permitted without any further permission from Dove Medical Press Limited, provided the work is properly attributed. For permission for commercial use of this work, please see paragraphs 4.2 and 5 of our Terms.
© 2015 The Author(s). This work is published and licensed by Dove Medical Press Limited. The full terms of this license are available at https://www.dovepress.com/terms.php and incorporate the Creative Commons Attribution - Non Commercial (unported, v3.0) License.
By accessing the work you hereby accept the Terms. Non-commercial uses of the work are permitted without any further permission from Dove Medical Press Limited, provided the work is properly attributed. For permission for commercial use of this work, please see paragraphs 4.2 and 5 of our Terms.