")
Back to Journals » Neuropsychiatric Disease and Treatment » Volume 11
Impaired mitochondrial energy metabolism as a novel risk factor for selective onset and progression of dementia in oldest-old subjects
Authors Zhao W, Wang J, Varghese M, Ho L, Mazzola P , Haroutunian V, Katsel P, Gibson G, Levine S, Dubner L, Pasinetti G
Received 25 September 2014
Accepted for publication 29 October 2014
Published 5 March 2015 Volume 2015:11 Pages 565—574
DOI https://doi.org/10.2147/NDT.S74898
Checked for plagiarism Yes
Review by Single anonymous peer review
Peer reviewer comments 7
Editor who approved publication: Dr Roger Pinder
Wei Zhao,1,2 Jun Wang,1,2 Merina Varghese,1 Lap Ho,1,2 Paolo Mazzola,1,3 Vahram Haroutunian,2,4,5 Pavel L Katsel,2,4 Gary E Gibson,6 Samara Levine,1 Lauren Dubner,1 Giulio Maria Pasinetti1,2,4,7
1Department of Neurology, Icahn School of Medicine at Mount Sinai, New York, NY, USA; 2Geriatric Research Education Clinical Center – James J Peter VA Medical Center, Bronx, NY, USA; 3Department of Health Sciences, University of Milano-Bicocca, Monza, Italy; 4Department of Psychiatry, 5Department of Neuroscience, Icahn School of Medicine at Mount Sinai, New York, NY, USA; 6Department of Neurology and Neuroscience, Weill Cornell Medical College, Burke Medical Research Institute, New York, NY, USA; 7Department of Geriatrics, Icahn School of Medicine at Mount Sinai, New York, NY, USA
Abstract: Recent evidence shows that Alzheimer disease (AD) dementia in the oldest-old subjects was associated with significantly less amyloid plaque and fibrillary tangle neuropathology than in the young-old population. In this study, using quantitative (q) PCR studies, we validated genome-wide microarray RNA studies previously conducted by our research group. We found selective downregulation of mitochondrial energy metabolism genes in the brains of oldest-old, but not young-old, AD dementia cases, despite a significant lack of classic AD neuropathology features. We report a significant decrease of genes associated with mitochondrial pyruvate metabolism, the tricarboxylic acid cycle (TCA), and glycolytic pathways. Moreover, significantly higher levels of nitrotyrosylated (3-NT)-proteins and 4-hydroxy-2-nonenal (HNE) adducts, which are indexes of cellular protein oxidation and lipid peroxidation, respectively, were detected in the brains of oldest-old subjects at high risk of developing AD, possibly suggesting compensatory mechanisms. These findings support the hypothesis that although oldest-old AD subjects, characterized by significantly lower AD neuropathology than young-old AD subjects, have brain mitochondrial metabolism impairment, which we hypothesize may selectively contribute to the development of dementia. Outcomes from this study provide novel insights into the molecular mechanisms underlying clinical dementia in young-old and oldest-old AD subjects and provide novel strategies for AD prevention and treatment in oldest-old dementia cases.
Keywords: Alzheimer disease, energy metabolism, neuropathology, mitochondria, dementia
Introduction
Recent studies suggest that Alzheimer disease (AD) dementia in oldest-old (87–103 years of age) cases is associated with different features from the neuropathological features found in young-old (62–86 years of age) AD dementia cases. In particular, analyses of postmortem brain specimens has demonstrated that AD dementia in the oldest-old is correlated with significantly less amyloid plaque and fibrillary tangle neuropathology than AD dementia in the young-old.1–3 US Census Bureau data and projections show that the number of Americans over the age of 85 will rise significantly by 2015 to 6.3 million, and will triple to 18.2 million by 2060 (http://www.census.gov/population/projections/data/national/2012/summarytables.html).
Of these 18.2 million people, 8 million are predicted to develop dementia,4 with the prevalence of dementia increasing from 13% in 77–84 year olds to 48% in persons 90 years old and older. Recent evidence suggests that dementia prevalence may continue to double every 5 years, at least in women,5,6 until the age of 85–90. Similarly, the incidence of dementia is projected to increase from 10% at age 65 to 21%–47% at ages 85 and older.7 The growth of the population of oldest-old and the current rate of AD dementia incidence suggest that in addition to personal and caregiver suffering, the inflation unadjusted cost of care in this population will rise to over 33 billion dollars per year in the US. These observations make imperative the need to better understand the neurobiological basis of dementia in the oldest-old and to identify novel preventative therapeutics for this growing segment of the US population.
Reduced energy metabolism in the brain is strongly related to clinical dementia.8,9 The tricarboxylic acid (TCA) cycle is the main pathway for glucose oxidative metabolism in the brain. Oxidative decarboxylation of pyruvate, the product of glycolysis, by the pyruvate dehydrogenase complex (PDHC), leads to the generation of acetyl-CoA, which is then oxidatively metabolized during the TCA cycle. Diminishing energy metabolism is a prominent abnormality in AD. Another consistent feature of AD is enhanced oxidative stress that results from an excess of reactive oxygen species (ROS) (eg, superoxide, singlet oxygen, hydrogen peroxide, etc).10,11 Major contributors of oxidative damage in the brain are oxidative protein modifications by nitration12–14 and lipid peroxidation.15 Studies reveal that oxidative modification proteins typically lead to inhibition of biological functions and/or enzymatic activities that are the result of changes in protein conformation, protein cross-linking, and/or protein degradation.12,16–18
In this study, we report that oldest-old AD dementia subjects have significantly impaired mitochondrial energy metabolism, which we found to be preceded by abnormally elevated levels of nitrotyrosylated (3-NT) proteins and 4-hydroxy-2-nonenal (HNE) protein, which are indexes of oxidative stress, especially in subjects at high risk of developing AD. We hypothesize that oxidative stress may abnormally influence mitochondrial function in oldest-old subjects, which ultimately may accelerate mitochondrial impairment and cause AD dementia, even in conditions of negligible AD neuropathology.
Materials and methods
Postmortem brain tissue
Human postmortem brain samples from young-old and oldest-old dementia cases and age-matched normal neurological control cases were obtained from the Mount Sinai – James J. Peters Medical Center, Bronx Veterans Affairs Brain Bank. Tissue donors were previous participants in a longitudinal study of aging and dementia. All neuropsychological, diagnostic, and autopsy protocols were approved by the Mount Sinai Institutional Review Board.
Energy metabolism in AD
In this study, using qPCR, we validated genome-wide microarray RNA studies that were previously conducted by our research group.19,20 We surveyed and further characterized changes in the expression of gene products associated with energy metabolism, which we identified from our previously collected studies.19,20 Considering that energy metabolism progressively declines as a function of aging, we selected younger cohorts among the young-olds and older cohorts among the oldest-olds for comparative studies in order to emphasize the impact of age-related energetic metabolic deficits on AD mechanisms and to better define the differences in AD mechanisms between young-old and oldest-old subjects. A significant advantage of the current study is the relatively large number of well characterized cases and specimens available through the MSSM-VA Bronx brain bank.
In this study, young-old and oldest-old subjects were operationally segregated by age; those 86 years old or younger were classified as young-old, and those 87 years of age or older were classified as oldest-old (Figure 1A). The cases selected had either no significant neuropathological features or only neuropathological features associated with AD (Figure 1B). The neuritic plaque content (NP) with amyloid cores was quantified in accordance with the Consortium to Establish a Registry for AD (CERAD) neuropathologic battery. Multiple (approximately five) high-power (×200, 0.5 mm2) fields were examined in each histologic slide from multiple regions of the brain, according to the CERAD regional sampling scheme. The density of NPs was rated on a four-point scale as follows: 0, absent; 1, sparse; 3, moderate; and 5, severe. Plaques were visualized after either Bielschowsky silver or thioflavin-S staining. Neuropathologic and biological studies were performed blindly in regards to the clinical and biochemical characteristics of the tissue donors.
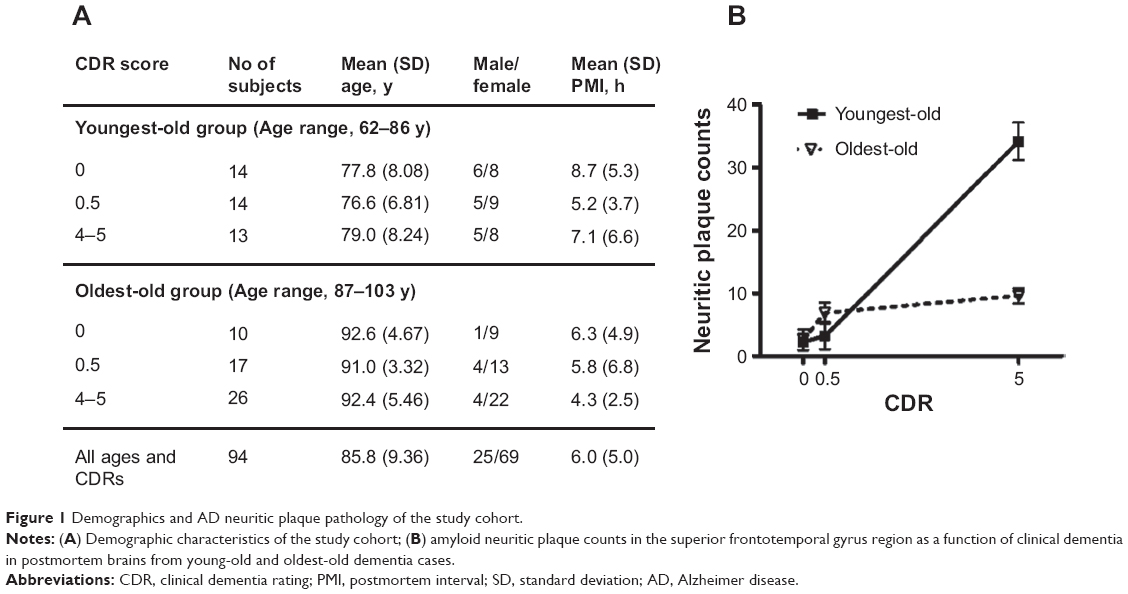 | Figure 1 Demographics and AD neuritic plaque pathology of the study cohort. |
Genome-wide microarray RNA studies
For genome-wide microarray RNA studies, case and tissue selection criteria ensured that no correlations were observed between postmortem interval (PMI) and RNA quality. Sample preparation and microarray hybridizations were performed by Gene Logic, Inc. (Gaithersburg, MD, USA) using Affymetrix (Santa Clara, CA, USA) HG-U133 A and B Human genome GeneChip® sets. Data were normalized using MAS 5.0 algorithms and analyzed using the GX™ Explorer v.3.0 (Gene Logic, Inc.) tools (expression, comparative, and contrast analysis). Each microarray/sample-region (15 brain regions) was treated as an individual sample, though comparison analyses and t-score calculations were performed by brain region. The contrast pattern vectors were set up in a way to outline the increased expression levels in tested sample sets. Accordingly, larger positive scores, together with significant (P<0.01) Pearson correlation coefficients, indicated upregulation of gene expression. On the other hand, large, negative t-score values, together with significant (P<0.01) negative Pearson correlation coefficients indicated downregulation of gene expression. Finally, t-scores close to zero suggested that the amount of variation between sample sets was comparable to or smaller than the variation within the sample sets.
Quantitative PCR
Total RNAs were extracted from postmortem superior/middle frontal gyrus (BM 9) brain samples using an RNeasy Mini Kit (Qiagen, Germantown, MD, USA). First-strand cDNAs were synthesized using Superscript III SuperMix for qRT-PCR (Invitrogen, Carlsbad, CA, USA). Quantitative RT-PCR (four replicates) was performed using Maxima SYBR Green qPCR Master Mix (Fermentas, Burlington, ON, Canada) in an ABI Prism 7900HT processor. Neuron-specific enolase (NSE) was used as an internal control for normalization. Fold changes were calculated using the 2ΔΔCt method. Statistical analyses by 2-tailed Student’s t-test were conducted using GraphPad Prism software (GraphPad Software, Inc., La Jolla, CA, USA).
Enzymatic activity assay
Brain samples from AD patients and normal neurological age-matched controls were homogenized (10% w/v) in an ice cold sucrose isolation buffer (0.32 M sucrose, 0.125 M Tris-HCl pH 8.0, 0.1 mM EDTA, 0.6 mM MgCl2, 1 mM dithiothreitol, and protease inhibitors) using a Precellys 24 homogenizer (Bertin Technologies, Montigny-le-Bretonneux, France) at 6,500 rpm for 8 seconds followed by 5 minutes intervals on ice, until completely homogenized. The homogenate was then centrifuged, assayed for proteins using the Bradford assay, and immediately used to assay enzyme activity. For the malate dehydrogenase (MDH; EC 1.1.1.37) assay, the 200 μL reaction mix contained 50 mM sodium glycine buffer (pH 10), 30 mM malate, 10 μM rotenone, 1 mM NAD+, 0.055 mM phenazine methosulfate, brain homogenate (5–50 μg protein), and 0.11 mM 2,6-dichlorophenolindophenol (DCPIP).21 The baseline was established at 600 nm for 1 minute in the absence of DCPIP, and then the reaction was initiated by adding DCPIP. Absorbance was measured using a spectrophotometric plate reader at 600 nm for 1 minute at 37°C. The activity was expressed as nmol DCPIP reduced/minute/mg protein (ε600=19.1 mM−1 cm−1). The citrate synthase (CS, EC 4.1.3.7) assay mixture contained 100 mM assay buffer, 0.2 mM acetyl coenzyme A, 0.1 mM 5,5′-dithiobis(2-nitrobenzoic acid) (DTNB), 0.1 mM oxaloacetic acid, and 0.2% Triton X-100 with 5–50 μg of brain homogenate.22,23 The baseline reading was measured with the brain homogenate, assay buffer, acetyl coenzyme A, and DTNB for 1 minute at 30°C, and the reaction was initiated by the addition of oxaloacetic acid. An increase in absorbance at 412 nm was noted for 1 minute. Triton X-100 was added to fully permeabilize mitochondria, and the increase in absorbance was noted for 1 minute. The activity was expressed as nmol DTNB reduced/minute/mg protein (ε412=13.6 mM−1 cm−1).
Immunological quantitation of 3-NT protein and HNE
For 3-NT assessment, brain specimens were solubilized in 0.125 M Tris, pH 8.0, 0.1 mM EDTA, and 0.6 mM MgCl2 with protease inhibitors. Protein concentration was determined by BCA assay (Pierce, Rockford, IL, USA). Lysates were incubated with sample buffer (0.125 m Trizma base, pH 6.8, 4% sodium dodecyl sulfate (SDS), 20% glycerol) in a 1:1 ratio for 20 minutes. Protein (250 ng) was then blotted onto a nitrocellulose paper using a dot-blot apparatus (Bio-rad, Hercules, CA, USA), and probed with rabbit anti-nitrotyrosine antibody (Sigma, St Louis, MO, USA, 1:1,000). Blots were then stripped and reprobed with anti-β-actin antibody as a loading control. Blots were densitometrically quantified using ImageJ software (NIH, Bethesda, MD, USA). Statistical analyses were performed in GraphPad Prism, using a two-tailed t-test.
For HNE assessment, 50 mg of postmortem brain samples were lysed in 500 μL of sucrose lysis buffer (0.32 M sucrose with protease inhibitors, 0.125 M Tris pH 8.0, 0.1 mM EDTA, and 0.6 mM MgCl2), and protein concentrations were determined by BCA assay (Pierce). About 10 μL of lysate was incubated with 10 μL of buffer containing 0.125 M Tris, base pH 6.8, 4% (v/v) SDS, and 20% (v/v) glycerol. The resulting samples were loaded (250 ng per well) in the dot-blot apparatus, (Bio-rad) containing a nitrocellulose membrane, under vacuum pressure. The membrane was probed with anti-HNE antibody (Alpha Diagnostic International, San Antonio, TX; 1:2,000 dilution). Blots were then stripped and reprobed with anti-β-actin antibody as a loading control. Blots were densitometrically quantified using ImageJ software (NIH). Statistical analyses were performed in GraphPad Prism, using a two-tailed t-test.
Results
Genome-wide RNA microarray studies
In genome-wide microarray RNA studies of postmortem specimens across multiple brain regions from dementia cases (clinical dementia rating, CDR 5) and normal neurological controls (CDR 0), we explored whether the differing neurobiological and neuropathological features of dementia seen between young-old and oldest-old subjects are associated with differences in glucose energy metabolism in the brain. Consistent with evidence that dementia is associated with impaired energy metabolism in the brain,19,24–26 we identified a number of energy metabolism genes with abnormal expression in the brains of dementia subjects relative to age-matched normal neurological controls (Table 1). Interestingly, within the same CDR, we also observed significant differences in the expression of energy metabolism genes in the brains of young-old versus oldest-old subjects, indicating that there may be different mechanisms underlying the observed neuropathological differences in dementia between the two elderly populations.
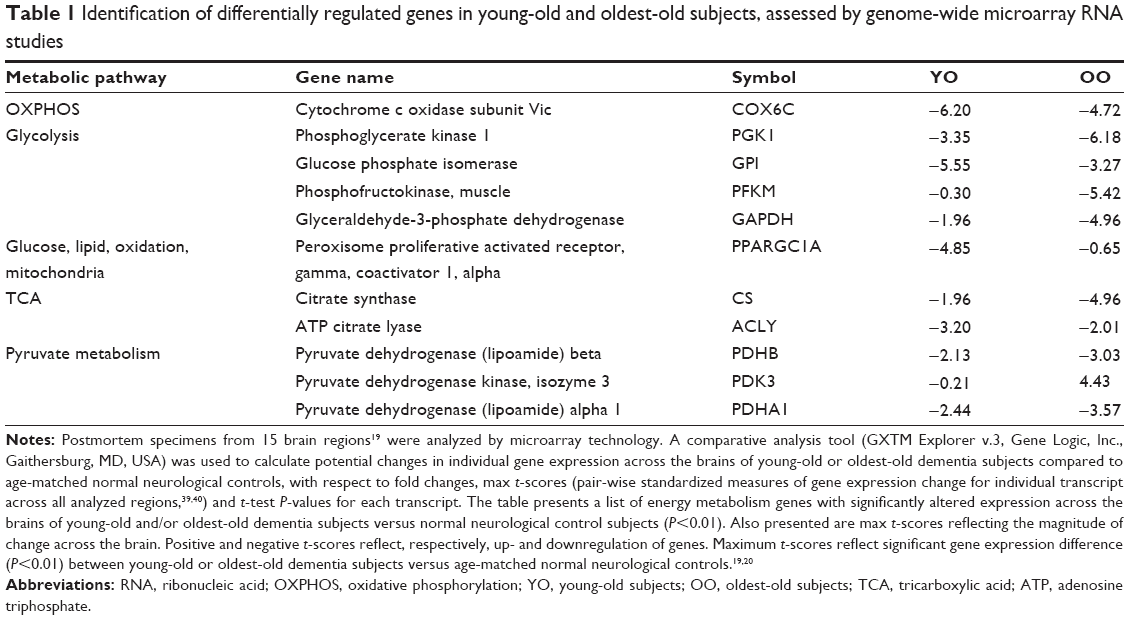 | Table 1 Identification of differentially regulated genes in young-old and oldest-old subjects, assessed by genome-wide microarray RNA studies |
Validation of DNA microarray studies using qPCR
Using independent qPCR analyses, we validated our microarray evidence for aberrant regulation of brain mitochondrial energy metabolism gene products in the young-old and oldest-old AD dementia subjects. By qPCR analysis of the superior/middle frontal gyrus (BM 9), a region associated with high vulnerability to AD neuropathology, we confirmed that the AD brain has significantly reduced expression of the pyruvate dehydrogenase α-1 subunit (PDHA), the catalytic component of the mitochondrial PDHC responsible for the generation of acetyl-CoA (Figure 2A). A change in PDHA expression was also found in young-old subjects, but this change did not reach statistical significance (Figure 2A).
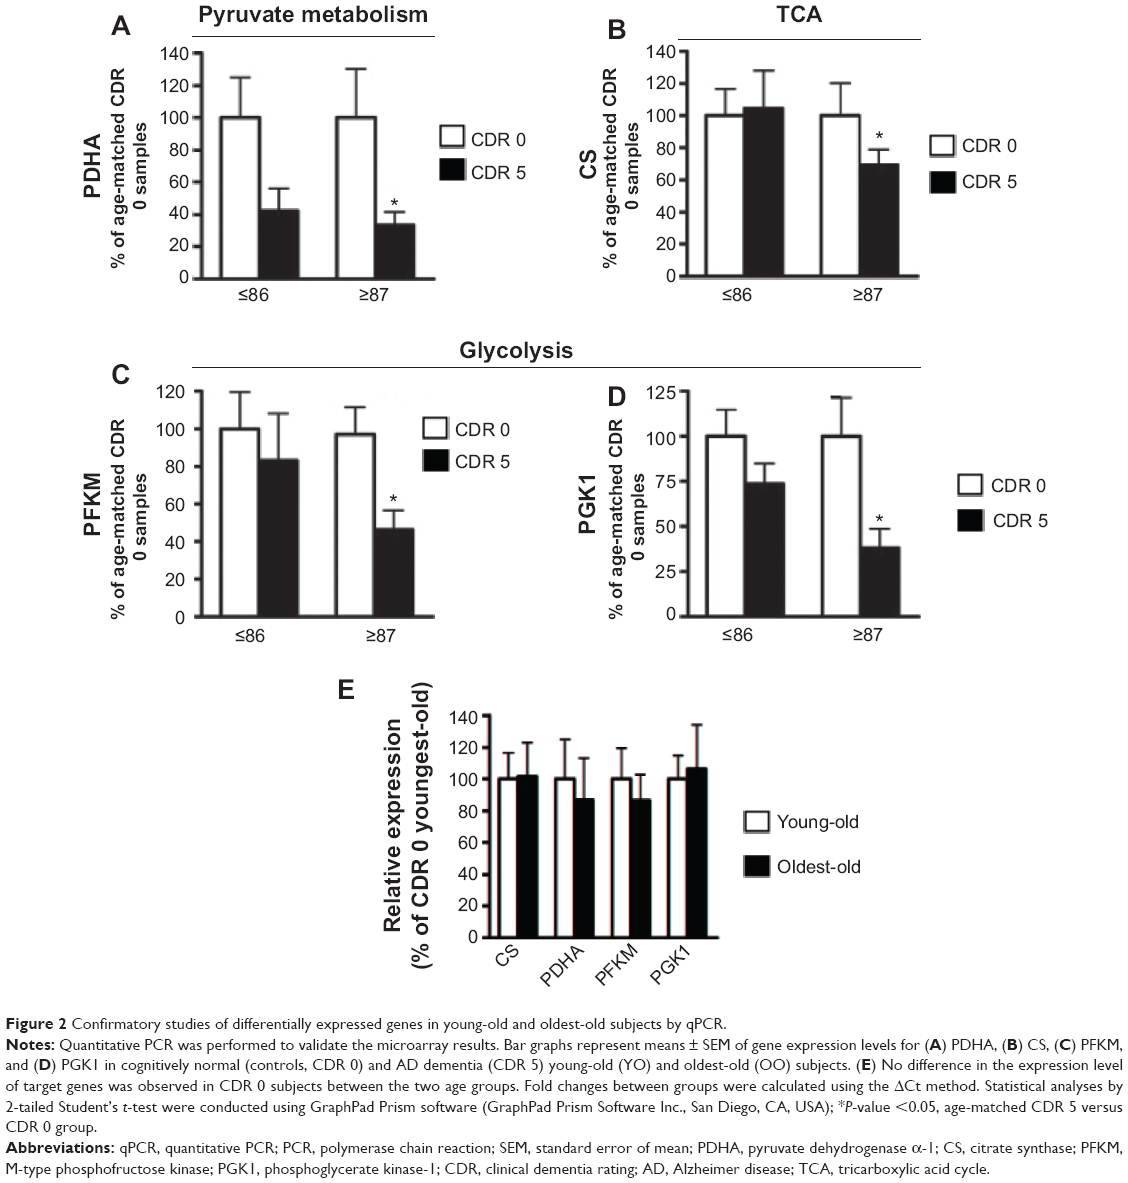 | Figure 2 Confirmatory studies of differentially expressed genes in young-old and oldest-old subjects by qPCR. |
Consistent with the above evidence, our qPCR studies confirmed that the expressions of certain glucose metabolism gene products, such as the TCA cycle enzyme CS (Figure 2B), glycolytic enzymes M-type phosphofructose kinase (PFKM) (Figure 2C), and phosphoglycerate kinase-1 (PGK1) (Figure 2D), are significantly and selectively downregulated only in the brains of the oldest-old AD dementia subjects. However, these gene products are not significantly decreased (eg, PGK1), or remain unchanged (eg, PFKM and CS), in the brains of young-old AD dementia subjects relative to the oldest-old AD dementia cases.
We found no detectable changes in PFKM, CS, PGK1, or PDHA1 gene product levels in the brains of normal neurological (CDR 0) oldest-old subjects compared to normal neurological young-old subjects (Figure 2E).
Selective alteration of TCA cycle gene products in the brains of oldest-old compared to young-old subjects as a function of clinical dementia
We found that PDHA (Figure 3A) and α-ketoglutarate dehydrogenase (KGDH, Figure 3B) were significantly decreased as a function of CDR in both young-old and oldest-old AD dementia subjects (all P-values <0.05). However, aconitase, succinate CoA ligase, MDH, and CS, were significantly decreased as a function of CDR only in the oldest-old subjects (all P-values <0.05, Figure 3C–F), supporting the hypothesis of selectivity of changes in mitochondrial function in the oldest-old AD dementia subjects.
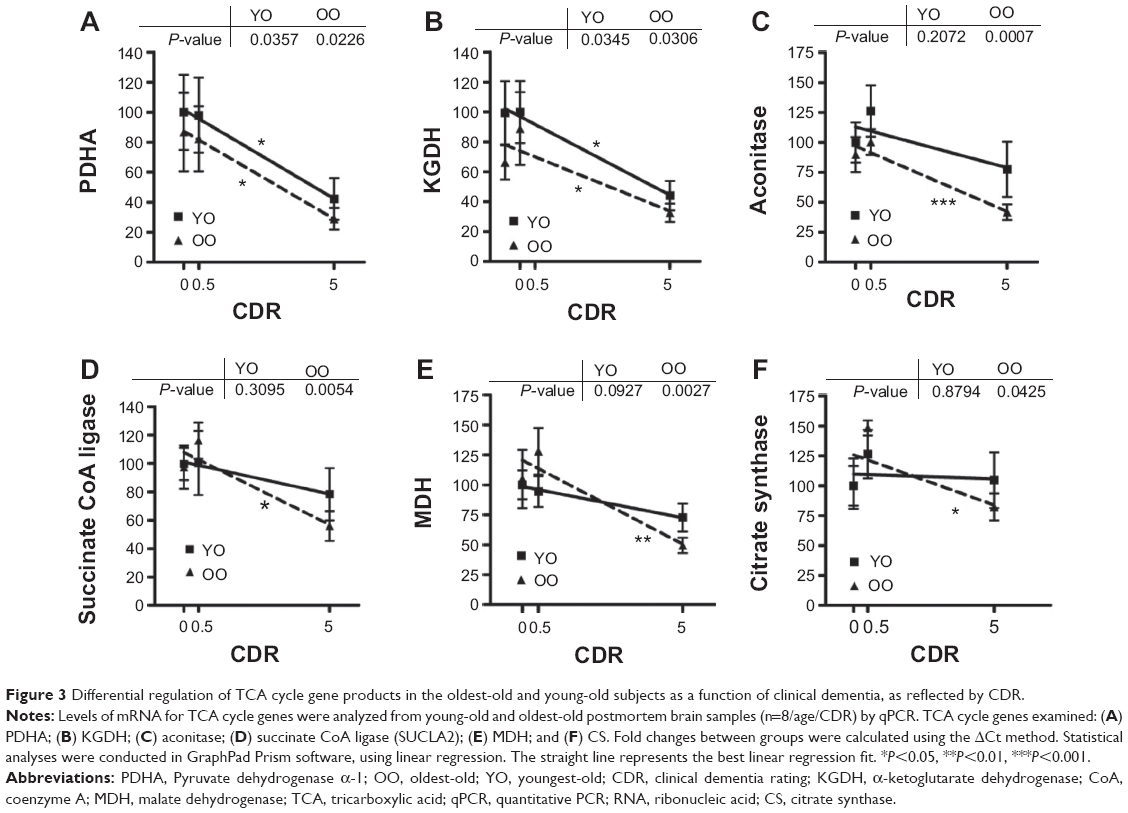 | Figure 3 Differential regulation of TCA cycle gene products in the oldest-old and young-old subjects as a function of clinical dementia, as reflected by CDR. |
Enzyme activity assays
To assess whether the decreased expression of TCA cycle genes could also lead to decreased enzymatic activity of the TCA cycle, we performed assays for CS and MDH. We found that in normal neurological control subjects (CDR 0), there was significantly higher CS activity in oldest-old subjects compared to young-old subjects. On the other hand, in AD dementia patients, CS activity in the brain of oldest-old subjects (CDR 5) was significantly lower than CS activity in young-old subjects (Figure 4A). We found no difference in MDH activity between young-old and oldest-old subjects for either normal neurological control cases or AD dementia cases (Figure 4B).
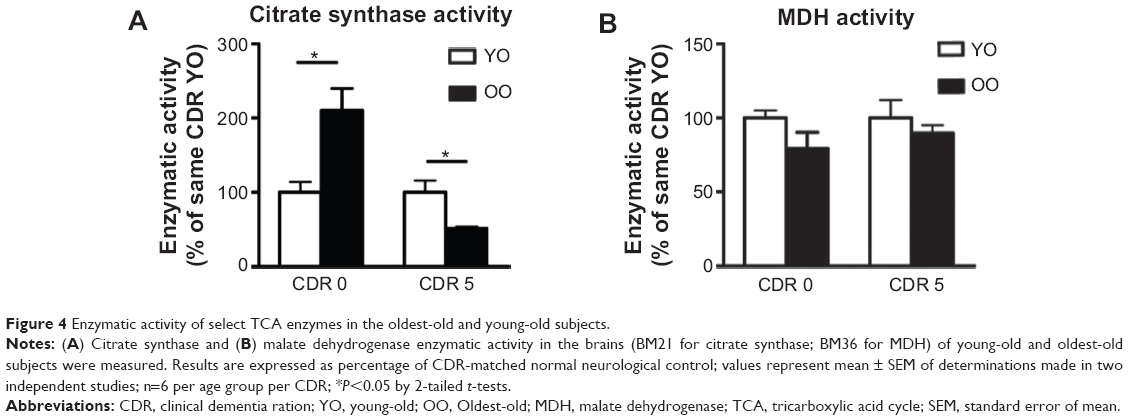 | Figure 4 Enzymatic activity of select TCA enzymes in the oldest-old and young-old subjects. |
Global oxidation profile changes
To gain insight into the potential changes in oxidative stress and mitochondrial energy metabolism in the progression of AD, we used a dot-blot approach (Figure 5A) to explore global lipid peroxidation and protein oxidation profiles in the same brain region (BM 9) of young-old and oldest-old AD dementia subjects relative to normal neurological control subjects. Surprisingly, we found significantly higher levels of HNE adducts (Figure 5B) and 3-NT-proteins (Figure 5C), which are indexes of lipid peroxidation and cellular protein oxidation, respectively, in the brains of oldest-old subjects at high risk for developing AD dementia (mild cognitive impairment, MCI; CDR 0.5). Lastly, we noticed that accumulation of HNE and 3-NT oxidative proteins eventually reaches a plateau in both the young-old and oldest-old cases as a function of clinical dementia (Figure 5B and C).
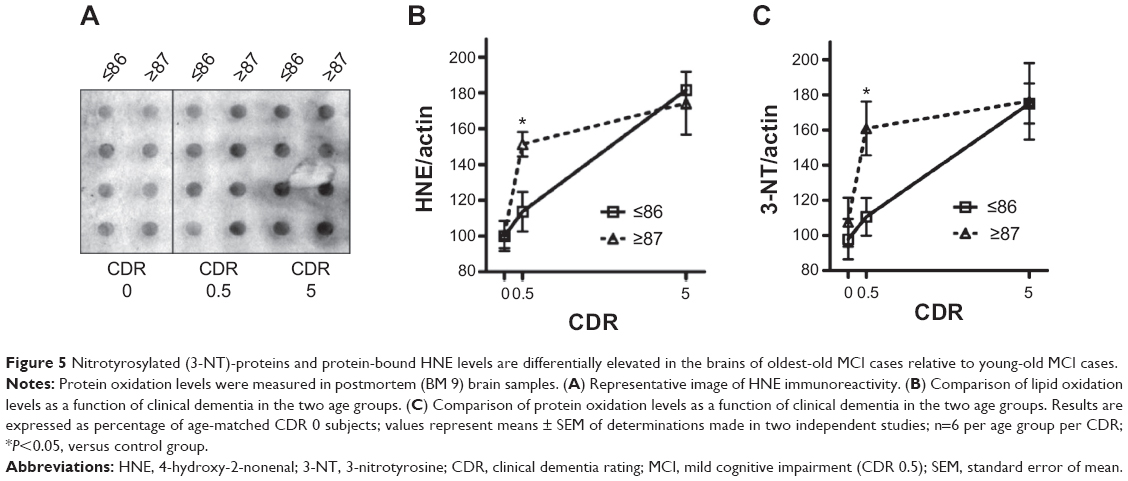 | Figure 5 Nitrotyrosylated (3-NT)-proteins and protein-bound HNE levels are differentially elevated in the brains of oldest-old MCI cases relative to young-old MCI cases. |
Discussion
Reduced energy metabolism in the brain is strongly associated with clinical disabilities.8,9 Even slight reductions in brain metabolism may lead to impaired judgment, memory, orientation, and other higher brain functions within seconds.27 More severe and prolonged impairment of brain glucose oxidation leads to more severe brain damage, including permanent dementia.27
The TCA cycle is the main pathway for glucose oxidative metabolism in the brain. Oxidative decarboxylation of pyruvate, the product of glycolysis, by the PDHC, leads to the generation of acetyl-CoA, which is then oxidatively metabolized by the TCA cycle. The TCA cycle involves eight enzymes: CS, aconitase, isocitrate dehydrogenase (ICDH), the α-KGDHC, succinate CoA ligase, succinate dehydrogenase (SDH), fumarase, and MDH. A few of these enzymes have already been measured in brains of young-old AD patients. For example, AD-related reductions in PDHC and KGDHC activity has been robustly documented by multiple groups.8,28,29 However, since these studies did not detect any deficits in CS or many of the other TCA cycle constituent enzymes (eg, MDH or fumarase), reduced PDHC and KGDHC activities do not necessarily reflect a general mitochondrial failure in the AD brain.30 Previous studies have not explored the potential impact of aging on changes in the regulation of the TCA cycle in the AD brain.30 This could be an important issue, since aging is associated with a precipitous decline in energy metabolism.31
Our study suggests that, in comparison to young-old subjects, dementia in the oldest-old subjects is correlated with more severe reductions in TCA cycle gene expression and enzymatic activity, especially CS and MDH, in the brain. The selective downregulation of PFKM and CS expression in the brains of oldest-old, but not young-old, AD subjects has important implications. PFKM is the major form of PFK in the brain.32,33 PFK is considered the most important regulatory enzyme for controlling the glycolytic pathway, since it catalyzes an irreversible step that commits glucose carbons to proceed down the glycolytic pathway. Similarly, CS is the rate-limiting enzyme of the TCA cycle and catalyzes the condensation of acetyl-CoA to oxaloacetate.34 MDH is involved in gluconeogenesis, which involves the conversion of smaller molecules into glucose. Moreover, working in concert with the malate-aspartate shuttle that translocates electrons from the cytosol across the mitochondrial inner membrane, MDH is critical in the conversion of electrons into ATP.34 Thus, while suboptimal energy metabolism in the brain may be a general risk factor for dementia, increasingly severe energy metabolism deficits in the brains of the oldest-old subjects may be an important mechanism leading to dementia, despite low levels of β-amyloid and tau neuropathology in these subjects compared to young-old subjects (Figure 6). Consistent with the evidence that reduced energy metabolism in the brain may contribute to dementia,35,36 treatment directed toward overcoming such deficits appears to benefit AD patients. For example, glucose and insulin administration improves memory in AD patients, at least transiently,37 and is associated with reduced AD neuropathology.38
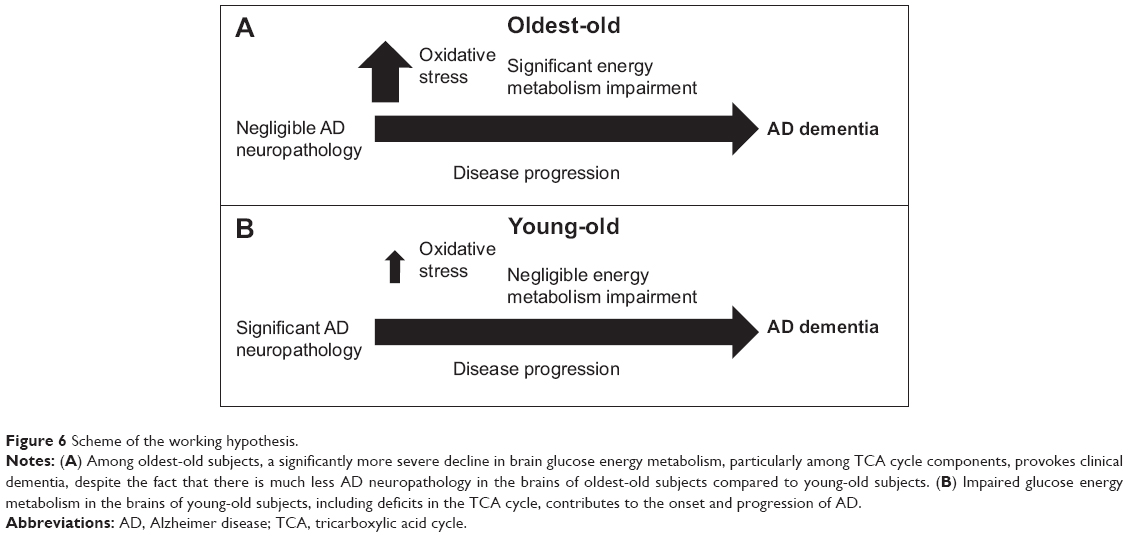 | Figure 6 Scheme of the working hypothesis. |
Our observations suggest that increasingly severe mitochondrial energy metabolism deficiency in the brains of oldest-old subjects could be an important mechanism leading to dementia, despite negligible AD neuropathology in these subjects compared to young-old subjects (Figure 1B).20 This selective deficit in key mitochondrial energy metabolic processes in the brains of oldest-old AD subjects appears to be a novel neurobiological substrate of dementia, independent of normal aging processes, since we did not observe any differences in PFKM, CS, PGK1, or PDHA1 mRNA levels in the brains of normal neurological (CDR 0) oldest-old subjects compared to normal neurological young-old subjects (Figure 2E).
Oxidative stress is another consistent feature of AD.10,11 Evidence suggests that oxidative modification proteins, such as nitrosylation and lipid oxidation proteins, generally lead to inhibition of biological functions and/or enzymatic activities resulting from changes in protein conformation, protein cross-linking, and/or protein degradation.12–14,16–18 Surprisingly, we found that levels of HNE and 3-NT oxidative proteins were already significantly elevated in brains of subjects at high risk of developing AD, only in the oldest-old subjects. The reason why oxidative conditions leading to abnormal levels of oxidative proteins exist only in the oldest-old subjects even before dementia onset is unknown. This scenario potentially suggests that mitochondrial impairment in oldest-old subjects may be an early consequence of selective impairment of antioxidant conditions, even in conditions of negligible AD neuropathology. Our studies tentatively suggest that among oldest-old subjects, MCI is a period of particular vulnerability to oxidative stress cascades, and that antioxidant treatment for MCI may be the most effective way to attenuate progression to AD dementia in these subjects.
Acknowledgments
This material is the result of work supported in part with resources and the use of facilities at the James J. Peters Veterans Affairs Medical Center, Bronx, NY. In addition, Dr. Pasinetti holds a Career Scientist Award in the Research and Development unit and is the Director of the Basic and Biomedical Research and Training Program, GRECC, James J. Peters Veterans Affairs Medical Center. We also acknowledge that the contents of this manuscript do not represent the views of the U.S. Department of Veterans Affairs or the United States Government.
Disclosure
The authors report no conflicts of interest in this work.
References
Kawas CH. The oldest old and the 90+ Study. Alzheimers Dement. 2008;4(1 Suppl 1):S56–S59. | ||
Haroutunian V, Schnaider-Beeri M, Schmeidler J, et al. Role of the neuropathology of Alzheimer disease in dementia in the oldest-old. Arch Neurol. 2008;65(9):1211–1217. | ||
Prohovnik I, Perl DP, Davis KL, Libow L, Lesser G, Haroutunian V. Dissociation of neuropathology from severity of dementia in late-onset Alzheimer disease. Neurology. 2006;66(1):49–55. | ||
Corrada MM, Brookmeyer R, Berlau D, Paganini-Hill A, Kawas CH. Prevalence of dementia after age 90: results from the 90+ study. Neurology. 2008;71(5):337–343. | ||
Hebert LE, Scherr PA, Bienias JL, Bennett DA, Evans DA. Alzheimer disease in the US population: prevalence estimates using the 2000 census. Arch Neurol. 2003;60(8):1119–1122. | ||
von Strauss E, Viitanen M, De Ronchi D, Winblad B, Fratiglioni L. Aging and the occurrence of dementia: findings from a population-based cohort with a large sample of nonagenarians. Arch Neurol. 1999;56(5):587–592. | ||
Ebly EM, Parhad IM, Hogan DB, Fung TS. Prevalence and types of dementia in the very old: results from the Canadian Study of Health and Aging. Neurology. 1994;44(9):1593–1600. | ||
Blass JP, Sheu KF, Cooper AJ, Jung EH, Gibson GE. Thiamin and Alzheimer’s disease. J Nutr Sci Vitaminol (Tokyo). 1992; Spec No: 401–404. | ||
Roze E, Saudou F, Caboche J. Pathophysiology of Huntington’s disease: from huntingtin functions to potential treatments. Curr Opin Neurol. 2008;21(4):497–503. | ||
Markesbery WR, Carney JM. Oxidative alterations in Alzheimer’s disease. Brain Pathol. 1999;9(1):133–146. | ||
Smith CD, Carney JM, Tatsumo T, Stadtman ER, Floyd RA, Markesbery WR. Protein oxidation in aging brain. Ann N Y Acad Sci. 1992;663:110–119. | ||
Cecarini V, Ding Q, Keller JN. Oxidative inactivation of the proteasome in Alzheimer’s disease. Free Radic Res. 2007;41(6):673–680. | ||
Butterfield DA, Reed TT, Perluigi M, et al. Elevated levels of 3-nitrotyrosine in brain from subjects with amnestic mild cognitive impairment: implications for the role of nitration in the progression of Alzheimer’s disease. Brain Res. 2007;1148:243–248. | ||
Sultana R, Reed T, Perluigi M, Coccia R, Pierce WM, Butterfield DA. Proteomic identification of nitrated brain proteins in amnestic mild cognitive impairment: a regional study. J Cell Mol Med. 2007;11(4):839–851. | ||
Pamplona R, Dalfo E, Ayala V, et al. Proteins in human brain cortex are modified by oxidation, glycoxidation, and lipoxidation. Effects of Alzheimer disease and identification of lipoxidation targets. J Biol Chem. 2005;280(22):21522–21530. | ||
Sharov VS, Galeva NA, Dremina ES, Williams TD, Schoneich C. Inactivation of rabbit muscle glycogen phosphorylase b by peroxynitrite revisited: does the nitration of Tyr613 in the allosteric inhibition site control enzymatic function? Arch Biochem Biophys.2009;484(2):155–166. | ||
Marcondes S, Turko IV, Murad F. Nitration of succinyl-CoA: 3-oxoacid CoA-transferase in rats after endotoxin administration. Proc Natl Acad Sci U S A. 2001;98(13):7146–7151. | ||
Souza JM, Choi I, Chen Q, et al. Proteolytic degradation of tyrosine nitrated proteins. Arch Biochem Biophys. 2000;380(2):360–366. | ||
Katsel P, Tan W, Haroutunian V. Gain in brain immunity in the oldest-old differentiates cognitively normal from demented individuals. PLoS One. 2009;4(10):e7642. | ||
Haroutunian V, Katsel P, Schmeidler J. Transcriptional vulnerability of brain regions in Alzheimer’s disease and dementia. Neurobiol Aging. 2009;30(4):561–573. | ||
Rokosh DA, Kurz WG, LaRue TA. A modification of isocitrate and malate dehydrogenase assays for use in crude cell free extracts. Anal Biochem. 1973;54(2):477–483. | ||
Trounce IA, Kim YL, Jun AS, Wallace DC. Assessment of mitochondrial oxidative phosphorylation in patient muscle biopsies, lymphoblasts, and transmitochondrial cell lines. Methods Enzymol. 1996;264:484–509. | ||
Barrientos A. In vivo and in organello assessment of OXPHOS activities. Methods. 2002;26(4):307–316. | ||
Chen X, Stern D, Yan SD. Mitochondrial dysfunction and Alzheimer’s disease. Curr Alzheimer Res. 2006;3(5):515–520. | ||
de la Torre JC. Pathophysiology of neuronal energy crisis in Alzheimer’s disease. Neurodegener Dis. 2008;5(3–4):126–132. | ||
Mosconi L, Pupi A, De Leon MJ. Brain glucose hypometabolism and oxidative stress in preclinical Alzheimer’s disease. Ann N Y Acad Sci. 2008;1147:180–195. | ||
Plum F, Posner JB. The diagnosis of stupor and coma. Contemp Neurol Ser. 1972;10:1–286. | ||
Sheu KF, Cooper AJ, Koike K, Koike M, Lindsay JG, Blass JP. Abnormality of the alpha-ketoglutarate dehydrogenase complex in fibroblasts from familial Alzheimer’s disease. Ann Neurol. 1994;35(3):312–318. | ||
Sheu KF, Kim YT, Blass JP, Weksler ME. An immunochemical study of the pyruvate dehydrogenase deficit in Alzheimer’s disease brain. Ann Neurol. 1985;17(5):444–449. | ||
Bubber P, Haroutunian V, Fisch G, Blass JP, Gibson GE. Mitochondrial abnormalities in Alzheimer brain: mechanistic implications. Ann Neurol. 2005;57(5):695–703. | ||
Tumeh PC, Alavi A, Houseni M, et al. Structural and functional imaging correlates for age-related changes in the brain. Semin Nucl Med. 2007;37(2):69–87. | ||
Dunaway GA, Kasten TP. Characterization of the rat heart 6-phosphofructo-1-kinase isozymes. J Mol Cell Cardiol. 1985;17(10):947–957. | ||
Dunaway GA, Kasten TP. Nature of the rat brain 6-phosphofructo-1-kinase isozymes. J Biol Chem. 1985;260(7):4180–4185. | ||
Lehninger AL, Nelson DL, Cox MM. Lehninger Principles of Biochemistry. New York, NY: W. H. Freeman; 2005. | ||
Gibson GE, Karuppagounder SS, Shi Q. Oxidant-induced changes in mitochondria and calcium dynamics in the pathophysiology of Alzheimer’s disease. Ann N Y Acad Sci. 2008;1147:221–232. | ||
Shi Q, Gibson GE. Oxidative stress and transcriptional regulation in Alzheimer disease. Alzheimer Dis Assoc Disord. 2007;21(4):276–291. | ||
Craft S. Insulin resistance syndrome and Alzheimer’s disease: age- and obesity-related effects on memory, amyloid, and inflammation. Neurobiol Aging. 2005;26(Suppl 1):65–69. | ||
Beeri MS, Schmeidler J, Silverman JM, et al. Insulin in combination with other diabetes medication is associated with less Alzheimer neuropathology. Neurology. 2008;71(10):750–757. | ||
Budhraja V, Spitznagel E, Schaiff WT, Sadovsky Y. Incorporation of gene-specific variability improves expression analysis using high-density DNA microarrays. BMC Biol. 2003;1:1. | ||
Mariani TJ, Budhraja V, Mecham BH, Gu CC, Watson MA, Sadovsky Y. A variable fold change threshold determines significance for expression microarrays. FASEB J. 2003;17(2):321–323. |
 © 2015 The Author(s). This work is published and licensed by Dove Medical Press Limited. The full terms of this license are available at https://www.dovepress.com/terms.php and incorporate the Creative Commons Attribution - Non Commercial (unported, v3.0) License.
By accessing the work you hereby accept the Terms. Non-commercial uses of the work are permitted without any further permission from Dove Medical Press Limited, provided the work is properly attributed. For permission for commercial use of this work, please see paragraphs 4.2 and 5 of our Terms.
© 2015 The Author(s). This work is published and licensed by Dove Medical Press Limited. The full terms of this license are available at https://www.dovepress.com/terms.php and incorporate the Creative Commons Attribution - Non Commercial (unported, v3.0) License.
By accessing the work you hereby accept the Terms. Non-commercial uses of the work are permitted without any further permission from Dove Medical Press Limited, provided the work is properly attributed. For permission for commercial use of this work, please see paragraphs 4.2 and 5 of our Terms.