")
Back to Journals » Nature and Science of Sleep » Volume 6
Impact of middle-of-the-night awakenings on health status, activity impairment, and costs
Authors Moline M, DiBonaventura M, Shah D, Ben-Joseph R
Received 23 April 2014
Accepted for publication 26 May 2014
Published 23 July 2014 Volume 2014:6 Pages 101—111
DOI https://doi.org/10.2147/NSS.S66696
Checked for plagiarism Yes
Review by Single anonymous peer review
Peer reviewer comments 5
Margaret Moline,1 Marco daCosta DiBonaventura,2 Dhvani Shah,1 Rami Ben-Joseph1
1Purdue Pharma, LP, Stamford, CT, USA; 2Health Outcomes Practice, Kantar Health, New York, NY, USA
Study objectives: Middle-of-the-night (MOTN) awakenings with difficulty returning to sleep are among the most common symptoms of insomnia. Despite the epidemiological studies that have been conducted, there is a lack of data on the impact of MOTN awakenings on health status and socioeconomic indicators in comparison with other insomnia symptoms.
Methods: Data were analyzed from the 2011 US National Health and Wellness Survey (adults ≥18 years old; N=60,783), which asked respondents whether they had experienced specific symptoms of insomnia (ie, MOTN awakenings, difficulty falling asleep, waking several times, waking up too early, or poor quality of sleep). Respondents who reported only one insomnia symptom were compared among insomnia subgroups and with no insomnia symptom controls with respect to demographics, health history, and health outcomes (Short Form-12v2, Work Productivity and Activity Impairment questionnaire, and costs). Additional analyses compared respondents with only MOTN awakenings and matched controls on health outcomes.
Results: MOTN awakenings without other insomnia symptoms were reported by 3.5% of respondents. Poor quality of sleep was associated with the strongest effects on health status compared with other insomnia symptoms even after adjusting for demographic and health characteristics differences. Differences across insomnia symptoms with respect to cost-related outcomes were generally modest, though all were higher (if not significantly so) than respondents without insomnia. Respondents who experienced only waking several times and only MOTN awakenings had the highest direct costs, while respondents who experienced only poor quality of sleep and only difficulty falling asleep had the highest indirect costs. Respondents with only MOTN awakenings reported significantly worse mental and physical health status and worse health utilities relative to insomnia-free matched controls (all P<0.05). Annual per-employee indirect costs were also significantly higher ($4,328 vs $3,000; P<0.05). Among only MOTN awakenings respondents, 74.6% were considered only symptomatic (ie, they did not report having insomnia or having been diagnosed with insomnia).
Conclusion: These findings collectively highlight the prevalence and socioeconomic impact of specific types of insomnia symptoms, including MOTN awakenings, experienced by adults in the US.
Keywords: insomnia, nocturnal awakenings, work productivity, health outcomes, sleep quality, sleep symptoms
Introduction
Middle-of-the-night (MOTN) awakenings with difficulty returning to sleep are among the most common symptoms of insomnia.1–2 The National Comorbidity Survey Replication found that MOTN awakenings (defined in the study as difficulty maintaining sleep) occurred in 19.9% of the population in the past 12 months, compared with 16.4% who experience difficulty initiating sleep and 16.7% who experience early morning awakenings.2 In a large epidemiological study in Europe, 16% of the general population reported experiencing MOTN awakenings at least three times per week.3 MOTN awakenings have been found to be significantly more prevalent in women than in men and become more common with age, with 23% of those 65 years or older experiencing this symptom.3 Nevertheless, sleep interruptions, including MOTN awakenings, are present in people of all ages.4
Broadly speaking, the symptoms of insomnia have been associated with substantial impairments in quality of life, productivity at work and during daily activities, and additional health care resource utilization.2,5–7 Using the 2005 National Health and Wellness Survey (NHWS) data, Bolge et al found significant decrements in both mental and physical health status (as assessed using the Short Form-8) and over 13% more presenteeism (the percentage of impairment experienced while at work in the past 7 days because of one’s health) among those with insomnia compared with those without.7 Roth and colleagues examined the associations with individual sleep symptoms (including MOTN awakenings) on role impairments;2 the specific effect of MOTN awakenings on a broader set of health outcomes has not been previously examined. Prior studies have documented a substantial burden of nocturnal awakenings (including, but not limited to, those with MOTN awakenings).3 Reports of daytime sleepiness, fatigue, and cognitive impairments were all higher among those with three or more nights of nocturnal awakenings per week compared with patients without nocturnal awakenings, even after adjusting for age, gender, and occupation.3 Moreover, those who experience nocturnal awakenings were significantly more likely to report taking sick leave.8
Despite the epidemiological studies that have been conducted on MOTN awakenings, and the studies which have documented the burden of insomnia and nocturnal awakenings in general, whether different insomnia symptoms are associated with different consequences is not well understood. The primary aim of the current study was to use a large, nationally representative database to explore the impact of MOTN awakenings compared with other insomnia symptoms on health status, activity impairment, and indirect and direct costs. The comparison of the differential effects of insomnia symptoms on indirect and direct costs is particularly novel. A secondary aim was to focus on the burden associated with MOTN awakenings specifically relative to a matched control group. Although prior studies have investigated MOTN awakenings, no study to our knowledge has explored its isolated effect on health outcomes in the general population. Given these aims, we hypothesized that each sleep symptom would individually be associated with a decrement in health status and activity impairment and an increase in costs relative to those without sleep symptoms; however, we did not have a priori hypotheses regarding the specific pattern of which symptoms would be more or less detrimental than others.
Methods
Data source
The 2011 US NHWS dataset was used for this study (N=75,000). The NHWS is an annual, cross-sectional Internet survey given to a sample of adults (18 years and older) who were identified through a web-based panel. All adults in the US are eligible to join this panel, and members are recruited through a variety of means, including through opt-in emails, coregistration with other panels, e-newsletters, and online banner placements. The panel is not a purely convenience sample source, as members are recruited in such a way as to resemble the US adult population with respect to several demographic characteristics (age, sex, education, income, Census region), though differences between the US adult population and panel membership on these variables are still present. All panelists explicitly agreed to become panel members and complete in-depth demographic registration profiles as part of the membership process.
Invitations to participate in the NHWS were sent to members of this panel using a random stratified sampling framework to ensure the final sample of NHWS participants was representative of the adult population in the US (essentially, to improve upon the similarities observed between the US population and the panel membership). Each year, data from the Current Population Survey of the US Census (United States Bureau of the Census, 2012) are used to identify the relative proportions of age, gender, and racial/ethnic groups in the US; these proportions were then mimicked during the recruiting of panel members to ensure the final NHWS sample matched the demographic proportion of the US. Although other relevant factors (education, Census region, income, etc) were not included in the sampling frame, these factors have shown comparability with the US adult population as reported elsewhere.7,9–10 Comparisons between the NHWS and other established sources (US Census, National Health Interview Survey, National Health and Nutrition Examination Survey, Medical Expenditure Panel Survey [MEPS], etc) have been also been made previously.7,9–10 All NHWS respondents provided informed consent. The study protocol, including the informed consent, was reviewed and approved by an institutional review board.
Sample
Because of the potential for outliers with respect to health outcomes, respondents who had been diagnosed with cancer or human immunodeficiency virus/acquired immunodeficiency syndrome (HIV/AIDS) were excluded from all analyses (n=6,644). In addition, respondents who reported they had sleep apnea or had been diagnosed with sleep-disordered breathing, parasomnia, circadian rhythm sleep disorder, narcolepsy, restless legs syndrome, or another sleep condition other than insomnia (n=7,573) were also excluded from the analysis regardless of what other insomnia symptoms they experienced. The final analytical sample size was N=60,783.
Measures
Insomnia symptoms: All respondents of the NHWS were asked, “Which of the following sleep problems or symptoms do you regularly experience?” and then presented with a list of symptoms to select. These symptoms included “difficulty falling asleep,” “waking during the night and not being able to get back to sleep” (hereafter referred to as “MOTN awakenings”), “poor quality of sleep,” “waking up several times during the night,” and “waking up too early.” Respondents who did not report any of these symptoms were considered not to have insomnia.
Awareness: Aside from symptoms, respondents were also asked whether they considered themselves to have insomnia or sleep difficulties (yes or no). If they responded yes, they were then asked whether their condition had been diagnosed by a physician.
Demographics: Several demographic characteristics were also assessed including age, race/ethnicity, gender, marital status (married/living with partner versus all else), education (less than a college degree versus college graduate), and annual household income (<$25,000, $25,000 to <$50,000, $50,000 to <$75,000, ≥$75,000, decline to answer).
Health characteristics: Respondents provided their height and weight (with the option to decline to provide their weight). From this information, a body mass index (BMI) category was calculated: underweight (<18.5 kg/m2), normal weight (18.5 to <25 kg/m2), overweight (25 to <30 kg/m2), obese (≥30.0 kg/m2), and decline to answer (a category reserved for those who did not provide their weight). Alcohol consumption (consume alcohol versus abstain from alcohol), exercise behavior (do not regularly exercise versus regularly exercise) and tobacco smoking (current smoker, former smoker, or nonsmoker) were also assessed.
Comorbidities: The Charlson comorbidity index (CCI) was used to assess the overall comorbidity burden of each respondent.11 The CCI is calculated by weighting the presence of the following conditions (self-reported by the respondent as being diagnosed by a physician) and summing the result: HIV/AIDS, metastatic tumor, lymphoma, leukemia, any tumor, moderate/severe renal disease, hemiplegia, diabetes, mild liver disease, ulcer disease, connective tissue disease, chronic pulmonary disease, dementia, cerebrovascular disease, peripheral vascular disease, myocardial infarction, and congestive heart failure. HIV/AIDS and cancer did not factor into the CCI for the current study, as they had been excluded per the study criteria. The greater the total index score, the greater the comorbid burden on the patient.
Health status: The current study used the Short Form 12 version 2 (SF-12v2) to assess general health status using a 4-week recall.12 The twelve items of the SF-12v2 were entered into an algorithm created by the instrument’s developer (QualityMetric, Lincoln, RI, USA) to calculate two summary scores (mental [MCS] and physical component summary [PCS] scores), which are normed to the population (Mean =50; standard deviation [SD] =10), and eight domain scores (which were non-normed in this study): general health, physical functioning, physical role limitations, bodily pain, vitality, social functioning, emotional role limitations, and mental health.12 Higher values indicate better health. Additionally, the items from the SF-12v2 were also used to calculate a preference-based health utility score, which represents how a particular health state is valued. These values vary conceptually from 0 (representing a health status equivalent to death) to 1 (representing a health state equivalent to perfect health). Prior evidence has suggested differences of 3, 5, and 0.03 points, for summary, domain, and health utility scores, respectively, represent clinically meaningful differences.3–14 Because of the instrument’s generic nature, the values derived from the SF-12v2 items can be compared across disease states and with the general population.12 All respondents provided data on the SF-12v2 items and no missing data was observed.
Indirect costs and activity impairment: Indirect costs were assessed using the general health version of the Work Productivity and Activity Impairment (WPAI) questionnaire.15 The WPAI produces a measure of overall work impairment, which represents the percentage of work time in the past week that was lost either due to absenteeism (the percentage of work time missed because of one’s health) or presenteeism (the percentage of health-related impairment while at work).16 The overall percentage of work impairment was then multiplied by the median US salary to estimate the lost wages for each respondent who reported being currently employed (ie, the human capital approach). This method has been outlined in prior research.17 All those currently employed provided data on overall work impairment and no missing data among these respondents were observed. The WPAI also provides an activity impairment metric which represents that percentage of impairment experienced during daily activities. All respondents provided data on activity impairment.
Direct costs: The number of traditional health care provider visits, emergency room (ER) visits, and hospitalizations in the past 6 months was provided by each respondent (there was no missing data). The direct costs of these events were estimated by applying unit costs from the MEPS dataset and multiplying by two to project to annual costs.18 This method has also been outlined in prior research.17
Statistical analysis
There were two components to this analysis. First, respondents who reported experiencing only MOTN awakenings were compared with other groups of respondents who reported experiencing only one other insomnia symptom (ie, difficulty falling asleep, waking several times, waking up too early, or poor quality of sleep) and with respondents without insomnia symptoms. Given the anticipated overlap of experiencing multiple symptoms, this analysis was done to isolate factors that may be related to one symptom over another. Comparisons were made on demographic and health history variables using chi-square tests and one-way ANOVAs. In addition, differences across these groups were examined with respect to health outcomes (ie, health status, indirect costs, activity impairment, and direct costs), controlling for age, sex, race/ethnicity, education, household income, BMI, alcohol use, smoking behavior, exercise behavior, and the CCI using regression modeling (general linear models for health status variables and generalized linear models, specifying a negative binomial distribution and a log link function, for all other outcomes). Adjusted means from these regression models were reported; post hoc comparisons among analysis groups were then calculated using a Tukey–Kramer adjustment.
Second, respondents who reported experiencing only MOTN awakenings (and no other insomnia symptoms) were compared with respondents without insomnia symptoms to isolate the effect of MOTN awakenings on health outcomes using a propensity score matching method. Demographic and health history variables which were significantly different between those with only MOTN awakenings and those without insomnia (age, sex, race/ethnicity, education, household income, BMI, alcohol use, smoking behavior, exercise behavior, and the CCI) were then entered into a logistic regression model to predict group membership (MOTN awakenings versus no insomnia symptoms). Propensity score values from this model were extracted. Next, a greedy-matching algorithm was implemented in order to match each respondent with only MOTN awakenings with a suitable control (1:1 match). Postmatch differences in health status, activity impairment, and indirect and direct costs were then made using one-way ANOVAs.
All statistical analyses were conducted in SASv9.1. Statistical significance was set a priori at P<0.05. No corrections were made for multiplicity.
Results
Epidemiology
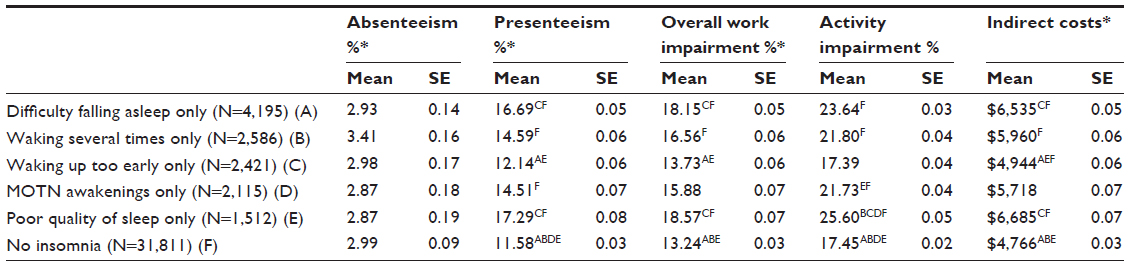
A total of 28,972 respondents (47.7%) experienced at least one insomnia symptom (see Figure 1). The most common single symptom experienced by respondents included difficulty falling asleep (n=4,195; 6.9% of all respondents), waking up several times (n=2,586; 4.3%), waking up too early (n=2,421; 4.0%), MOTN awakenings (n=2,115; 3.5%), and poor quality of sleep (n=1,512; 2.5%).
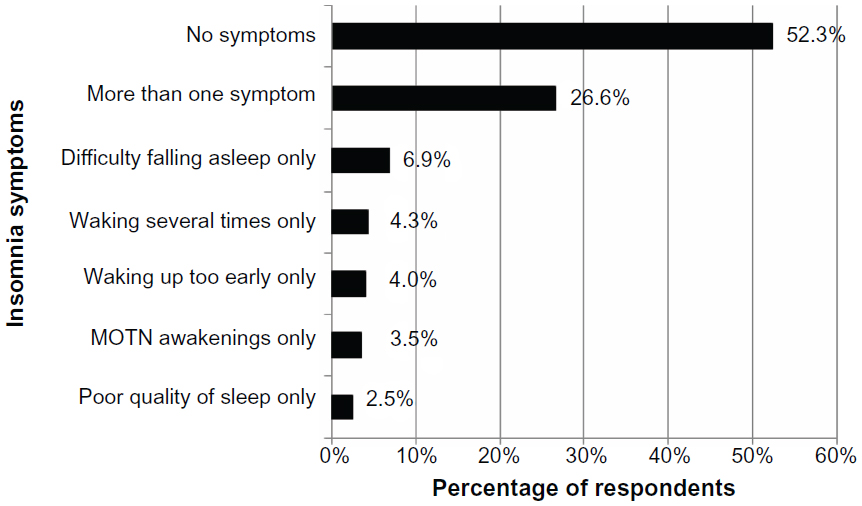 | Figure 1 Prevalence of insomnia symptoms among total sample (N=60,783). |
Among the 26.6% of respondents (n=16,143) who reported experiencing more than one symptom, the most commonly experienced symptom was difficulty falling asleep (66.7% of that group), followed by waking up several times (59.8%), MOTN awakenings (58.8%), waking up too early (51.5%), and poor quality of sleep (51.0%).
Demographic and health history of patients with insomnia symptoms
Compared with other respondents who reported only a single insomnia symptom (difficulty falling asleep, waking up several times, waking up too early, or poor quality of sleep), respondents who reported only MOTN awakenings were predominantly female (61.0%) and were the oldest (see Table 1) with a mean age of 53.4 years (SD =15.60). The age of other insomnia symptom groups ranged from 41 years for respondents with poor quality of sleep as their sole symptom to 52 years for respondents with waking up too early as their only insomnia symptom. Respondents with only MOTN awakenings were also the most likely to be college educated (47.8%), and have a household income $75K or more (30.2%) compared with all other groups.
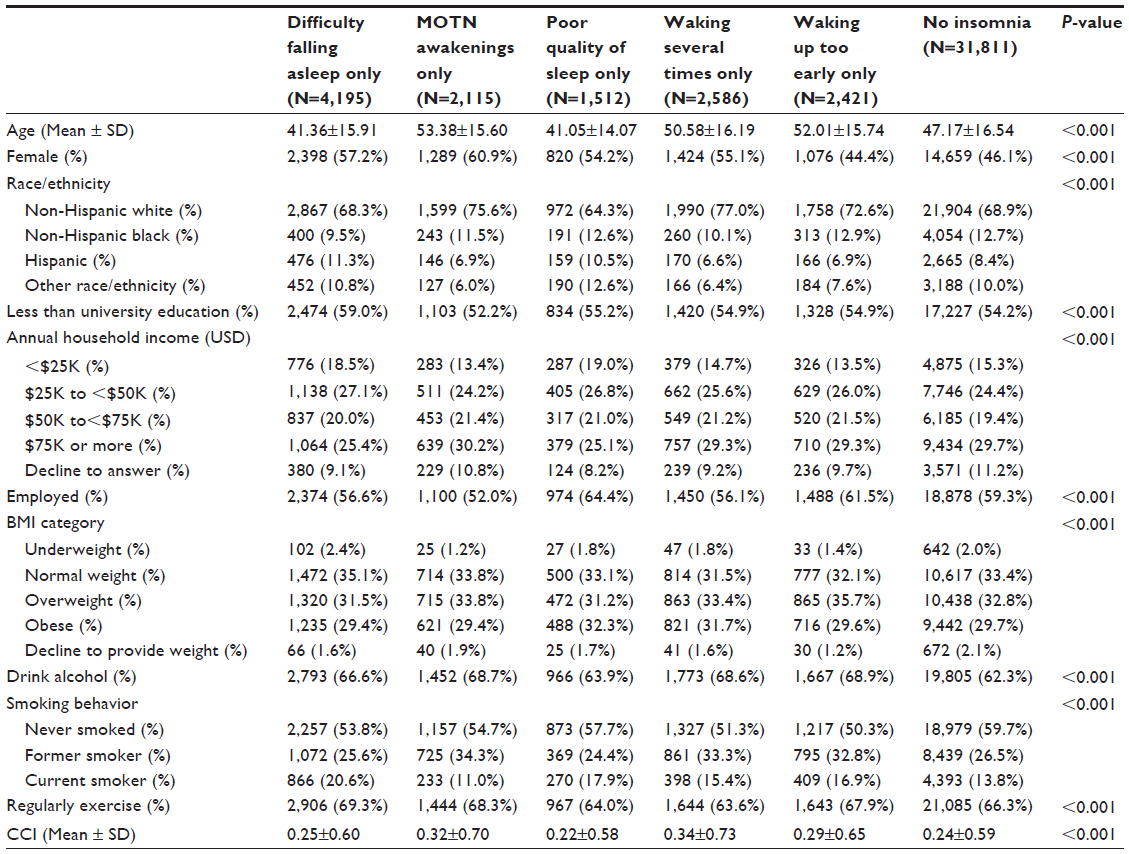 | Table 1 Demographic and health history of those with different insomnia symptoms |
Health outcome differences across insomnia symptom groups
Health outcome comparisons were made between respondents who reported only a single insomnia symptom and those without insomnia, adjusting for demographic and health history variables (see Table 2). With respect to health status, all symptom groups were significantly worse than those without symptoms (all P<0.05, with the exception of the difference in physical health status between respondents who reported waking up too early and respondents without insomnia; 49.4 versus 49.3, respectively). Although PCS scores were generally comparable across insomnia symptom groups (ranging between 48.2 and 49.4), respondents with only poor quality of sleep reported both the poorest MCS score (adjusted mean =45.9) and health utility score (adjusted mean =0.72) followed by respondents with only difficulty falling asleep (adjusted means =47.6 and 0.74, respectively). MCS score and health utility score differences between respondents with only poor quality of sleep and other groups (aside from respondents who reported only difficulty falling asleep) could be considered clinically meaningful (ie, differences greater than three points for MCS and 0.03 points for health utilities) (see Table 2).
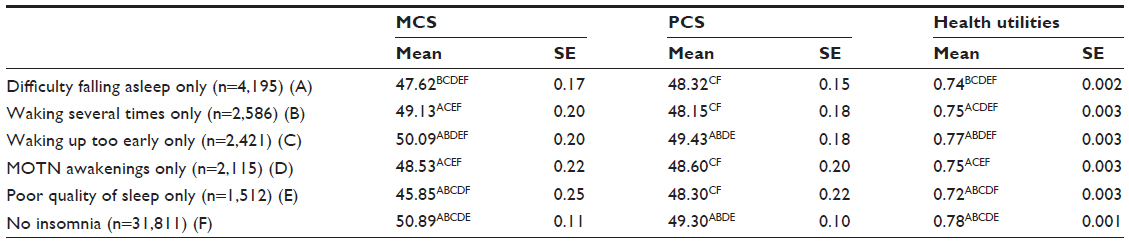 | Table 2 Adjusted levels of health status of those with various insomnia symptoms and those without insomnia |
All groups reported significantly more physician visits relative to respondents without insomnia (all P<0.05) but no differences in ER visits and hospitalizations were observed (see Table 3). Respondents who reported only waking several times reported the greatest burden (number of ER visits =0.22; number of hospitalizations =0.17; and annual per-respondent direct costs =$6,363) followed by respondents who reported only MOTN awakenings (number of ER visits =0.21; number of hospitalizations =0.15; and annual per-respondent direct costs =$6,088; (see Table 3). The pattern of lost productivity and indirect costs was slightly different. Although no differences were observed with respect to absenteeism, several symptom groups reported significantly higher presenteeism, overall work impairment, activity-related impairment, and higher indirect costs than those without symptoms (see Table 4). As with the health status results, respondents with only poor quality of sleep reported the greatest burden (mean overall work impairment =18.57% and annual per-employee indirect costs =$6,685), followed by respondents with only difficulty falling asleep (mean overall work impairment =18.15% and annual per-employee indirect costs =$6,535).
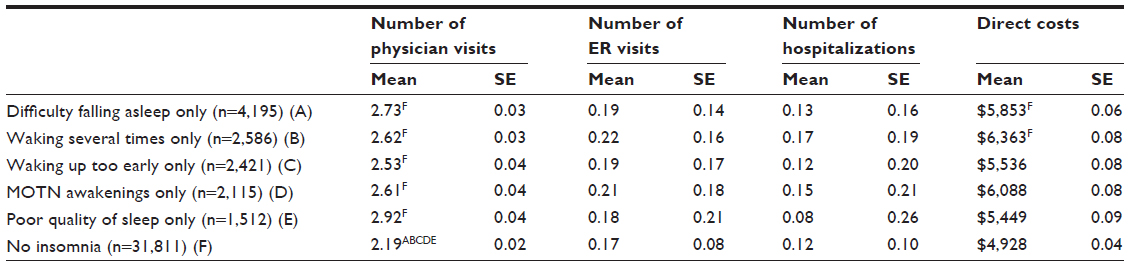 | Table 3 Adjusted levels of health care resource use and direct cost differences among those with only one insomnia symptom and those without insomnia |
 | Table 4 Adjusted levels of work impairment and indirect cost of those with various insomnia symptoms and those without insomnia |
Health outcome differences between those with MOTN awakenings and matched controls
More specific comparisons were then made between respondents who reported experiencing MOTN awakenings as their only insomnia symptom and those without insomnia. Postmatch, the difference between groups became negligible (from an effect size perspective) on all key demographic and health history variables (see Table 5). Respondents with only MOTN awakenings were older and more likely to be female, be non-Hispanic white, have annual household incomes $50K or more, be unemployed, and drink alcohol. They also had a greater comorbidity burden (see Table 5).
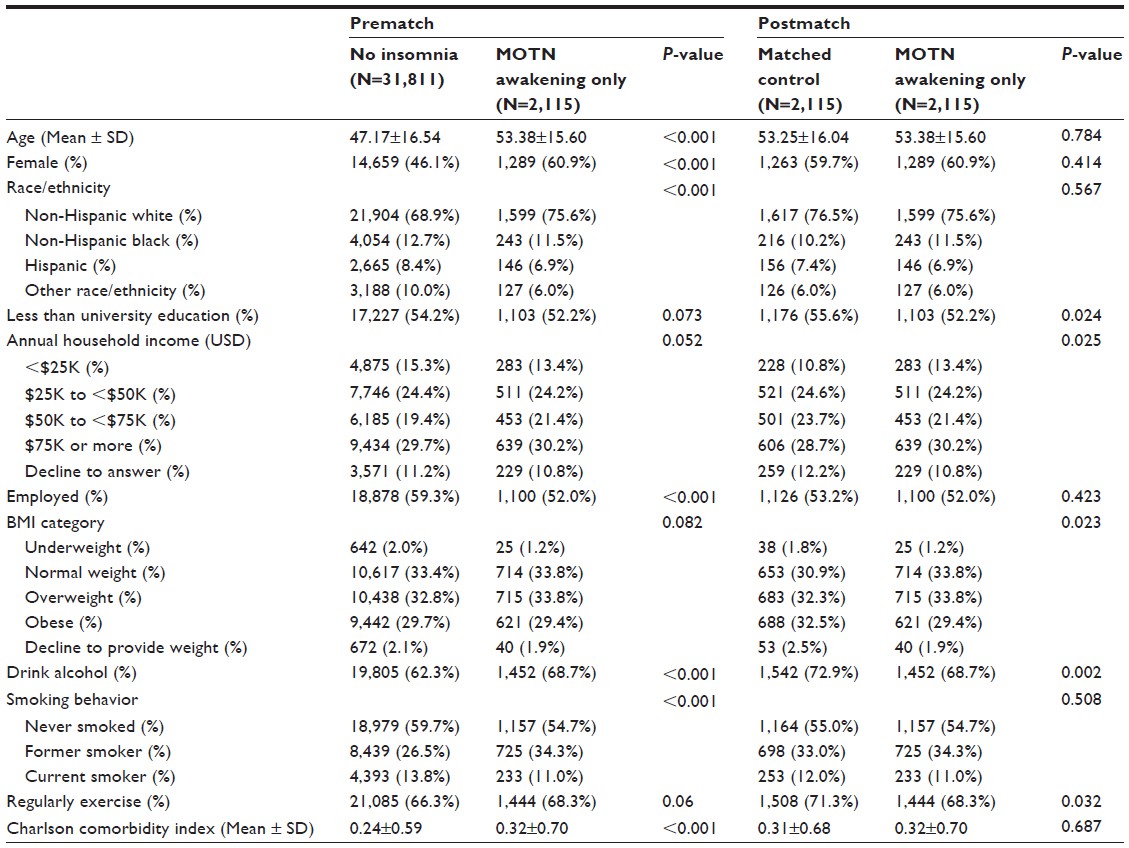 | Table 5 Demographic and health history variables pre- and postmatch between those without insomnia and those with only MOTN awakening |
Respondents with only MOTN awakenings reported worse health status across all summary and domain scores compared with matched controls (all P<0.05; see Figure 2). Differences in mental health (71.91 versus 77.36) and vitality (56.60 versus 61.97) both exceeded cutoffs for clinical relevance (ie, 5-point differences for domain scores). Health utility scores were also significantly worse, to a clinically relevant degree, for respondents with only MOTN awakening compared with matched controls (means =0.77 versus 0.81, respectively; P<0.05).
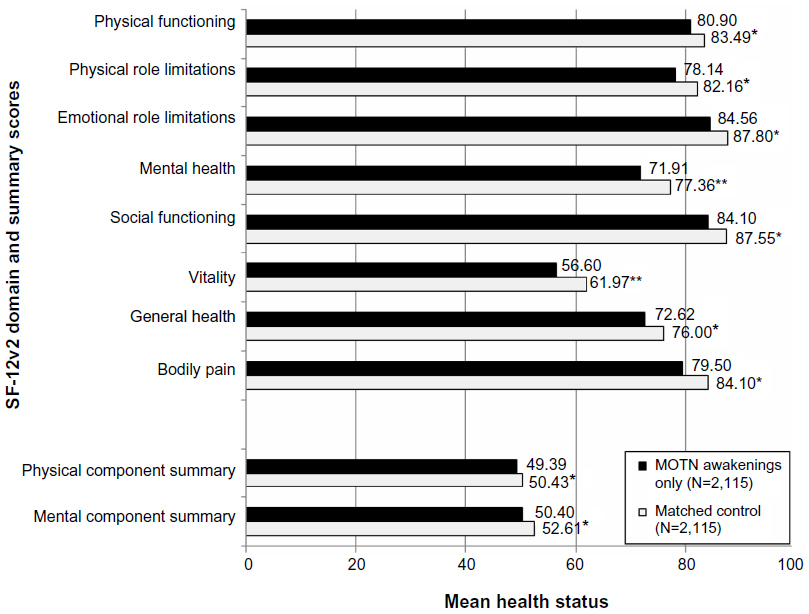 | Figure 2 Health status mean differences between those with MOTN awakening only (N=2,115) and matched controls (N=2,115). |
More health care provider visits in the past 6 months were reported by respondents with only MOTN awakenings compared with matched controls (3.40 versus 3.00; P<0.05); however, no significant differences were observed with respect to other health care resource use variables. A trend for higher direct costs among respondents with only MOTN awakenings relative to matched controls was observed ($6,373 versus $5,926), but this difference was not significant (P=0.37). Respondents with only MOTN awakenings also reported significantly greater activity impairment compared with matched controls and, among those employed, reported greater work impairment compared with matched controls (see Table 6). Indeed, annual per-employee indirect costs (ie, costs associated with lost wages) were estimated to be $4,328, compared with $3,000 for matched controls (P<0.05).
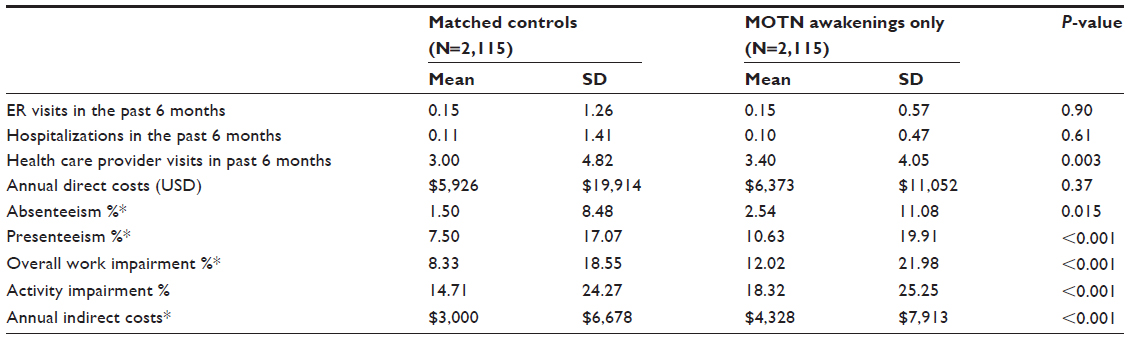 | Table 6 Economic outcome differences between those with MOTN awakening only (N=2,115) and matched controls (N=2,115) |
Symptoms versus diagnosis rates
It is notable that the presence of any insomnia symptoms did not necessarily correspond with respondents having been diagnosed with insomnia or even having reported that they had insomnia or difficulty sleeping (see Figure 3). Indeed, between 74.6% and 92.7% of respondents were considered only symptomatic, in that they reported experiencing their individual insomnia symptom but did not report having insomnia or having been diagnosed with insomnia. Respondents with only difficulty falling asleep were the most likely to be diagnosed with insomnia (13.9%), followed by respondents with only MOTN awakening (7.0%).
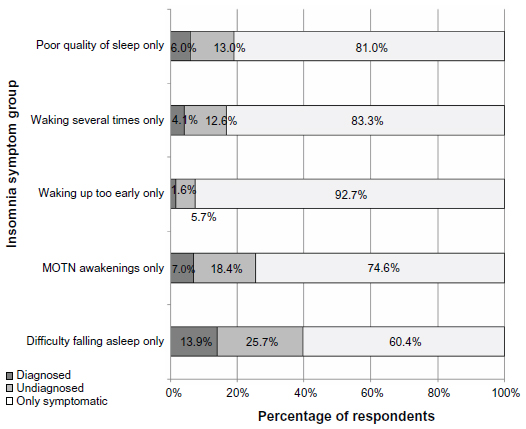 | Figure 3 Prevalence of diagnosed, undiagnosed, and only symptomatic respondents with each insomnia symptom. |
Discussion
Although over a quarter of respondents reported experiencing multiple insomnia symptoms, the current study focused on respondents with only a single insomnia symptom to best compare health outcomes among subpopulations. A particular focus of this paper was on respondents who experienced only MOTN awakenings, without other insomnia symptoms, which was reported by approximately 3.5% of all respondents. These respondents were more likely to be older, female, educated, out of the work force, and to have higher household incomes compared with respondents with other individual insomnia symptoms. Given the observed decrements in health status and greater societal costs (particularly, direct costs) of respondents with only MOTN awakenings compared with matched controls, these demographic characteristics can be helpful in understanding the subpopulations who may be at highest risk for developing this symptom.
Although Roth and colleagues found that sleep maintenance symptoms (analogous to MOTN awakenings) were significantly associated with role impairments,2 it was not presently known how different insomnia symptoms might have different consequences than others on a broad set of health outcomes. Indeed, several differences were observed. Among respondents with only one insomnia symptom, poor quality of sleep was associated with the strongest effects on health status compared with other insomnia symptoms, even after adjusting for demographic and health characteristics differences. These effects exceeded clinically relevant thresholds of 3 and 0.03 points for MCS scores and health state utilities, respectively. This is consistent with the literature which has found nonrestorative sleep (analogous to poor quality of sleep) to be the strongest of role impairments among all sleep symptoms.2 Naturally, the causality is unclear, as the presence of insomnia symptoms could result in poorer mental health.19 Also plausible, mental health comorbidities (eg, anxiety) can influence mental health and simultaneously result in insomnia symptoms.19 Differences across insomnia symptoms with respect to cost-related outcomes were generally modest, though all were higher (if not significantly so) than respondents without insomnia. Respondents who experienced only waking several times and only MOTN awakenings had the highest direct costs, while respondents who experienced only poor quality of sleep and only difficulty falling asleep had the highest indirect costs.
When compared with matched controls, respondents who reported only MOTN awakenings also reported significant decrements in health status across all summary and domain scores, in some cases to a clinically relevant degree. Although the difference between groups with respect to direct costs was small, respondents with only MOTN awakenings were estimated to have nearly 50% higher indirect costs due to missed work or reduced on-the-job performance compared with matched controls. These findings highlight the effect that a single symptom can have on both patient functioning and societal costs.
It is interesting to note that regardless of the symptom, over three-quarters of respondents who reported a single insomnia symptom did not identify themselves as having insomnia or sleep difficulties and had not been diagnosed with insomnia. This suggests that most respondents may consider their “symptom” a natural part of the sleep experience and not indicative of any underlying sleep condition. This may, in fact, be true for a subset of respondents (as our definition of MOTN awakenings did not include full Diagnostic and Statistical Manual of Mental Disorders, Fifth Edition criteria). However, based on the decrements observed in functioning and work-related impairment in particular, some of these patients may meet other diagnostic criteria and may benefit from discussing their sleep symptoms with their health care providers and for their health care providers to determine the impact of the insomnia and whether treatment is appropriate.
Limitations
All data from the NHWS were patient reported, and no verification of diagnoses (insomnia or otherwise) was possible. This could have introduced additional measurement error. Although a significant list of confounding variables were included in the analyses (eg, age, comorbidities, etc), it is possible other unmeasured variables may explain some of the associations between insomnia symptoms and health outcomes. Finally, the NHWS is broadly representative of the adult US population with respect to core demographic variables, but other variables (eg, health attitudes, health engagement) may differ. Further, the specific insomnia symptom subsamples may differ in meaningful ways from their corresponding populations.
Acknowledgment
The authors would like to thank Jill Bell, PhD for her comments on various drafts of this manuscript.
Disclosure
The data source for this study, the National Health and Wellness Survey (NHWS), was a survey conducted by Kantar Health. Purdue Pharma, LP purchased access to the NHWS data and funded the analysis and preparation for this manuscript. Dr DiBonaventura was employed by Kantar Health (the institution which received funding from Purdue Pharma, LP) at the time of the study. Dr Moline, Dr Ben-Joseph, and Ms Shah were employed by Purdue Pharma, LP at the time of the study. No off-label or investigational use is discussed in this paper. The authors have no other conflicts of interest to declare.
References
Ohayon MM. Epidemiology of insomnia: what we know and what we still need to learn. Sleep Med Rev. 2002;6(2):97–111. | |
Roth T, Jaeger S, Jin R, Kalsekar A, Stang PE, Kessler RC. Sleep problems, comorbid mental disorders, and role functioning in the national comorbidity survey replication. Biol Psychiatry. 2006;60(12):1364–1371. | |
Ohayon MM. Difficulty in resuming or inability to resume sleep and the links to daytime impairment: definition, prevalence and comorbidity. J Psychiatr Res. 2009;43(10):934–940. | |
Esposito M, Gallai B, Parisi L, et al. Primary nocturnal enuresis as a risk factor for sleep disorders: an observational questionnaire-based multicenter study. Neuropsychiatr Dis Treat. 2013;9:437–443. | |
Skaer TL, Sclar DA. Economic implications of sleep disorders. Pharmacoeconomics. 2010;28(11):1015–1023. | |
Léger D, Bayon V. Societal costs of insomnia. Sleep Med Rev. 2010;14(6):379–389. | |
Bolge SC, Doan JF, Kannan H, Baran RW. Association of insomnia with quality of life, work productivity, and activity impairment. Qual Life Res. 2009;18(4):415–422. | |
Ohayon MM. Nocturnal awakenings and comorbid disorders in the American general population. J Psychiatr Res. 2008;43(1):48–54. | |
DiBonaventura MD, Wagner JS, Yuan Y, L’Italien G, Langley P, Ray Kim W. Humanistic and economic impacts of hepatitis C infection in the United States. J Med Econ. 2010;13(4):709–718. | |
Finkelstein EA, Allaire BT, DiBonaventura MD, Burgess SM. Direct and indirect costs and potential cost savings of laparoscopic adjustable gastric banding among obese patients with diabetes. J Occup Environ Med. 2011;53(9):1025–1029. | |
Charlson ME, Pompei P, Ales KL, MacKenzie CR. A new method of classifying prognostic comorbidity in longitudinal studies: development and validation. J Chronic Dis. 1987;40(5):373–383. | |
Ware JE, Kosinski M, Turner-Bowker DM, Gandek B. How to score version 2 of the SF-12 health survey (with supplement documenting version 1). Lincoln: QualityMetric Incorporated; 2002. | |
Hays RD, Morales LS. The RAND-36 measure of health-related quality of life. Ann Med. 2001;33(5):350–357. | |
Walters SJ, Brazier JE. What is the relationship between the minimally important difference and health state utility values? The case of the SF-6D. Health Qual Life Outcomes. 2003;1:4. | |
Reilly MC, Zbrozek AS, Dukes EM. The validity and reproducibility of a work productivity and activity impairment instrument. Pharmacoeconomics. 1993;4(5):353–365. | |
Lofland JH, Pizzi L, Frick KD. A review of health-related workplace productivity loss instruments. Pharmacoeconomics. 2004;22(3):165–184. | |
Dibonaventura MD, Gupta S, McDonald M, Sadosky A, Pettitt D, Silverman S. Impact of self-rated osteoarthritis severity in an employed population: cross-sectional analysis of data from the national health and wellness survey. Health Qual Life Outcomes. 2012;10:30. | |
Agency for Healthcare Research and Quality. Emergency Room Services-Mean and Median Expenses per Person With Expense and Distribution of Expenses by Source of Payment: United States, 2009 [webpage on the Internet]. Medical Expenditure Panel Survey Household Component Data. Generated interactively. Available from: http://meps.ahrq.gov/data_stats/tables_compendia_hh_interactive.jsp?_SERVICE=MEPSSocket0&_PROGRAM=MEPSPGM.TC.SAS&File=HCFY2009&Table=HCFY2009_PLEXP_E&VAR1=AGE&VAR2=SEX&VAR3=RACETH5C&VAR4=INSURCOV&VAR5=POVCAT09&VAR6=MSA&VAR7=REGION&VAR8=HEALTH&VARO1=4+17+44+64&VARO2=1&VARO3=1&VARO4=1&VARO5=1&VARO6=1&VARO7=1&VARO8=1&_Debug=. Accessed May 30, 2014. | |
Buysse DJ, Angst J, Gamma A, Ajdacic V, Eich D, Rössler W. Prevalence, course, and comorbidity of insomnia and depression in young adults. Sleep. 2008;31(4):473–480. |
 © 2014 The Author(s). This work is published and licensed by Dove Medical Press Limited. The full terms of this license are available at https://www.dovepress.com/terms.php and incorporate the Creative Commons Attribution - Non Commercial (unported, v3.0) License.
By accessing the work you hereby accept the Terms. Non-commercial uses of the work are permitted without any further permission from Dove Medical Press Limited, provided the work is properly attributed. For permission for commercial use of this work, please see paragraphs 4.2 and 5 of our Terms.
© 2014 The Author(s). This work is published and licensed by Dove Medical Press Limited. The full terms of this license are available at https://www.dovepress.com/terms.php and incorporate the Creative Commons Attribution - Non Commercial (unported, v3.0) License.
By accessing the work you hereby accept the Terms. Non-commercial uses of the work are permitted without any further permission from Dove Medical Press Limited, provided the work is properly attributed. For permission for commercial use of this work, please see paragraphs 4.2 and 5 of our Terms.