")
Back to Journals » International Journal of Nanomedicine » Volume 9 » Issue 1
Heat-transfer-based detection of SNPs in the PAH gene of PKU patients
Authors Vanden Bon N, van Grinsven B, Murib M, Yeap WS, Haenen K, De Ceuninck W, Wagner P, Ameloot M , Vermeeren V, Michiels L
Received 4 December 2013
Accepted for publication 10 January 2014
Published 27 March 2014 Volume 2014:9(1) Pages 1629—1640
DOI https://doi.org/10.2147/IJN.S58692
Checked for plagiarism Yes
Review by Single anonymous peer review
Peer reviewer comments 4
Natalie Vanden Bon,1 Bart van Grinsven,2 Mohammed Sharif Murib,2 Weng Siang Yeap,2 Ken Haenen,2,3 Ward De Ceuninck,2,3 Patrick Wagner,2,3 Marcel Ameloot,1 Veronique Vermeeren,1 Luc Michiels1
1Biomedical Research Institute, Hasselt University, Diepenbeek, Belgium; 2Institute for Materials Research, Hasselt University, Diepenbeek, Belgium; 3IMOMEC, Diepenbeek, Belgium
Abstract: Conventional neonatal diagnosis of phenylketonuria is based on the presence of abnormal levels of phenylalanine in the blood. However, for carrier detection and prenatal diagnosis, direct detection of disease-correlated mutations is needed. To speed up and simplify mutation screening in genes, new technologies are developed. In this study, a heat-transfer method is evaluated as a mutation-detection technology in entire exons of the phenylalanine hydroxylase (PAH) gene. This method is based on the change in heat-transfer resistance (Rth) upon thermal denaturation of dsDNA (double-stranded DNA) on nanocrystalline diamond. First, ssDNA (single-stranded DNA) fragments that span the size range of the PAH exons were successfully immobilized on nanocrystalline diamond. Next, it was studied whether an Rth change could be observed during the thermal denaturation of these DNA fragments after hybridization to their complementary counterpart. A clear Rth shift during the denaturation of exon 5, exon 9, and exon 12 dsDNA was observed, corresponding to lengths of up to 123 bp. Finally, Rth was shown to detect prevalent single-nucleotide polymorphisms, c.473G>A (R158Q), c.932T>C (p.L311P), and c.1222C>T (R408W), correlated with phenylketonuria, displaying an effect related to the different melting temperatures of homoduplexes and heteroduplexes.
Keywords: mutation detection, heat-transfer resistance, melting temperature, nanocrystalline diamond, persistence length
Introduction
Phenylketonuria (PKU; MIM# 261600) is a metabolic genetic disorder characterized by mutations in the phenylalanine hydroxylase (PAH) gene. The PAH enzyme (EC 1.14.16.1) converts phenylalanine into tyrosine in the presence of the cofactor tetrahydrobiopterin (BH4). A deficiency of this enzyme results in accumulation of phenylalanine in the blood and the brain.1 The neurotoxic effect of hyperphenylalaninemia causes severe mental defects, agitated behavior, eczema, seizures, epilepsy, and some additional symptoms.2 Early diagnosis of PKU is important because it is easily treatable with a low phenylalanine diet and/or with supplements of BH4.3,4 Therefore, in most countries, all newborns are screened for PKU by measuring the amount of phenylalanine in the blood drawn from the heel of the baby and dried onto collection cards, known as the Guthrie test.5
Although conventional PKU diagnosis through this Guthrie test is based on the abnormal metabolic phenotype, this technique is not applicable for the detection of carriers of the disease, or for prenatal diagnosis. Hence, it is useful to directly detect the disease-causing mutations in the PAH gene, because the severity of the disease is mutation dependent.1 To date, more than 500 different mutations in the PAH gene have been identified and reported to the PAH Mutation Analysis Consortium Database.6 Available methods to detect known PAH mutations include Southern blotting, restriction enzyme digestion, gene sequencing, and denaturing gradient gel electrophoresis.7–12 However, these methods are expensive and require a long analysis time, trained personnel, and specialized equipment.
To overcome the limitations of the traditional mutation analysis techniques, various large-scale technologies are being developed. First, the development of next-generation sequencing reduces the analysis time, increases the throughput, and lowers the cost. But, in order to be widely and routinely used as a diagnostic tool, the purchase price of the system needs to be reduced and data analysis needs to be manageable.13 Next, DNA microarrays have become one of the most popular analytical techniques for detection of genetic mutations. The advantages of microarrays are the high throughput and robust nature of the technique, but the workflow of microarray-based assays are rather labor- and time-intensive. However, recently developed centrifugal microfluidics might become an elegant solution to automate and speed up microarray hybridization.14 Nevertheless, microarray assays are very expensive due to the required fluorescent labeling and the read-out infrastructure.
Over the last few decades, several electrochemical DNA biosensors have been designed. These biosensors have two major advantages: they are label-free, and the biochemical process is directly translated into an electrical response. All electrochemical DNA biosensors consist of single-stranded DNA (ssDNA) probes that are attached to a solid surface, hybridize directly with ssDNA target strands, and use an electrochemical transduction during either the hybridization or the denaturation process. These biosensors are classified based on the nature of the bio-electrochemical transduction. Typical examples of recently developed opto-electronic and electrochemical biosensors include biosensors employing voltammetric read-out. This type of biosensor is often based on the direct oxidation or redox labeling of DNA, or uses intercalating or soluble redox indicators.15–18 Single-nucleotide polymorphism (SNP) discrimination with oxidation-based biosensors is based on the difference in faradic charge or electron transfer through the π-stacking of double-stranded DNA (dsDNA) upon hybridization. The reason for this change is that π-stacking of DNA bases along the helix is interrupted in a mismatch, or heteroduplex, resulting in a decrease of electron-transfer efficiency. A low detection limit is achieved when using voltammetry, but mismatch discrimination is limited to short sequences. For the last two decades, biosensors based on surface plasmon resonance have been reported to detect DNA mutations.19 This optical technique can detect mutations based on the difference in refractive index on the sensor chip surface upon hybridization or denaturation of DNA.20,21 Despite the high sensitivity of surface plasmon resonance-based SNP detection, this technique requires sophisticated read-out instrumentation. Finally, impedance spectroscopy is a popular read-out technique to measure the change in interface charge density on semiconductor surfaces during hybridization with, or denaturation of, negatively charged DNA. The change in interface charge density is different for heteroduplex dsDNA, containing an SNP, as compared with homoduplex dsDNA.22,23 Although impedance spectroscopy has various advantages, it requires complex data analysis.
Recently, an alternative technique for mutation detection was published.24 This technology is based on the change in heat-transfer resistance (Rth) of diamond sensor surfaces upon the thermal denaturation of immobilized dsDNA. The increase of Rth is explained by the morphological changes of dsDNA during denaturation. Immobilized dsDNA molecules up to 50 nm, corresponding with 150 bp (basepairs), are upright, rigid structures, allowing heat to be transferred efficiently in between the stiff dsDNA helices. After denaturation, the resulting ssDNA coils up, covering and insulating the sensor surface. The transition from dsDNA to ssDNA is clearly visible by an increase in Rth. The temperature associated with this transition can be used to determine the melting temperature (Tm) of the dsDNA fragments. Based on the difference in Tm, the Rth-based sensor was able to detect SNPs during thermal denaturation of short (~10 nm or 30 bp) fragments of the PAH gene. The label-free Rth-based technique is a promising, inexpensive, fast, and real-time alternative to the currently used denaturation-based techniques for DNA characterization and the detection of point mutations.
However, in order to translate this technique into a simplified multiplexed assay for routine genetic analysis, the Rth method must be applicable to longer, optimally exon-size DNA fragments. When longer fragments, or even entire exons, are present as probes on the sensor surface, an entire gene could be screened in only a limited number of assays. In the current study, the maximum DNA length was determined where the Rth-based technique was still sensitive to SNPs. Furthermore, we demonstrate the application of this technique by detecting some of the most common SNPs in the PAH gene associated with PKU. These single base mutations are c.473G>A (R158Q), c.932T>C (p.L311P) and c.1222C>T (R408W) and are respectively located in exon 5, exon 9, and exon 12 of the PAH gene.
Material and methods
Reagents and solutions
Na2HPO4, NaCl, and ethylenediaminetetraacetic acid (EDTA) were obtained from VWR International (Vilvoorde, Belgium). KH2PO4 was bought from Sigma-Aldrich (St Louis, MO, USA). Proteinase K from Invitrogen was purchased from Life Technologies (Carlsbad, CA, USA). TRIS (tris(hydroxymethyl)aminomethane), sodium dodecyl sulfate (SDS), and Sephadex G-50 medium were bought from GE Healthcare Europe GmbH (Freiburg, Germany). Lambda exonuclease from Epicentre was acquired from Westburg (Leusden, the Netherlands). Deoxyribonucleotide triphosphate (dNTP), polymerase chain reaction (PCR) buffer, and Taq polymerase were obtained from Roche Diagnostics (Basel, Switzerland). All primers and synthetic DNA sequences were purchased from Integrated DNA Technology (Leuven, Belgium). Lysis buffer (1.2 g/L TRIS, 23.3 g/L NaCl, 0.7 g/L EDTA) and phosphate-buffered saline, 10 times concentrated (10× PBS) (1.29 M NaCl, 0.05 M Na2HPO4 · 2H2O, 0.015 M KH2PO4, pH 7.2) were made in our laboratory.
DNA extraction and PCR amplification
Human genomic DNA (gDNA) was isolated from white blood cells that were extracted from peripheral blood from healthy controls or anonymous homozygous PKU patients, by incubating the cells overnight at 37°C in lysis buffer, 20% SDS, and proteinase K. gDNA was then purified using a chloroform-based extraction and ethanol-based precipitation method. Finally, gDNA was resuspended in sterilized Milli-Q water (Merck Millipore, Billerica, MA, USA).
Exon 12 of the PAH gene was amplified in a 20 μL reaction mixture containing 200 ng of gDNA, 1× PCR buffer with 1.5 mM MgCl2, 0.2 mM of each dNTP, 1 U Taq polymerase, 0.5 μM F primer (5′-GCCTGTGGTTTTGGTCTTAGG-3′), and 0.5 μM R primer (5′-ATCTTAAGCTGCTGGGTATTGTC-3′, 5′-end modified with a PO4-label). The iCycler™ thermal cycler (Bio-Rad Laboratories, Hercules, CA, USA) was set at 5 minutes denaturation at 95°C followed by 40 cycles of 2 seconds denaturation at 95°C, 10 seconds annealing at 53°C, and 30 seconds elongation at 72°C. After cycling, an extra elongation at 72°C was carried out for 5 minutes. The phosphorylated PCR products were purified using Sephadex G-50 medium columns. To generate single-stranded target DNA, the purified PCR products were treated with lambda exonuclease. The single stranded PCR products were purified using Sephadex G-50 medium columns. The concentration of the purified ssPCR product was determined using a NanoDrop 2000 (Thermo Fisher Scientific, Waltham, MA, USA).
Functionalization of sensor electrodes with exon-size DNA fragments
For the experiments described in this study, 3 or 300 pmol of exon-size, amino (NH2)-modified probe ssDNA was covalently immobilized onto carboxyl (COOH)-terminated nanocrystalline diamond (NCD) sensor electrodes, hereafter referred to as NCD:COOH, using carbodiimide coupling. Details of the synthesis, hydrogenation, and carboxylation of the NCD electrodes, and the coupling procedure for short ssDNA onto NCD are described elsewhere.22 In brief, 10-undecenoic fatty acid was first photochemically attached to hydrogen (H)-terminated NCD to produce NCD:COOH. In a second step, NH2-modified ssDNA was covalently linked to the COOH-group using an EDC (1-ethyl-3-(3-dimethylaminopropyl)carbodiimide)-mediated coupling.
To evaluate the success of attachment, the immobilized probe DNA sequences were hybridized with 600 pmol of an Alexa Fluor® 488-modified detection probe (Integrated DNA Technology; Leuven, Belgium) (Table 1). The fluorescence of each NCD sample was evaluated using confocal fluorescence microscopy. For the heat-transfer-based experiments, the immobilized probe DNA sequences were hybridized with 600 pmol of synthetic target DNA (Table 1) or with 9 pmol of purified ssPCR product.
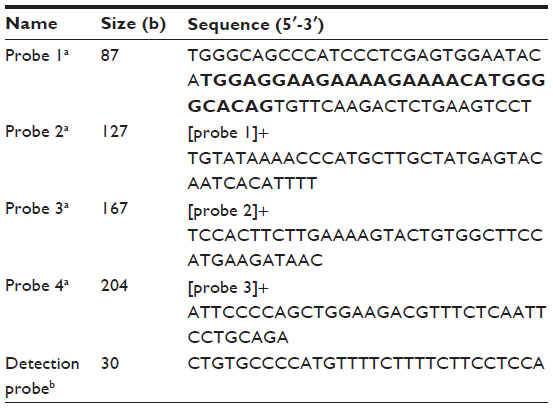 | Table 1 Summary of the probe ssDNA sequences used to verify the attachment of exon-size ssDNA fragments to nanocrystalline diamond |
Confocal fluorescence microscopy
The EDC-mediated covalent attachment of longer ssDNA sequences was evaluated by measuring the fluorescence of the NCD sample surfaces in 1× PBS buffer solution with a Zeiss LSM 510 META Axiovert 200 M laser scanning confocal fluorescence microscope (Carl Zeiss AG, Jena, Germany). To excite the Alexa Fluor 488 dyes, a 488 nm argon-ion laser was used, with a maximum intensity at the sample surface of 1.00±0.05 mW. The settings of the filters and the confocal optics are previously documented.23 All images were collected with a 10×/0.3 Plan-Neofluar (Carl Zeiss AG) air objective with a working distance of 5.6 mm. The image size was 128×128 pixels, corresponding with a total scanned area of 225×225 μm. The pinhole size was 150 μm, and the laser intensity was set at 10%. The detector gain, being a measure for the multiplier voltage in arbitrary units, was set to 1,200. To demonstrate that the fluorescence intensity originates from the Alexa Fluor 488 dyes and not from the underlying diamond layer, bleaching experiments were performed. During photobleaching, the laser intensity was set to 100% for 3 minutes. Images were collected using AIM (Carl Zeiss AG) software and were processed using ImageJ (National Institute of Health, Bethesda, MD, USA) software.
Sensor setup
The thermal denaturation of longer dsDNA fragments on NCD samples was evaluated by monitoring the change in Rth due to the transition from dsDNA to ssDNA. The sensor setup was previously described.24 Briefly, when performing a denaturation experiment, a dsDNA-functionalized NCD sample is attached with its backside to a copper (Cu) lid of the setup and connected with its functionalized front end to a flow cell, filled with 1× PBS buffer. The thermal readout of the setup consists of two thermocouples monitoring the temperature of both the Cu backside contact (T1) and the liquid compartment of the flow cell (T2). The precision of the thermocouples is experimentally determined as 0.01°C. Moreover, T1 can be actively steered by adjusting the power (P) of the heating element, connected with the Cu lid of the sensor setup. Rth (°C/W) is derived from the ratio of the temperature difference ΔT=T1–T2 (°C) and the required heating P (W), as mathematically described in Equation 1.

Rth-based, thermal denaturation monitoring
The thermal denaturation of dsDNA fragments on NCD samples was evaluated by monitoring the change in Rth derived from the transition from dsDNA to ssDNA. During these measurements, the dsDNA fragments on the NCD were denatured by increasing T1 from 35°C to 85°C, with a heating rate of 1°C/min. After cooling back down to 35°C, a second heating run was performed to check whether the dsDNA fragments were completely denatured during the first heating run. During these heating runs, T1, T2, and P were recorded every second.
Thermal data analysis
For all measured temperatures, the corresponding Rth values during the first and second heating run are calculated. The Rth change during the first heating run is normalized with the temperature-dependent linear decrease of Rth during the second heating run, to eliminate the temperature-dependent effects on Rth during the first run and only highlight the changes in Rth due to biological events. The normalized curves were fitted in Origin 7 (OriginLab, Northampton, MA, USA) with the sigmoidal Boltzmann function as described in Equation 2:

The parameters A1 (°C/W) and A2 (°C/W) describe the initial and final Rth value, corresponding with the Rth value before and after denaturation of dsDNA, respectively. The parameter x0 (°C) describes the temperature at which the Rth value has reached the center of the transition, thus representing Tm. The parameter dx describes the steepness of the curve. The absolute Rth change upon denaturation is described by subtracting A1 from A2.
Results
Optical confirmation of the functional immobilization of long, exon-size ssDNA fragments onto NCD samples
To investigate the sensitivity of Rth-based mutation detection in exon-size DNA fragments, the maximum length of ssDNA fragments that can be immobilized on NCD surfaces was optically determined. Four different lengths of probe ssDNA, derived from PAH exon 6, were used. All probe DNA sequences are summarized in Table 1. The four probes, 1, 2, 3, and 4, were 87, 127, 167, and 204 bases (b) in length, respectively. Probe 2 represents the average size of a PAH exon. The size of probe 3 is comparable with the persistence length of dsDNA (~150 bp), predicted to be the limiting factor for Rth measurements.24,25 The probe DNA sequences were all modified at the 5′-end with an NH2-label and a spacer of seven adenosine (A) bases. To ensure that the NH2-label was free for immobilization, the probe DNA sequences were denatured for 5 minutes at 95°C before immobilization.
To evaluate the immobilization of the different probes, the immobilized probe DNA sequences were hybridized with 600 pmol of an Alexa Fluor 488-modified detection probe (Table 1), which is completely complementary to all four probe DNA sequences used, for 2 hours at 49°C in 10× PCR buffer. Unbound DNA was removed by rinsing the samples for 30 minutes with sodium chloride/sodium acetate buffer, two-times concentrated (2× SSC), containing 0.5% SDS at room temperature. To remove incompletely hybridized DNA, the samples were subsequently rinsed with 0.2× SSC buffer, first at 44°C for 5 minutes, then at room temperature for 5 minutes.22 The fluorescence of each NCD sample was measured by confocal fluorescent microscopy. Figure 1 illustrates the successful immobilization of all the probe sizes tested. Bleaching experiments confirmed that the fluorescence intensity originates only from the Alexa Fluor 488 dye and not from the underlying diamond layer. Furthermore, no aspecific binding of the detection probe to the diamond surface was detected, as shown in Figure 1E.
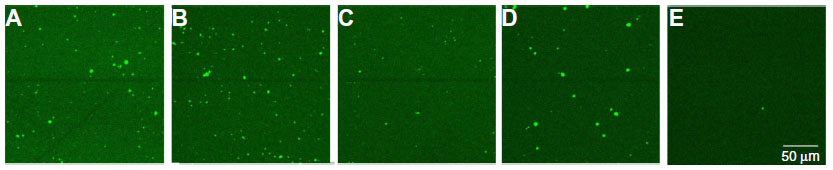 | Figure 1 Fluorescence images of nanocrystalline diamond samples functionalized with ssDNA fragments of 87 b (A), 127 b (B), 167 b (C), 204 b (D), and no ssDNA fragment (E), hybridized to an Alexa Fluor® 488-labeled detection probe. |
Rth-based denaturation monitoring of synthetic PAH exons
After the successful immobilization, the maximum size of DNA fragments that can be used in Rth measurements was determined. Four different probe ssDNA sequences (Table 2), containing the wild-type sequences of PAH exon 9, 5, 12, and 7, with different sizes (73, 105, 130, and 157 b, respectively), were immobilized on NCD sensor electrodes as described previously. The DNA selected covered the range of PAH exon sizes from the shortest length (57 bp) to the predicted persistence length of dsDNA (~150 bp), which could be the limiting factor in Rth measurements. The immobilized probe DNA sequences were hybridized with 600 pmol of fully complementary, wild-type target ssDNA for 2 hours at 55°C in 10× PCR buffer, forming homoduplex dsDNA fragments attached to the NCD samples. Incompletely hybridized DNA was removed during stringency washing with 0.2× SSC buffer at a temperature of 50°C. The thermal denaturation of each NCD sample was evaluated by monitoring the change in Rth.
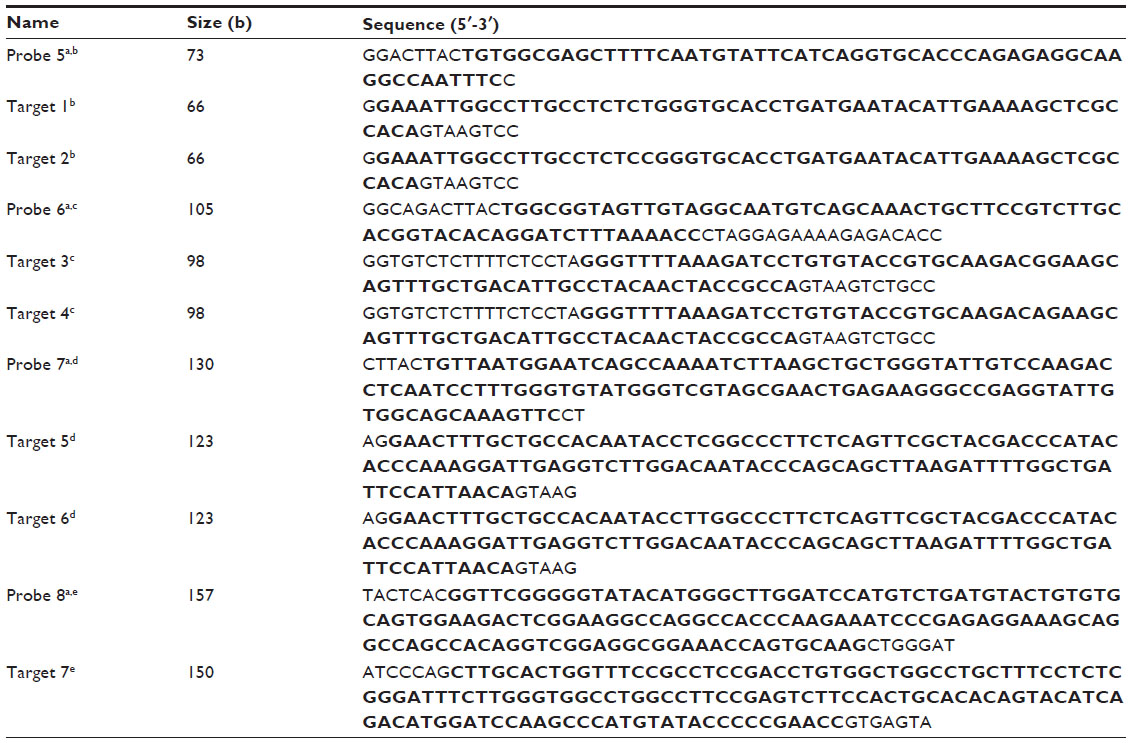 | Table 2 Summary of the probe and target ssDNA sequences used in the Rth measurements |
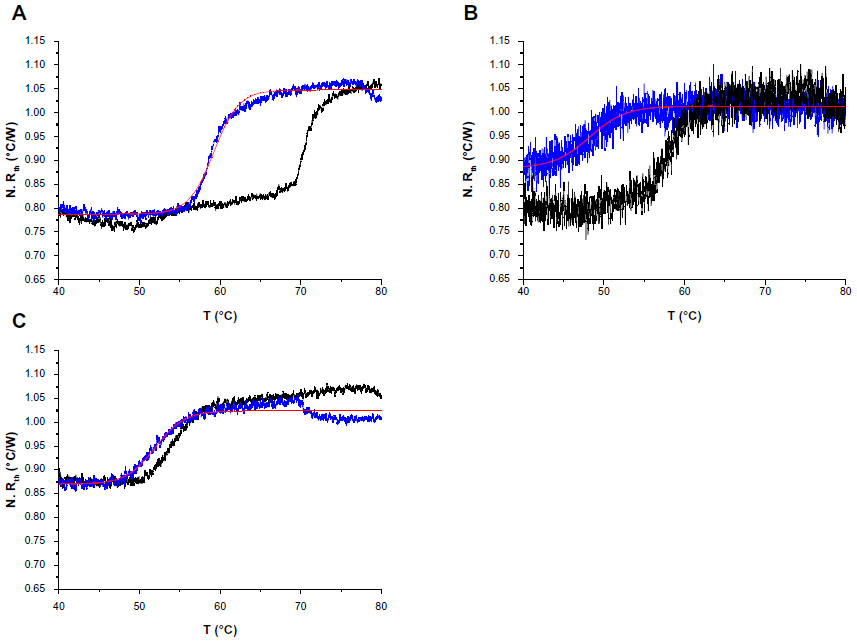
The normalized Rth of the selected DNA fragments used in this study, as a function of increasing T1, is shown in Figure 2. An increase in Rth can be observed upon denaturation of dsDNA fragments representing PAH exon 9, exon 5, and exon 12, with corresponding sizes of 66 bp (Figure 2A), 98 bp (Figure 2B), and 123 bp (Figure 2C). No Rth change was observed when using dsDNA fragments of 150 bp, representing exon 7 (Figure 2D).
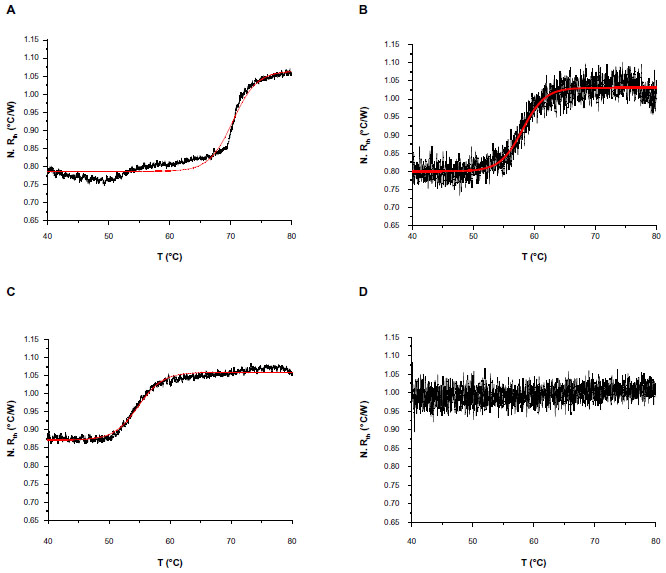 | Figure 2 N. Rth as a function of temperature T1 (black lines) during the thermal denaturation of fully complementary dsDNA sequences with fragment sizes of: 66 bp, enclosing exon 9 (A); 98 bp, enclosing exon 5 (B); 123 bp, enclosing exon 12 (C); and 150 bp, enclosing exon 7 (D). |
The fit of the normalized curves with the sigmoidal Boltzmann function is represented by a red line in Figure 2A–C. The values of the corresponding parameters representing Tm (x0), the relative Rth value of dsDNA (A1), the Rth value of ssDNA (A2), and the relative Rth change upon denaturation (A2–A1)×100% are summarized in Table 3. Exon 9 had the highest Tm of 70.37°C±0.04°C, exon 5 had an intermediate Tm of 58.08°C±0.05°C, and exon 12 had the lowest Tm of 54.81°C±0.03°C. The average, relative increase in Rth upon denaturation is 23%, as calculated from the fitted values A1 and A2. However, A2 is an overestimation of the Rth value of ssDNA fragments, as measured in the second heating run. Therefore an average increase in Rth of 18% is more correct. This value is obtained by subtracting the average value of A1 (0.81943°C/W) from the theoretical A2 value of the second heating run (1.00000°C/W).
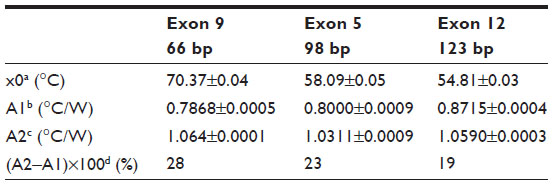 | Table 3 Summary of the parameters defined by the sigmoidal Boltzmann function (Equation 2) used to fit the Rth data during thermal denaturation of fully complementary homoduplex dsDNA fragments of three different sizes |
Rth-based detection of SNPs in synthetic PAH exons
After demonstrating that Rth can be used to monitor DNA denaturation in exon-size DNA fragments, the Rth-based detection of SNPs in these DNA fragments was evaluated as a proof of principle. The previous wild-type probe DNA sequences (Table 2) were immobilized on NCD samples as described above. The immobilized probe DNA sequences were hybridized with either 600 pmol target DNA containing a PAH mutation, forming a heteroduplex on the NCD, or with 600 pmol target DNA that was fully complementary, forming a homoduplex on the NCD. PAH mutations tested were c.473G>A (R158Q), c.932T>C (p.L311P), and c.1222C>T (R408W). The hybridization and stringency washing temperatures for both types of target DNA used were 55°C and 50°C, respectively. The Rth change during denaturation of the dsDNA fragments containing an SNP on one NCD sample was compared with the change obtained during denaturation of fully complementary dsDNA sequences on another NCD sample.
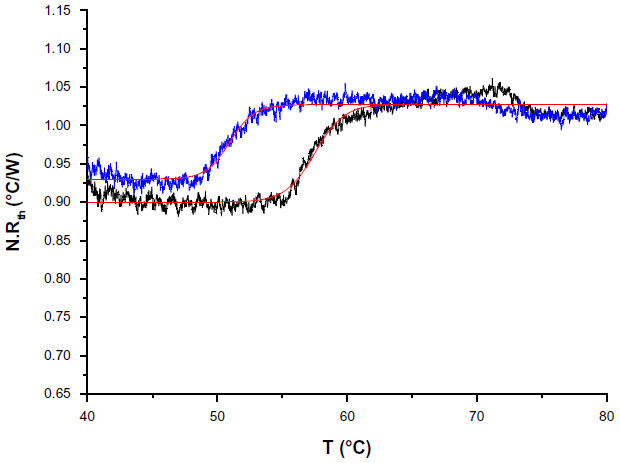
The normalized Rth as a function of T1 is shown in Figure 3. The fit of the normalized curve with the sigmoidal Boltzmann function is represented by a red line. The values of the corresponding parameters representing Tm (x0), the Rth value of dsDNA (A1), the Rth value of ssDNA (A2), and the relative Rth change upon denaturation (A2–A1)×100% are summarized in Table 4. The Tm for heteroduplex dsDNA of exon 9 was 59.23°C±0.02°C, for exon 5 was 48.24°C±0.14°C, and for exon 12 was 51.97°C±0.04°C. When comparing these values of heteroduplexes containing an SNP (Table 4) with the fully complementary homoduplexes (Table 3), a decrease of Tm can be observed for the heteroduplex denaturations. Furthermore, the increase in Rth upon denaturation of heteroduplex dsDNA fragments containing an SNP (Table 4) is 18%, as calculated from the fitted values A1 and A2. As A2 is an overestimation of the Rth value of ssDNA fragments, as measured in the second heating run, an average, relative increase in Rth of 15% is more correct. This value is obtained by subtracting the average value of A1 (0.84701°C/W) from the theoretical A2 value of the second heating run (1.00000°C/W).
 | Figure 3 N. Rth as a function of temperature T1 during the thermal denaturation of heteroduplex dsDNA fragments (blue lines) containing one of the following single-nucleotide polymorphisms: c.932T>C (p.L311P) (A), c.473G>A (R158Q) (B), or c.1222C>T (R408W) (C) compared with the thermal denaturation of fully complementary dsDNA sequences (black lines). |
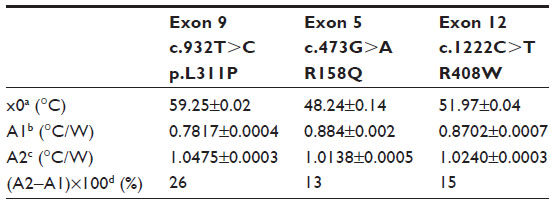 | Table 4 Summary of the parameters defined by the sigmoidal Boltzmann function (Equation 2) used to fit the Rth data during thermal denaturation of heteroduplex dsDNA fragments containing one of the following single-nucleotide polymorphisms: c.932T>C (p.L311P), c.473G>A (R158Q), or c.1222C>T (R408W) |
In case of exon 12, Rth-measurements were performed in triplicate. A significant difference (P<0.05) was obtained between the Tm of fully complementary dsDNA fragments (58.68°C±4.56°C) and dsDNA fragments containing the c.1222C>T point mutation (50.84°C±1.19°C) according to the Student’s t-test.
Rth-based detection of SNPs in patient-derived and healthy control PAH exons
As a proof-of-concept, NCD samples functionalized with 3 pmol of synthetic probe 7 were hybridized with 9 pmol of ssPCR product from a healthy control or from a homozygous PKU patient containing the c.1222C>T (R408W) SNP. Normalized Rth as a function of increasing T1 is shown in Figure 4. The fit of the normalized curve with the sigmoidal Boltzmann function is represented by a red line. The values of the corresponding parameters representing Tm (x0), the Rth value of dsDNA (A1), the Rth value of ssDNA (A2), and the relative Rth change upon denaturation (A2–A1)×100% are summarized in Table 5. The Tm of exon 12 from the healthy control is 57.52°C±0.03°C and from the homozygous patient is 50.96°C±0.03°C. When comparing these values with the values of synthetic target DNA fragments (Tables 3 and 4), a similar decrease in Tm can be observed.
 | Figure 4 N. Rth as a function of temperature T1 during the thermal denaturation of polymerase chain reaction products containing exon 12 of a healthy control (black line) compared with exon 12 of a homozygous phenylketonuria patient having the c.1222C>T (R408W) single-nucleotide polymorphism (blue line). |
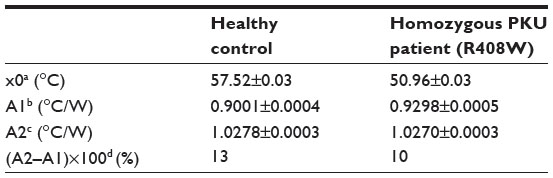 | Table 5 Summary of the parameters defined by the sigmoidal Boltzmann function (Equation 2) used to fit the Rth data during thermal denaturation of polymerase chain reaction products containing exon 12 |
Discussion
In a previous study, it was demonstrated that the transition from dsDNA to ssDNA during thermal denaturation results in an increase in Rth. The temperature associated with the Rth change can be used to determine the Tm of dsDNA fragments. Based on the difference in Tm, this Rth-based sensor was able to detect SNPs during thermal denaturation of short dsDNA fragments of the PAH gene.24
In the current study, the Rth-based sensor was evaluated for possible use in routine genetic analysis. Therefore, it would be advantageous if the Rth method was applicable to longer, ideally exon-size, DNA fragments to simplify the development of a multiplex assay for screening an entire gene. First, the maximum length of ssDNA fragments that can be immobilized on NCD surfaces was optically determined. Next, the occurrence of an Rth change upon denaturation of such longer dsDNA fragments was evaluated. And finally, the sensitivity of the Rth-based technique to SNPs in these longer dsDNA fragments was studied. As a proof-of-concept, the detection of some of the most common SNPs in the PAH gene associated with PKU were analyzed. These single-base mutations are c.473G>A (R158Q), c.932T>C (p.L311P), and c.1222C>T (R408W) and are respectively located in PAH exon 5, exon 9, and exon 12.
It was demonstrated, by the use of confocal fluorescence microscopy, that it was possible to immobilize ssDNA fragments up to 200 b in length onto NCD samples. This length is similar to the length of the longest exon in the PAH gene: exon 6. Therefore, it is possible to immobilize all exons of the PAH gene onto COOH:NCD samples using an optimized version of the EDC-mediated coupling procedure.22 This optimization entailed the denaturation of the probe ssDNA prior to immobilization, to ensure that the NH2-label is free for immobilization and is not encapsulated by hairpins or other secondary structures of the longer probe ssDNA. This immobilization strategy is not limited to the exons of the PAH gene, but can be extended to other genes as well, since this procedure is sequence-independent. However, the fluorescence intensities shown in Figure 2 are lower in comparison with the fluorescence resulting from the immobilization of short (8 and 36 b) DNA fragments.22 Furthermore, the intensity decreases with increasing length. A possible explanation is a lower surface coverage with longer ssDNA fragments. This decrease in coverage is presumed to be associated with a less ordered arrangement of longer ssDNA fragments on a surface, reflecting a more flexible ssDNA configuration.26 The persistence length of ssDNA fragments is experimentally found to be ~2 nm.25 Therefore, longer ssDNA fragments might cover up the NCD surface, thereby blocking larger regions of adjacent surface space for additional functionalization.22 Another explanation is that bending of the longer ssDNA fragments towards the NCD surface causes fluorescence quenching.27 The brighter fluorescence spots are possibly due to an accumulation of the immobilized probe DNA on the grain boundaries of the NCD sample, where a hotspot of hybridized detection probe can be formed.
After successful attachment, the maximum length of dsDNA still allowing to measure Rth changes due to conformational changes in DNA upon denaturation was investigated by the thermal denaturation of fully complementary homoduplex dsDNA fragments with lengths up to the predicted dsDNA persistence length of 150 bp. An increase in Rth could be observed upon denaturation of dsDNA fragment length up to 123 bp. This increase illustrates the transition from upright dsDNA molecules, allowing efficient heat transfer, to highly flexible ssDNA fragments, insulating the sensor surface.24 The temperature associated with this transition can be used to determine the Tm of the dsDNA fragments. In this paper, a uniform procedure to evaluate Rth measurements is proposed to calculate the Tm, instead of estimating it, as previously described.24 This procedure consists of two steps. First, the Rth change is normalized to the linear decrease of Rth with increasing temperatures. The decrease in Rth is due to an increase in power to compensate for the heat loss from the sensor setup to the surrounding environment at higher temperatures. In a second step, the normalized curves were fitted with the sigmoidal Boltzmann function (Equation 2). The parameters in this equation describe the absolute Rth change upon denaturation and the corresponding Tm in a standardized approach. The somewhat noisy appearance of the normalized Rth graphs shown are related to the fact that the required heating power shows small fluctuations within short time intervals. In Figure 2A and C and Figure 3A and C, the noise level on Rth is decreased by a factor of three by improving the noise on the heating power.28
The absolute Rth change upon denaturation slightly decreases with increasing DNA lengths, due to an increase in initial Rth value of dsDNA fragments (A1) with increasing lengths. A feasible explanation is that the longer the dsDNA fragments become, the more they approach the persistence length of dsDNA and tend to curve instead of remain upright. This will disturb the heat transfer through the spaces in between the immobilized dsDNA fragments, resulting in a decreased resolution between ssDNA and dsDNA, shown by a decreased absolute Rth change upon denaturation. This is illustrated by the fact that no Rth change was observed when using DNA fragments of 150 bp, corresponding to the persistence length of dsDNA.
Furthermore, the Rth change upon denaturation, as measured in the first heating run, is larger than the actual Rth of ssDNA fragments, as measured in the second heating run. A possible explanation for this phenomenon is the formation of a transition state during the denaturation process, as described in denaturing gradient gel electrophoresis and temperature gradient gel electrophoresis experiments.29 The single-stranded portion of the partially melted molecules can form branches, which probably have a higher Rth value than ssDNA. Another explanation is that the higher Rth value is caused by the denaturated, untethered ssDNA strands that interact with the surface, causing a higher insulation of the NCD surface. After some time, this interaction is broken, causing a drop in Rth, as illustrated in Figure 3C.30 Finally, to investigate the use of Rth in detecting SNPs in longer dsDNA fragments, the temperature associated with the Rth change is studied in more detail. This temperature reflects the Tm of the studied dsDNA fragments. The Tm of heteroduplex dsDNA fragments containing an SNP is lower than the Tm of homoduplex dsDNA fragments. Based on the difference in Tm, SNPs could be detected by using the Rth technique by comparing the temperature of the Rth change during denaturation of heteroduplex dsDNA fragments containing an SNP with the temperature of the Rth change during denaturation of fully complementary homoduplex dsDNA sequences. The temperature at which half of the Rth change occurred (x0) during the denaturation of the heteroduplex dsDNA fragments is decreased compared with the temperature at which half of the Rth change occurred (x0) during the denaturation of the fully complementary homoduplex dsDNA fragments. This is due to the fact that heteroduplex dsDNA fragments containing an SNP are less stable than homoduplex dsDNA fragments, resulting in lower Tm. This was demonstrated by the Rth-based detection of following SNPs c.473G>A (R158Q), c.932T>C (p.L311P), and c.1222C>T (R408W) in synthetic fragments encompassing PAH exon 5, exon 9, or exon 12. The effect was confirmed in a proof-of-application setting when using the PCR product from exon 12 of a healthy control or a homozygous PKU patient having the c.1222C>T (R408W) SNP.
The results in this study indicate that Rth can be used to detect homozygous mutations in exon-length DNA fragments of PKU patients. In future work, the Rth-based detection of heterozygous mutations in exon-length DNA fragments of PKU carriers will be investigated. Therefore, the NCD will be functionalized with exon-length probe DNA fragments containing an SNP or no SNP, each in isolated areas on the surface. In a next step, all probes will be hybridized in high stringent conditions with exon-length target DNA fragments from PKU carriers. The thermal denaturation will result in a bipartite Rth change, reflecting the denaturation of the different dsDNA fragments present on the NCD surface.31 The bipartite Rth change can be fitted with the function described in Equation 3.

The parameter A1 (°C/W) describes the Rth value before denaturation of the dsDNA fragments. The parameters A2 (°C/W) and A3 (°C/W) describe the Rth value after denaturation of the mutated sequences and after denaturation of the fully complementary sequences, respectively. The parameters x01 (°C) and x02 (°C) describe the Tm of the mutated sequences and the Tm of the fully complementary sequences, respectively.
Hence, for the detection of heterozygous mutations, the sensor needs to be converted to an array-based system. However, the Rth-based technique is more cost effective than conventional microarray systems because of its label-free character and simple instrumentation.
Conclusion
Rth was evaluated as an alternative method to detect PKU-related mutations in a label-free, real-time manner during the thermal denaturation of entire PAH exons. The Rth effect reflects the change in DNA morphology while going from dsDNA, allowing effective heat transfer, to ssDNA, insulating the electrode surface against heat transfer. The temperature at which this Rth shift occurs, reflects the Tm of the dsDNA, implying SNP sensitivity. It was shown that Rth increase during the denaturation of homoduplex dsDNA, formed between a wild-type exon probe and a healthy control exon target, was thermally separated from the Rth increase during the denaturation of heteroduplex dsDNA, formed between a wild-type exon probe and an exon target of a PKU patient. This was limited by the length of the attached dsDNA, since the closer the length approaches the persistence length of dsDNA, the lower the resolution between dsDNA and ssDNA will become. This was evident by the absence of an Rth effect in exon 7, but will easily be resolved by the separation of the exon into two shorter, overlapping fragments. To allow the Rth-based technique to be used in routine genetic screening, heterozygous mutation detection will need to be addressed.
Acknowledgments
This work is supported by the Special Research Funds of Hasselt University, by the School for Life Sciences of the transnational University Limburg, and via the project G.0829.09 of the National Funds for Scientific Research Flanders FWO. Support by Dr Nick Smisdom, Bram Geerets, and Heman Kumar is gratefully acknowledged.
Disclosure
The authors reports no conflicts of interest in this work.
References
Blau N, van Spronsen FJ, Levy HL. Phenylketonuria. Lancet. 2010;376(9750):1417–1427. | |
Paine RS. The variability in manifestations of untreated patients with phenylketonuria (phenylpyruvic aciduria). Pediatrics. 1957;20(2):290–302. | |
Bickel H, Gerrard JW, Hickmans EM. Influence of phenylalanine intake on phenylketonuria. Lancet. 1953;265(6790):812–813. | |
Muntau AC, Roschinger W, Habich M, et al. Tetrahydrobiopterin as an alternative treatment for mild phenylketonuria. N Engl J Med. 2002;347(26):2122–2132. | |
Guthrie R, Susi A. A simple phenylalanine method for detecting phenylketonuria in large populations of newborn infants. Pediatrics. 1963;32:338–343. | |
Phenylalanine Hydroxylase Locus Knowledgebase [database on the Internet]. Canada: DeBelle Laboratory; c2002–2010 [updated August 31, 2009]. Available from: http://www.pahdb.mcgill.ca. Accessed November 26, 2013. | |
Woo SLC, Lidsky AS, Guttler F, Chandra T, Robson KJH. Cloned human phenylalanine hydroxylase gene permits prenatal diagnosis and carrier detection of classical phenylketonuria. Nature. 1983;306(5939):151–155. | |
Lidsky AS, Ledley FD, DiLella AG, et al. Extensive restriction site polymorphism at the human phenylalanine hydroxylase locus and application in prenatal diagnosis of phenylketonuria. Am J Hum Genet. 1985;37(4):619–634. | |
Riess O, Michel A, Speer A, Cobet G, Coutelle C. Introduction of genomic diagnosis of classical phenylketonuria to the health care system of the German Democratic Republic. Clin Genet. 1987;32(4):209–215. | |
DiLella AG, Kwok SCM, Ledley FD, Marvit J, Woo SLC. Molecular structure and polymorphic map of the human phenylalanine hydroxylase gene. Biochemistry. 1986;25(4):743–749. | |
Guldberg P, Henriksen KF, Güttler F. Molecular analysis of phenylketonuria in Denmark: 99% of the mutations detected by denaturing gel electrophoresis. Genomics. 1993;17(1):141–146. | |
Michiels L, François B, Raus J, Vandevyver C. Rapid identification of PKU-associated mutations by multiplex DGGE analysis of the PAH gene. J Inherit Metab Dis. 1996;19(6):735–738. | |
Desai AN, Jere A. Next-generation sequencing: ready for the clinics? Clin Genet. 2012;81(6):503–510. | |
Chen B, Zhou X, Li C, Wanga Q, Liua D, Lin B. Rapid screening of phenylketonuria using a CD microfluidic device. J Chromatogr A. 2011;1218(14):1907–1912. | |
Ozkan D, Erdem A, Kara P, et al. Allele-specific genotype detection of factor V Leiden mutation from polymerase chain reaction amplicons based on label-free electrochemical genosensor. Anal Chem. 2002;74(23):5931–5936. | |
Ariksoysal DO, Karadeniz H, Erdem A, Sengonul A, Sayiner AA, Ozsoz M. Label-free electrochemical hybridization genosensor for the detection of hepatitis B virus genotype on the development of Lamivudine resistance. Anal Chem. 2005;77(15):4908–4917. | |
Farjami E, Clima L, Gothelf K, Ferapontova EE. “Off-On” electrochemical hairpin-DNA-based genosensor for cancer diagnostics. Anal Chem. 2011;83(5):1594–1602. | |
Zhu L, Luo L, Wang Z. DNA electrochemical biosensor based on thionine-graphene nanocomposite. Biosens Bioelectron. 2012;35(1):507–511. | |
Bianchi N, Rutigliano C, Tomassetti M, Feriotto G, Zorzato F, Gambari R. Biosensor technology and surface plasmon resonance for real-time detection of HIV-1 genomic sequences amplified by polymerase chain reaction. Clin Diagn Virol. 1997;8(3):199–208. | |
Altintas Z, Tothill IE. DNA-based biosensor platforms for the detection of TP53 mutation. Sens Actuators B Chem. 2012;169:188–194. | |
Knez K, Janssen K, Spasic D, et al. Spherical nucleic acid enhanced FO-SPR DNA melting for detection of mutations in Legionella pneumophila. Anal Chem. 2013;85(3):1734–1742. | |
Vermeeren V, Bijnens N, Wenmackers S, et al. Towards a real-time, label-free, diamond-based DNA sensor. Langmuir. 2008;23(26):13193–13202. | |
van Grinsven B, Vanden Bon N, Grieten L, et al. Rapid assessment of the stability of DNA duplexes by impedimetric real-time monitoring of chemically induced denaturation. Lab Chip. 2011;11(9):1656–1663. | |
van Grinsven B, Vanden Bon N, Strauven H, et al. Heat-transfer resistance at solid-liquid interfaces: a tool for the detection of single-nucleotide polymorphisms in DNA. ACS Nano. 2012;6(3):2712–2721. | |
Wenmackers S, Vermeeren V, vandeVen M, et al. Diamond-based DNA sensors: surface functionalization and read-out technologies. Phys Status Solidi A. 2009;206(3):391–408. | |
Steel AB, Levicky R, Herne TM, Tarlov MJ. Immobilization of nucleic acids at solid surfaces: effect of oligonucleotide length on layer assembly. Biophys J. 2000;79(2):975–981. | |
Sakon JJ, Ribeill GJ, Garguilo JM, Parkins J, Weninger KR, Nemanich RJ. Fluorescence quenching effects of nanocrystalline diamond surfaces. Diam Relat Mater. 2009;18(1):82–87. | |
Geerets B, Peeters M, van Grinsven B, Bers K, de Ceuninck W, Wagner P. Optimizing the thermal read-out technique for MIP-based biomimetic sensors: towards nanomolar detection limits. Sensors (Basel). 2013;13(7):9148–9159. | |
Wartell RM, Hosseini S, Powell S, Zhu J. Detecting single base substitutions, mismatches and bulges in DNA by temperature gradient gel electrophoresis and related methods. J Chromatogr A. 1998;806(1):169–185. | |
Qamhieh K, Wong K, Lynch GC, Pettitt BM. The melting mechanism of DNA tethered to a surface. Int J Numer Anal Model. 2009;6(3):474–488. | |
Bers K, van Grinsven B, Vandenryt T, et al. Implementing heat transfer resistivity as a key element in a nanocrystalline diamond based single nucleotide polymorphism detection array. Diam Relat Mater. 2013;38:45–51. |
 © 2014 The Author(s). This work is published and licensed by Dove Medical Press Limited. The full terms of this license are available at https://www.dovepress.com/terms.php and incorporate the Creative Commons Attribution - Non Commercial (unported, v3.0) License.
By accessing the work you hereby accept the Terms. Non-commercial uses of the work are permitted without any further permission from Dove Medical Press Limited, provided the work is properly attributed. For permission for commercial use of this work, please see paragraphs 4.2 and 5 of our Terms.
© 2014 The Author(s). This work is published and licensed by Dove Medical Press Limited. The full terms of this license are available at https://www.dovepress.com/terms.php and incorporate the Creative Commons Attribution - Non Commercial (unported, v3.0) License.
By accessing the work you hereby accept the Terms. Non-commercial uses of the work are permitted without any further permission from Dove Medical Press Limited, provided the work is properly attributed. For permission for commercial use of this work, please see paragraphs 4.2 and 5 of our Terms.