")
Back to Journals » Vascular Health and Risk Management » Volume 10
Heart rate variability measured early in patients with evolving acute coronary syndrome and 1-year outcomes of rehospitalization and mortality
Authors Harris P , Stein P, Fung G, Drew B
Received 13 November 2013
Accepted for publication 9 January 2014
Published 5 August 2014 Volume 2014:10 Pages 451—464
DOI https://doi.org/10.2147/VHRM.S57524
Checked for plagiarism Yes
Review by Single anonymous peer review
Peer reviewer comments 2
Patricia R E Harris,1 Phyllis K Stein,2 Gordon L Fung,3 Barbara J Drew4
1Electrocardiographic Monitoring Research Laboratory, School of Nursing, Department of Physiological Nursing, University of California, San Francisco, CA, USA; 2Heart Rate Variability Laboratory, School of Medicine, Division of Cardiology, Washington University, St Louis, MO, USA; 3Cardiology Services, Mount Zion, Department of Medicine, Division of Cardiology, University of California, San Francisco, CA, USA; 4School of Nursing, Department of Physiological Nursing, Division of Cardiology, University of California, San Francisco, CA, USA
Objective: This study sought to examine the prognostic value of heart rate variability (HRV) measurement initiated immediately after emergency department presentation for patients with acute coronary syndrome (ACS).
Background: Altered HRV has been associated with adverse outcomes in heart disease, but the value of HRV measured during the earliest phases of ACS related to risk of 1-year rehospitalization and death has not been established.
Methods: Twenty-four-hour Holter recordings of 279 patients with ACS were initiated within 45 minutes of emergency department arrival; recordings with ≥18 hours of sinus rhythm were selected for HRV analysis (number [N] =193). Time domain, frequency domain, and nonlinear HRV were examined. Survival analysis was performed.
Results: During the 1-year follow-up, 94 patients were event-free, 82 were readmitted, and 17 died. HRV was altered in relation to outcomes. Predictors of rehospitalization included increased normalized high frequency power, decreased normalized low frequency power, and decreased low/high frequency ratio. Normalized high frequency >42 ms2 predicted rehospitalization while controlling for clinical variables (hazard ratio [HR] =2.3; 95% confidence interval [CI] =1.4–3.8, P=0.001). Variables significantly associated with death included natural logs of total power and ultra low frequency power. A model with ultra low frequency power <8 ms2 (HR =3.8; 95% CI =1.5–10.1; P=0.007) and troponin >0.3 ng/mL (HR =4.0; 95% CI =1.3–12.1; P=0.016) revealed that each contributed independently in predicting mortality. Nonlinear HRV variables were significant predictors of both outcomes.
Conclusion: HRV measured close to the ACS onset may assist in risk stratification. HRV cut-points may provide additional, incremental prognostic information to established assessment guidelines, and may be worthy of additional study.
Keywords: autonomic cardiac function, coronary artery disease, outcomes research, risk assessment, hospital readmittance, mortality
Introduction
Identification of patients at increased risk for rehospitalization or death within a year of presenting to the emergency department (ED) with acute coronary syndrome (ACS) (ie, diagnosis of ST elevation myocardial infarction, non-ST elevation myocardial infarction, or unstable angina (UA), can help guide ongoing therapy. Safe, cost-effective, and readily available tools to aid in risk assessment are needed. Heart rate variability (HRV) is a measure derived from noninvasive cardiac monitoring that reflects autonomic cardiac function1,2 and may provide insight into patients’ ability to recover from physiological insult, such as myocardial infarction (MI) or an episode of UA. In a 1987 study by Kleiger et al,3 the standard deviation of normal sinus RR intervals (SDNN), measured using 24-hour Holter recordings, was associated with all-cause death in the post-MI population.3 Subsequent research has supported the association of decreased HRV and mortality in patients with cardiovascular disease.4–8 Less is known, however, about the prognostic value of HRV measurement initiated within the first hour of ED presentation during the earliest phases of ACS, particularly in association with risk of rehospitalization (Table 1 provides a list of HRV variable definitions).
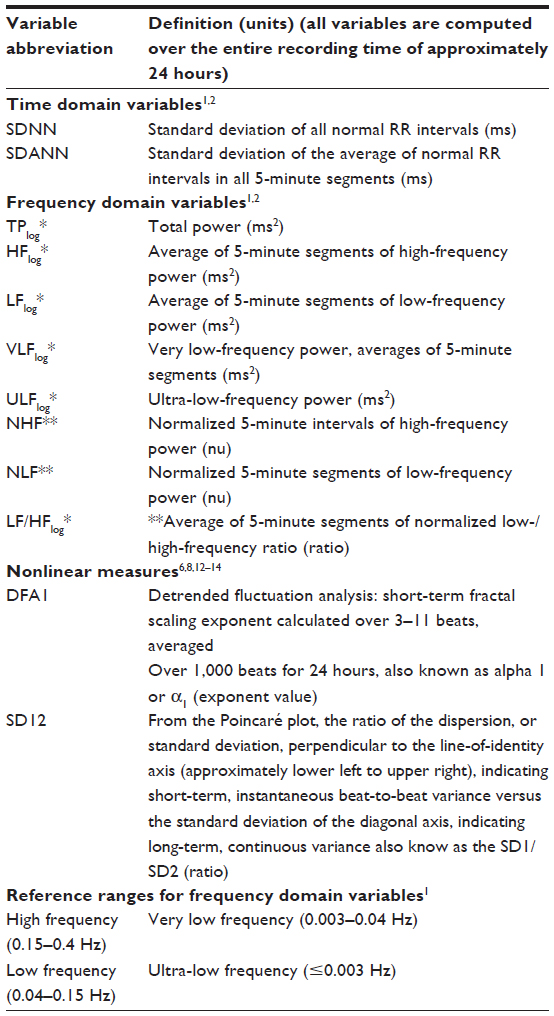 | Table 1 Definitions of heart rate variability variables computed for this study |
The primary aims of this study were to answer the following questions in patients presenting to the ED with ACS:
- Is HRV measured during the 24 hours after ED arrival predictive of 1-year all-cause:
- rehospitalization; or
- death?
- Which HRV variables, if any, may serve as clinically useful tools to aid in risk stratification for ACS patients over the course of a 1-year follow-up period?
Methods
Research design and sample
A secondary analysis was performed of electrocardiographic (ECG) data from the Ischemia Monitoring and Mapping in the Emergency Department In Appropriate Triage and Evaluation of Acute Ischemic Myocardium (IMMEDIATE AIM) study,9 a prospective clinical trial of patients who presented to the ED of a large urban hospital with symptoms of ACS (number [N] =1,308), funded by the National Institutes of Health, Washington DC, United States (RO1HL69753). We enrolled patients from 2002–2004. Each patient was followed for 1 year, and the study ended in 2005. Patients’ verbal assent was obtained in the ED, and written consent was obtained from the patient or the patient’s surrogate after the patient stabilized. The University of California, San Francisco (CA, USA) institutional review board approved the study.
Data collection
Twenty-four-hour Holter recorders (HScribe™ System, Mortara Instrument, Inc., Milwaukee, WI, USA) were placed within minutes of ED arrival (median “door-to-Holter” time, 44 minutes). The sampling rate was 180 samples/second. Research nurses applied ECG leads, supervised monitoring, and downloaded data to the HScribe review station. Radiolucent electrodes and lead wires were used to aid in uninterrupted monitoring, including during chest radiography and cardiac catheterization procedures. Patients’ demographic and clinical information was gathered upon enrollment or extracted later via chart review.
Follow-up
Nurses followed patients for 1 year after their ED visit. Discharge diagnoses, determined in accordance with criteria of cardiovascular disease in the International Statistical Classification of Diseases and Related Health Problems,10 were identified from medical records. Data regarding patients’ hospital readmissions and survival were collected via telephone calls, medical records, and/or the public access social security mortality database. Using at least one of these avenues, 1-year survival and rehospitalization information was obtained for all patients in the current analysis. When possible, the patient’s report of a cardiac cause for rehospitalization was corroborated with the medical record.
Inclusion and exclusion criteria
Only ECG recordings with 18 hours or more were included. These recordings represented patients who were admitted to the hospital to rule out MI. If a patient was admitted more than once during the study enrollment period, only the recording for the first admission was included. Patients who were positively diagnosed with ACS by time of discharge were selected for analysis (N=193). Since HRV requires normal sinus rhythm to evaluate,1 recordings of patients with atrial fibrillation or paced rhythms were excluded. Figure 1 is a flowchart of the inclusion process.
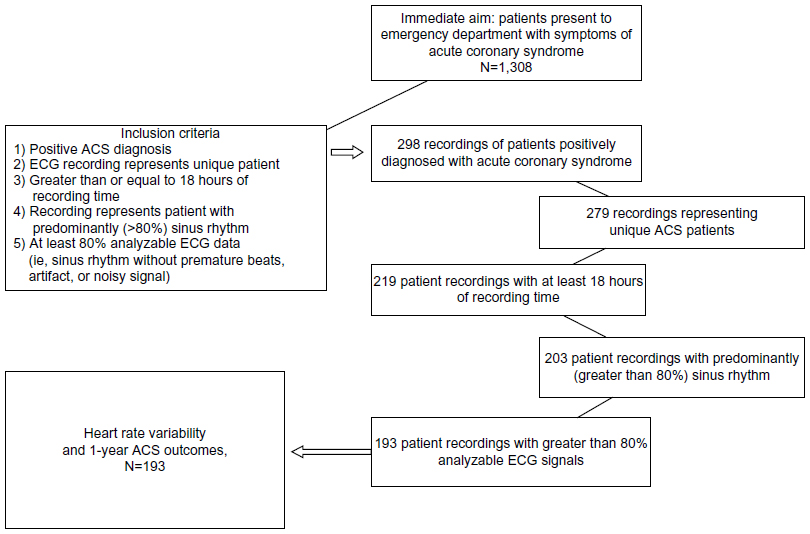 | Figure 1 Flow chart for inclusion in the analysis of heart rate variability and 1-year outcomes in an ACS study. |
Endpoints
Primary outcomes were all-cause rehospitalization or death between ED discharge and end of follow-up. Patients who returned to the hospital and subsequently died before year’s end were included in the analyses of mortality only. Rehospitalizations and/or deaths due to cardiac causes, ie, a recurring ACS episode and/or heart failure, were also documented.
Demographic and clinical variables
Variables chosen for the analysis included established risk factors11 and potential confounders of outcomes. Among the variables chosen for examination were sex, race, category of ACS diagnosis, comorbidities (such as diabetes or hypertension), history (such as previous diagnosis of coronary artery disease [CAD]), clinical factors (such as peak troponin and ST changes), social factors (such as smoking status), living situation (alone or with another person), ACS therapies (such as beta blocker administration or reperfusion procedure within 90 minutes of ED arrival), and events during the course of hospitalization, including surgery or complications (such as cardiac arrest) (see Table 2). Age was examined both as a continuous variable and as a categorical variable, dichotomized at 65 years as per the Thrombolysis in Myocardial Infarction risk score.11 MI and UA diagnoses were examined together, and then separately, in relation to HRV variables and outcomes.
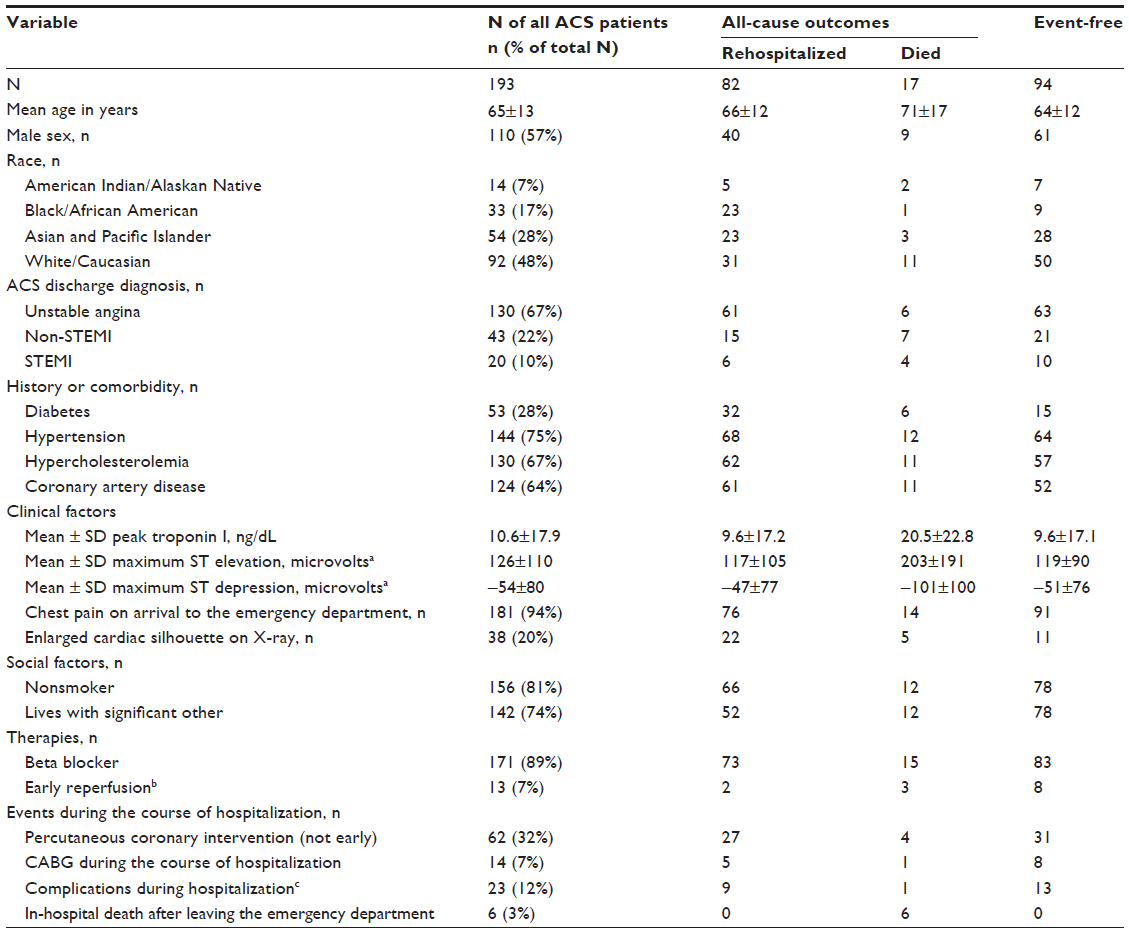 | Table 2 Demographic and clinical characteristics in relation to 1-year outcomes |
Heart rate variability analysis
HScribe™ analysis software (Mortara Instruments, Inc.) located at the ECG Monitoring Research Laboratory, University of California, San Francisco, School of Nursing (San Francisco, CA, USA) displayed the waveforms. All ECG recordings were automatically scanned and manually edited by one researcher to maintain uniformity and to ensure that only normal-to-normal beats were included in the analyses. Beat-to-beat files were generated. HRV research software, validated by the Heart Rate Variability Laboratory, Washington University School of Medicine, St Louis, MO (USA), verified the eligible recordings, and used an algorithm to compute time domain, frequency domain, and nonlinear variables.
Time-domain measurements were computed using descriptive statistical methods. To evaluate HRV variables in the frequency domain, Fast Fourier transform spectral analysis was performed.1 From the start of the recording time, 5-minute intervals were segmented. All intervals with at least 75% of analyzable data – ie, those that displayed at least 75% normal sinus rhythm – were used. Overall, a recording needed to have at least 75% or 18 hours of analyzable rhythm to be included in the analysis.
To assess nonlinear HRV properties, two variables were selected: the short-term fractal-scaling exponent (DFA1); and the Poincaré ratio (SD12). DFA1 was computed using detrended fluctuation analysis, a method that takes into account changing conditions over time and is applicable of analyzing physiologic signals.12–13 Poincaré plots are graphic representations of coordinates corresponding to consecutive normal RR intervals, and were generated for each patient to visualize HRV organization and explore nonlinear HRV characteristics. The Poincaré ratio is the ratio of axes of an ellipse fitted to the plot (SD1= short axis/SD2= long axis, ratio = SD12), reflecting short-term, beat-to-beat variation compared to long-term, continuous variation.7,15–17
HRV variables chosen for the analysis were based upon published standards1 and previous research.3–8,12–21 See Table 1 for additional details about HRV.
Statistical analyses
Descriptive statistics assessed demographic and clinical variables. Variables without normal distribution were transformed using natural logs.7,21 Discharge diagnoses of UA or MI in relation to outcomes were examined using the chi-square test.
Simple Cox regression univariate survival analyses were performed for each HRV, demographic, and clinical variable to assess proportional hazards across time. With the exception of the known risk factors of age and sex,11 only clinical or demographic variables identified during the univariate analyses with P<0.10 were included in the multivariate analyses. Table 3 shows the results of the simple or univariate analyses for the clinical and demographic variables. HRV variables were then retested in models with the identified demographic and clinical risk factors (alpha <0.05). Highly correlated variables (r≥0.7) were not tested within the same model.
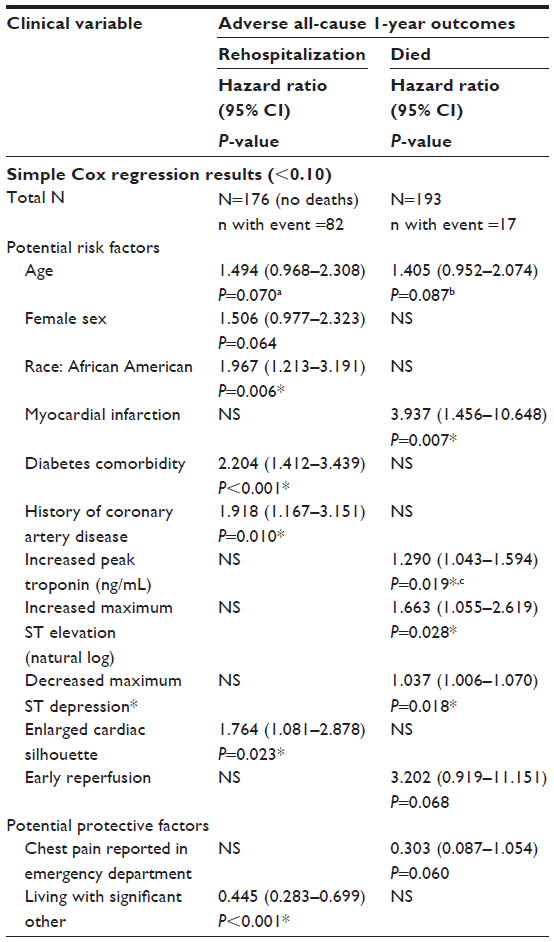 | Table 3 Significant demographic or clinical variables and 1-year outcomes |
To identify meaningful HRV cut-points in relation to outcomes, receiver–operator curves were generated. High sensitivity and specificity provided a reference value for systematically assessing variables in relationship to each outcome by maximizing the log likelihood in simple Cox regression analyses. In multivariate models, age and sex were retained as potentially relevant predictors, and backward elimination further assisted in identifying the most significant prognostic contributors. Significant categorical HRV variables were examined and tested for interactions with covariates. Bootstrapping (1,000 samples; 95% confidence interval [CI]) was used to examine model stability (alpha <0.05).22 Harrell’s cumulative index (C-statistic) was calculated to evaluate the models’ predictive ability. Analyses were performed using IBM statistical software (SPSS 19; IBM Corporation, Armonk, NY, USA).
Results
Patient characteristics and outcomes
Median ECG recording time was 1,439 minutes. Median follow-up for survivors was 369 days. Patient characteristics are in Table 2. Ninety-four patients (48.7%) had event-free outcomes. Eighty-two patients (42.5%) were readmitted for any cause; 67 had a cardiac diagnosis (82% of readmissions). Of the 15 patients who were readmitted for any cause, but that were not cardiac related, nine had a comorbidity of diabetes. Seventeen patients (8.8%) died, 13 due to cardiac causes (76.5% of deaths).
Chi-square analysis revealed that all-cause death within 1 year was significantly more prevalent in patients diagnosed with MI as opposed to those with UA (P=0.003; odds ratio: 4.372; 95% CI =1.536–12.444). However, the ACS diagnostic group was not a significant factor in prevalence of all-cause rehospitalization. Similarly, chi-square analysis did not show that cardiac death or cardiac rehospitalization was significantly related to ACS diagnosis. Significant univariable Cox regression results for demographic and clinical variables are in Table 3.
Continuous HRV and 1-year rehospitalization
Simple Cox regression analyses demonstrated that decreased normalized low frequency (NLF), low/high frequency ratio (LF/HF), natural log of very LF, and DFA1 were significant predictors of all-cause rehospitalization, as were elevated normalized HF (NHF) and SD12 (Table 4). Simple Cox regression analyses also showed that when hospitalization was limited to those who were admitted for cardiac causes (67 events, no deaths), decreased NLF (hazard ratio [HR] =0.983; 95% CI =0.968–0.997; P=0.021), decreased natural log of the LF/HF (LF/HFlog) (HR =0.688; 95% CI =0.498–0.950; P=0.023), and increased NHF (HR =1.026; 95% CI =1.006–1.046; P=0.012) remained significant predictors. Other HRV variables were not significantly different in relation to rehospitalization outcomes.
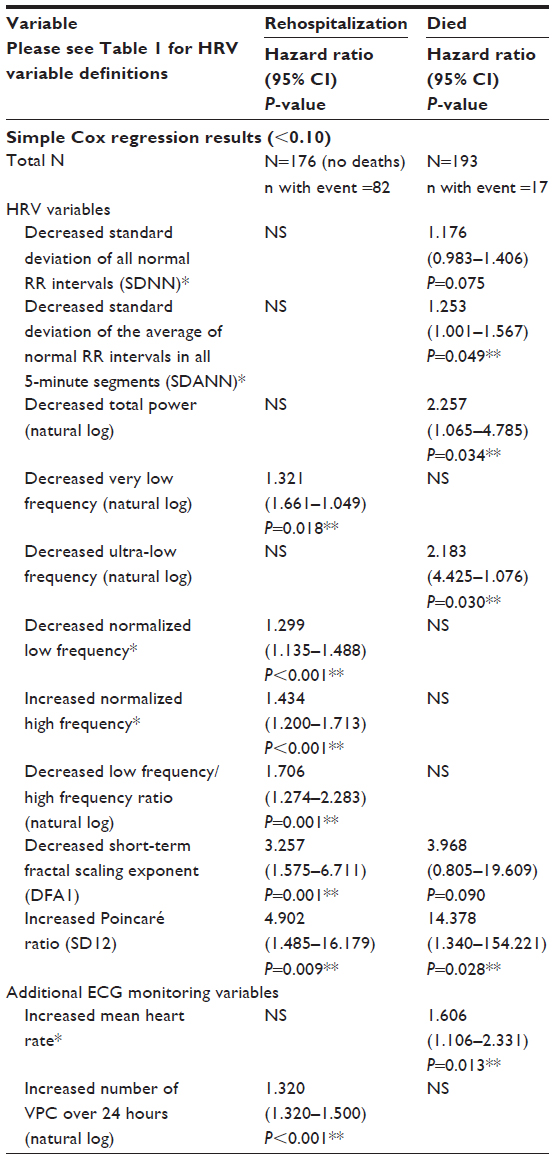 | Table 4 Significant continuous HRV variables and 1-year outcomes |
In chi-square analyses of the 15 patients rehospitalized for a noncardiac reason, a diabetes diagnosis was significantly related to hospital readmission (Pearson’s chi-square, 14.614; P<0.001).
NHF, NLF, LF/HF, DFA1, and SD12 continued to be significant predictors in conjunction with age, sex, living situation, diabetes, and history of CAD in multivariate analysis. Predictive power ranged from 74%–76% (Table 5). When patients diagnosed with UA were examined alone in the multivariate Cox regression model, continuous NHF was a significant independent predictor of all-cause rehospitalization (P=0.028).
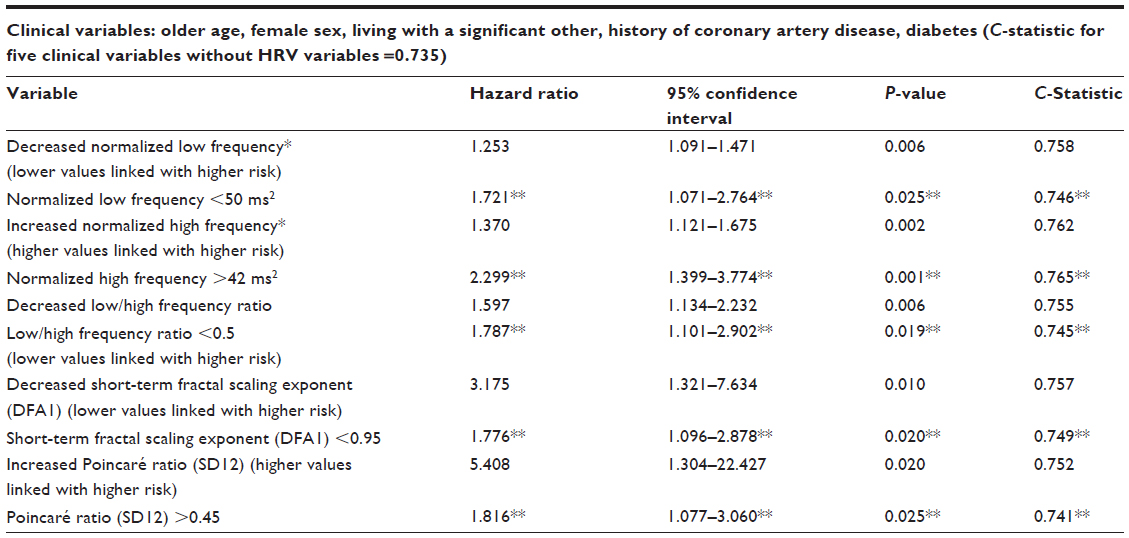 | Table 5 HRV, clinical variables, and all-cause 1-year rehospitalization – continuous and dichotomized HRV and five clinical variables in multivariate Cox regression and C-statistic |
Continuous HRV and 1-year mortality
In simple Cox regression analyses, lower standard deviation of the average SDANN (standard deviation of the average of normal RR intervals in all 5-minute segments), natural logs of total power (TPlog) and ultra LF power (ULFlog), and DFA1 were significantly associated with death. Higher SD12 was also significantly associated (Table 4). Other HRV variables were not significantly different in conjunction with survival. In an examination of mortality with UA patients alone, HRV was not a significant predictor.
HRV cut-points and 1-year rehospitalization
A receiver operator curve showed that the area under the curve for NHF was 0.67 (P=0.041) with higher values associated with rehospitalization. A systematic assessment of cut-points using simple Cox regression revealed the log likelihood was maximized at NHF =42 normalized units (nu) (HR =2.60; 95% CI =1.66–4.07; P<0.001). Chi-square analysis showed that this cut-point had a sensitivity of 39% and specificity of 88%, a positive predictive value of 74%, and a negative predictive value of 63% (chi-square =17.708, P<0.001). Tested in the same manner, lower NLF was associated with rehospitalization, area under the curve =0.67 (P=0.040). NLF <50 nu maximized the log likelihood (HR =1.975; 95% CI =1.28–3.05) of rehospitalization. Sensitivity was 70%, specificity was 51%, the positive predictive value was 62%, and the negative predictive value was 60% (chi-square =8.398; P=0.004). This method also identified the LF/HFlog ratio, DFA1, and SD12 cut-points; multivariate Cox regression analysis results are in Table 5.
HRV cut-points and 1-year mortality
HRV cut-points associated with mortality were determined in a similar fashion to those for rehospitalization. In simple Cox regression models, low SDANN <53 ms (HR =3.654; 95% CI =1.390–9.603; P=0.009), TPlog <8.4 ms2 (HR =3.71; 95% CI =1.43–9.62; P=0.007), ULFlog <8.0 ms2 (HR =3.70; 95% CI =1.39–9.60; P=0.009), and high SD12 >0.45 ratio (HR =3.358; 95% CI =1.296–8.706; P=0.013) were significant predictors of all-cause 1-year mortality.
Clinical risk model for 1-year rehospitalization
An interaction was found between NHF dichotomized at 42 nu and diabetes (HR =2.667; 95% CI =1.08–6.62; P=0.034). The consistency of the interaction remained significant when diabetes was tested using NHF as a continuous variable (P=0.008). Combining NHF dichotomized at 42 nu and diabetes created a variable with four categories. Cox regression analysis showed that patients with either NHF >42 nu or diabetes were more likely to return to the hospital than patients without either of those conditions. Patients with both conditions were even more likely to return (Figure 2).
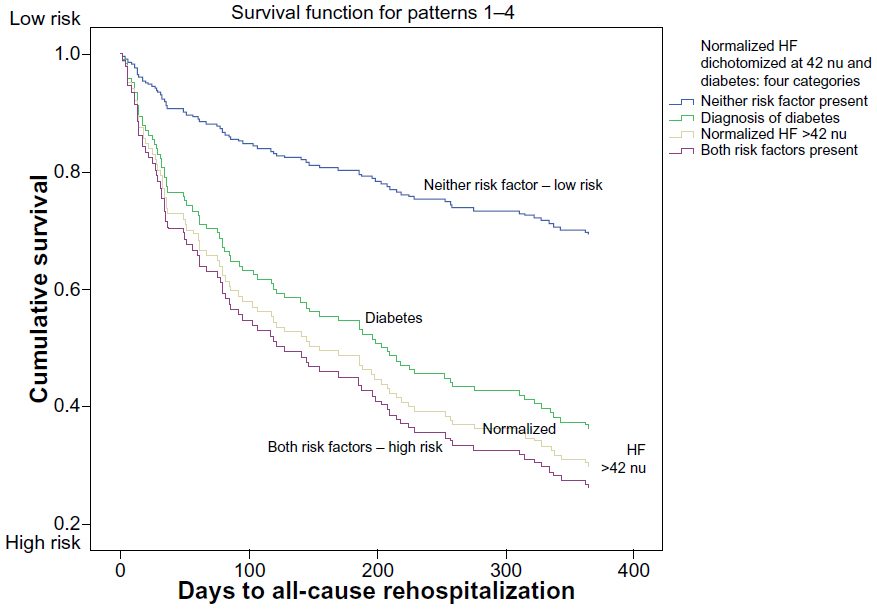 | Figure 2 Normalized HF heart rate variability and diabetes: risk of rehospitalization within 1 year of presentation to the emergency department with acute coronary syndrome. |
Similarly, patients with a history of CAD and NLF <50 nu were more likely to be readmitted than patients without either condition, or with one condition alone (Figure 3).
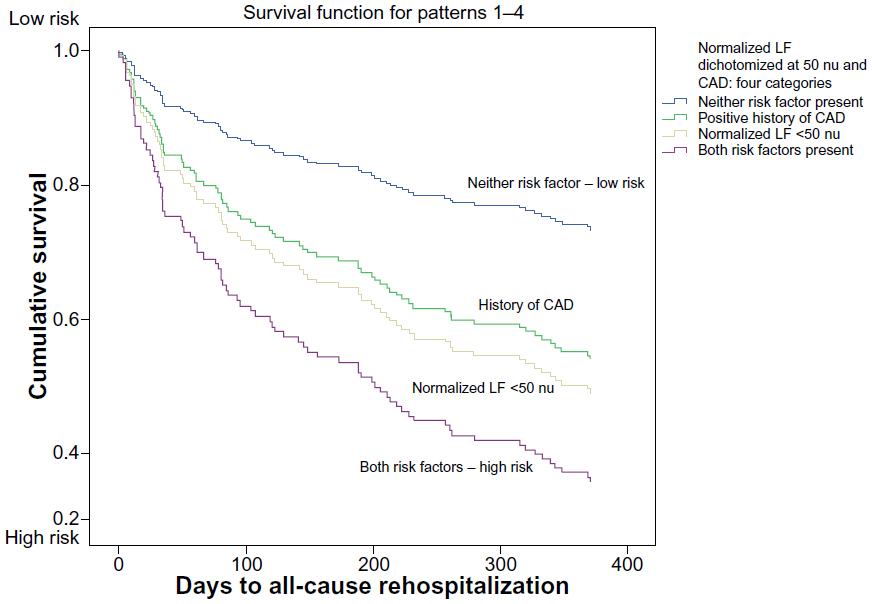 | Figure 3 Normalized LF heart rate variability and CAD history: risk of rehospitalization within 1 year of presentation to the emergency department with acute coronary syndrome. |
Clinical risk model for 1-year mortality
Patients diagnosed with MI were at higher risk for mortality according to our chi-square findings, leading us to an examination of HRV in conjunction with cardiac troponin. In a Cox regression model, ULFlog <8 ms2 (HR =3.822; 95% CI =1.452–10.060; P=0.007) and peak Troponin I >0.3 nm/mL (HR =3.956; 95% CI =1.288–12.144; P=0.016) were strong independent predictors of death (model chi-square =14.625; P=0.001). Peak cardiac troponin of >0.3 ng/mL was used as the cut-point for analysis per the local laboratory standard definition of myocardial injury at the time of data collection.
In a second analysis, dichotomized ULFlog<8 ms2 and peak troponin >0.3 ng/mL were categorized into four groups (low to high risk), and served to examine the relationship of these variables with all-cause death (Figure 4). Fourteen out the 17 nonsurvivors, including ten of 13 cardiac deaths, were identified by values of ULFlog <8 ms2 and/or troponin >0.3 ng/mL. Presence of the two variables together proved to be a stronger predictor of death than either variable alone.
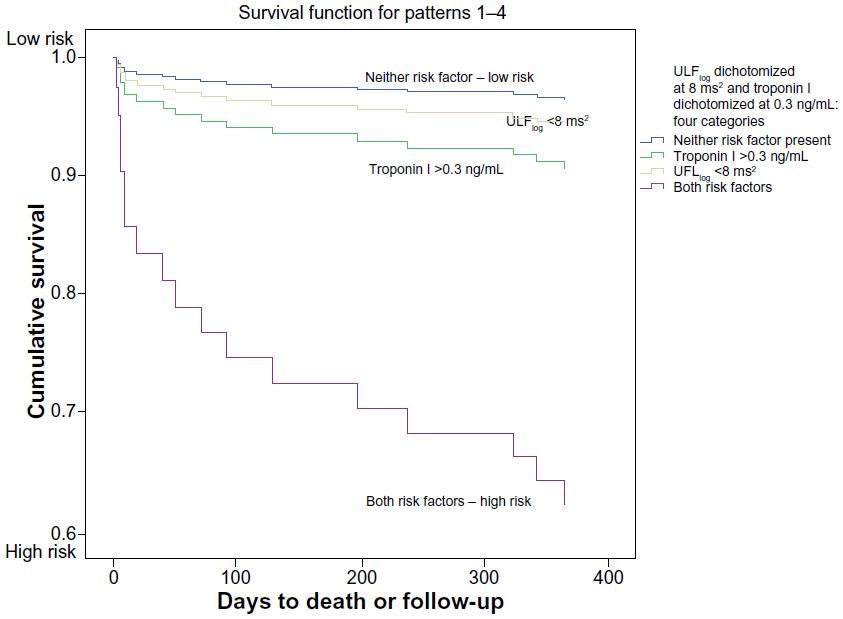 | Figure 4 Ultra-low frequency heart rate variability and cardiac troponin: risk of death within 1 year of presentation to the emergency department with acute coronary syndrome. |
SDANN <53 ms (HR =3.63; 95% CI =1.38–9.55; P=0.009) and cardiac troponin >0.3 ng/mL (HR =3.79; CI =1.24–11.64) (model chi-square =14.197; P=0.020) provided another predictive model for all-cause mortality (model chi-square, P=0.001), as did TPlog <8.4 ms2 (HR =3.65; 95% CI =1.41–9.48; P=0.008) and troponin >0.3 ng/mL (HR =3.54; 95% CI =1.23–11.53; P=0.021) (model chi-square =14.559; P=0.001).
Cardiac outcomes
Seventy-three rehospitalizations and 13 deaths were attributed to cardiac causes. Cox regression analyses revealed that NLF power (P=0.006), NHF power (P=0.004), LF/HF ratio (P=0.006), and DFA1 (P=0.031) were significantly associated with cardiac rehospitalization in univariate analysis. NHF power (P=0.031) and LF/HF ratio (P=0.047) remained significant in the multivariate analyses with age, sex, comorbidity of diabetes, prior history of CAD, and living with a significant other. These relationships remained significant in bootstrap models.
Thirteen deaths within the first year were due to cardiac causes. When cardiac mortality alone was examined, low SDNN (HR =0.764; 95% CI =0.608–0.958; P=0.020), SDANN (HR =0.712; 95% CI =0.536–0.946; P=0.019), TPlog (HR =0.298; 95% CI =0.123–0.718; P=0.007), and ULFlog (HR =0.323; 95% CI =0.142–0.735; P=0.007) were significant predictors. Again, significant relationships were maintained in bootstrap models. Other HRV variables were not significantly different in conjunction with cardiac survival.
Poincaré plots
Elevated Poincaré ratio, SD12, was a significant predictor of both rehospitalization and death; SD12 >0.45 was significant for both outcomes. Poincaré plots provided a visual representation of SD12 and HRV organization for each patient. To illustrate organizational differences, the plots for three patients are depicted in Figure 5. Each row documents three 1-hour periods during the 24-hour recording time. SD12 for each hour is recorded to the left of each plot. Row A represents a UA patient who has elevated NHF power and was rehospitalized. The plot is clustered high and to the right. Row B represents a patient diagnosed with non-ST elevation MI who died. The plot is clumped toward the lower left, suggestive of disease.14 Row C represents a patient diagnosed with UA who remained event-free. The plot shape is similar to that of a healthy person.14
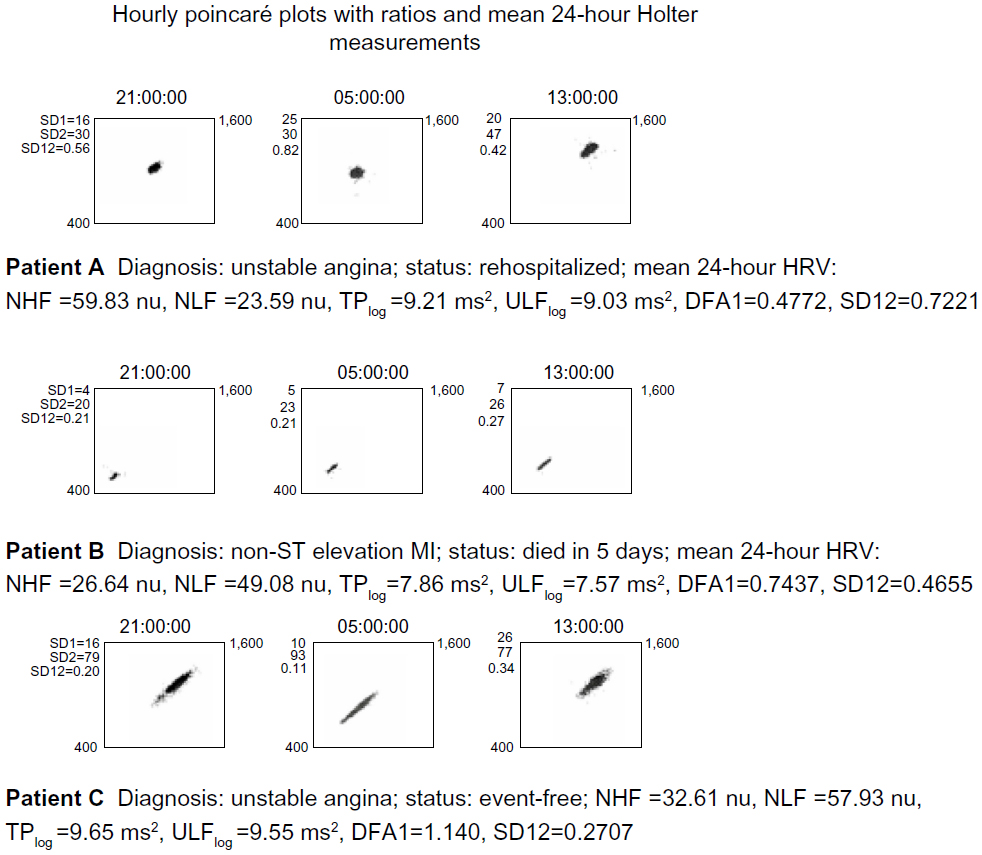 | Figure 5 HRV illustrated with Poincaré plots: 1-hour Poincaré plots, 9–10 PM, 5–6 AM, and 1–2 PM in three patients with different outcomes. |
Discussion
Numerous studies have shown that altered HRV is associated with autonomic dysfunction and worse outcomes in patients with cardiac disease,3–8,15–20 and is even linked to increased cardiovascular risk in older adults without previously recognized problems.13,14,21 The value of HRV in ACS prognosis has been demonstrated, and HRV is a class 2b recommendation for the assessment of ventricular arrhythmias in patients with ST-elevation MI.23 However, it is not included in recommendations for non-ST-elevation MI or UA. We believe that that the innovation of our study lies in the very early initiation of ECG Holter recording – within the first hour of ED arrival – and it demonstrates that HRV measured during the first 24 hours after ED presentation, even with the possibility of hemodynamic instability and increased sympathetic activation, provides an excellent opportunity to obtain this vital information.
Additionally, HRV in relation to ACS patients without MI and their 1-year rehospitalization outcomes deserve further attention. In hospitalized UA patients, Huang et al24 found that transient ST depression and silent ischemia were associated with lower HRV. Patients who stabilized showed improvements in HRV after admission. SDNN <50 ms was significantly associated with four deaths during the ensuing 11 months (P<0.0001).24 In addition, Carpeggiani et al6 measured HRV with Holter monitors that were initiated 48±14 hours after admission in MI patients. The main endpoints were in-hospital complications; low LF power was found to be a significant predictor.6 Lanza et al25 collected data from 1997–2001 using Holter recordings that were started within 24 hours of hospital admission in 543 UA patients. Primary endpoints were in-hospital and 6-month deaths, and a secondary endpoint was nonfatal acute MI. The mean of the standard deviations of RR intervals for all 5-minute segments in 24 hours (called the SDNN index) and LF power were significantly associated with in-hospital mortality in multivariate analysis. LF power and the LF/HF ratio were associated with 6-month mortality. HRV was not significantly associated with nonfatal outcomes.
While evidence shows that HRV can be altered in UA patients, the changes in relation to 1-year outcomes need further investigation. To our knowledge, this is the first study to show that HRV measurements derived from 24-hour Holter recordings started within the first hour of ED presentation in patients with evolving ACS (a period of time likely to be associated with a high level of sympathetic activation), including both UA and MI diagnoses, are associated with 1-year all-cause rehospitalization and mortality.
1-year all-cause rehospitalization
Hospital readmittance after an ED visit with an ACS diagnosis is common and contributes directly to the economic burden of health care. Johnston et al26 studied insurance claims of 30,200 ACS patients between 2002–2007; even one cardiac rehospitalization within a year of the initial ED presentation increased cost of care by nearly $10,000 USD for every additional visit.
Approximately 43% of the ACS patients in our study were readmitted to the hospital for any cause and 38% for a cardiac reason within 1 year. These figures represent a higher proportion of rehospitalized patients than the 30% reported by Johnston et al.26 The high percentage of patients with diabetes (28%) may have contributed to this result. Of the patients who were rehospitalized for a noncardiac reason, 60% had a comorbidity of diabetes.
While research has shown increased risks other than death in ischemic heart disease patients who have altered HRV, such as in-hospital complications,6 life-threatening arrhythmias,15 and ischemia after coronary artery bypass grafting,16 less is known about the connection between HRV and the rehospitalization of ACS patients. Our study revealed that increased NHF and SD12 along with decreased NLF, LF/HF ratio, and DFA1 were significantly associated with rehospitalization for any cause within 1 year, while controlling for demographic and clinical variables, ie, age, sex, living with a significant other, CAD history, and diabetes comorbidity.
Erratic rhythm and rehospitalization
While research has established that HF power usually corresponds to the underlying parasympathetic modulation and respiratory sinus arrhythmia,27 recent findings suggest this may not always be the case.13,17,28 High NHF power in conjunction with low DFA1 in rehospitalized patients is consistent with the finding of erratic rhythm in relation to poorer outcomes, described by Stein et al.17 The presence of an erratic rhythm may misleadingly elevate values of short-term HRV indices, such as HF power.17
Cardiovascular Health Study (CHS) investigators examined autonomic predictors of cardiovascular death with 24-hour Holter monitoring in 1,429 volunteers;13 30% of the group had cardiovascular disease. In a subset of the CHS recordings, low NLF, LF/HF ratio, and high NHF were associated with low DFA1 and a high degree of disorganized heart rate patterns, as seen in Poincaré plots. CHS investigators found that decreased DFA1 had a strong relationship to 12-year mortality.13 In a study of coronary artery bypass graft patients, high SD12 on postoperative day 1 predicted myocardial ischemia on postoperative day 2 (P<0.01).16 Low DFA1 in conjunction with high SD12 may be present when heart rate patterns are irregular, and this beat-to-beat variability may not represent parasympathetic function.17,28 SD12 captures the scatter of the Poincaré plot by fitting an ellipse to the points of the plot (SD1 for the short axis, and SD2 for the long one). A normal Poincaré plot is comet or cigar shaped. A Poincaré plot of normal RR intervals that is associated with an erratic rhythm will be far more scattered (because of the jumps in N–N interval durations from one to the next), and as a result, SD1 will be bigger relative to SD2 when compared to a normal plot. This is reflected in the SD12 ratio. Our findings in ACS patients who were rehospitalized were comparable to the previous research,17,28 and could indicate that a high degree erratic rhythm was present.
1-year all-cause mortality
Our results indicated that abnormal HRV during the very early stages of ACS is prognostic of mortality. We found statistically significant associations with death and low SDANN, ULFlog, TPlog, and high SD12.
SDANN <53 ms was significantly associated with all-cause death. Relative risk of death was almost four times higher for patients with measures below, compared to those with measures above, that cut-point. In a study of cardiac resynchronization therapy’s effectiveness for improving HRV in 113 heart failure patients, Fantoni et al29 found that SDANN was the first measure to increase after therapy. Lack of a positive change in SDANN helped identify those who were at increased risk for adverse events, including hospitalization and cardiovascular death.29 In addition, SDANN and ULF correspond to each other mathematically,1 and low ULFlog has been significantly associated with mortality in prior research.4
In a 2-year multicenter study (Autonomic Tone and Reflexes After Myocardial Infarction),5 HRV was examined in 1,284 participants who had had an MI within the previous 28 days. SDNN<70 ms was significantly associated with higher mortality over 21 months compared to those with higher values.5 A meta-analysis by Buccelletti et al8 of 21 studies showed that in MI patients with SDNN <70 ms, risk of death was four times higher over 3 years compared to those with higher SDNN. In our study, low SDNN was associated with cardiac death and TP, which corresponds to SDNN,1 and which was significantly lower in all nonsurvivors. Patients with TPlog <8.4 ms2 had a relative risk of all-cause death nearly four times greater than those with higher values.
Our results were in accordance with Cardiac Arrhythmia Suppression Trial (CAST) investigators who found high SD12 was associated with mortality over a year (P=0.002).7
Identification of clinically relevant HRV variables
Many factors contribute to the complexity of ACS outcomes, as clinical practice guidelines for ACS management emphasize.11 We identified several HRV variables that, in conjunction with clinical factors, potentially could serve as useful tools in distinguishing groups of higher risk patients. Specifically, our analysis showed that NHF >42 ms2 and NLF <50 ms2, LF/HF <0.5, DFA1 <0.95, and SD12 >0.45 predicted rehospitalization in a multivariate model including sex, age, living situation, CAD history, and diabetes.
Previous research has provided evidence that HRV can be altered in conjunction with diabetes30 or heart disease.3–8,15–20 In particular, the presence of an interaction between NHF >42 ms2 and diabetes suggests that risk of adverse outcomes with one of these predictors may vary depending upon presence of the other, and risk is highest when both conditions are present. Early assessment of HRV in ACS may provide additional information to determine rehospitalization risk in ACS patients who have diabetes or CAD history. Additionally, our finding that patients with diabetes made up a large portion of patients readmitted to the hospital for noncardiac causes may lend support to the inclusion of all-cause outcomes during risk assessment.
Finally, we found that the identification of abnormal HRV, such as ULFlog >8 ms2, TPlog <8.4 ms2, or SDANN <54 ms, in conjunction with elevated troponin I, might aid in assessing the prognosis for MI patients. Filipovic et al31 demonstrated that elevated troponin postoperatively and decreased LF/HF ratio (<2) preoperatively were independent risk factors for 1-year mortality after noncardiac surgery in patients with a CAD history. While we found that low LF/HF was associated with rehospitalization, our results support the premise that HRV variables serve as indicators of increased risk.
Poincaré plots
Poincaré plots to aid in detecting low- versus high-risk patients could potentially serve as an adjunct tool.17,27 Huikuri et al15 used Poincaré plots to distinguish between abnormalities in post-MI patients with history of ventricular arrhythmia compared to a post-MI group without that history. After an episode of ventricular tachycardia induced via electrical stimulation, the researchers noted that the group in which ventricular tachycardia was provoked displayed abnormal patterns in the hour prior to development of the arrhythmia.15 We found that Poincaré plots of patients who were rehospitalized or who died varied from those who were event-free, and displayed patterns associated with poorer outcomes. The plots provided visual references and potentially useful illustrations (Figure 5).
Implications
HRV has become recognized as a reflection of cardiac autonomic modulation.2,32 Mechanisms behind the physiological interplay between the sympathetic and parasympathetic branches – along with the role of HRV patterns in prognostication of health and disease – warrant continuing investigation.
Practice standards recommend 24 hours of cardiac monitoring for ACS patients after ED presentation.33 Our Holter findings suggest that use of HRV measurements to assist in identifying patients at highest risk for adverse events might be a practical addition to continuous ECG monitoring.
Note, however, that our univariate analyses did not find therapies, such as beta blocker administration or percutaneous coronary intervention, to be significantly associated with the outcomes. The authors speculate that this might be due to the large percentage of patients who received beta blocker medication, including intravenous and oral administration, rendering the statistical analysis less than significant.22 Our findings are unlike the significant findings in previous studies related to these interventions.34,35 In a similar fashion, the continuous ECG recordings throughout the percutaneous coronary intervention procedures may have effectively muted the HRV results because abnormal HRV prior to the intervention could have been offset by the restored HRV afterward, even though improvement in HRV would not necessarily be immediate.35 Therefore, our statistical results do not reflect the clinical benefit that these therapies may provide.
Limitations
This was a retrospective analysis of data collected from 2002–2004, and practice standards have changed during the ensuing years. Only 193 of 279 ACS patients had sufficient ECG recording time and analyzable signals, reflecting potential challenges in obtaining accurate data for assessment. HF and LF power were measured in 5-minute segments and averaged over the entire recording time. While this method of computing frequency domain variables has been used by numerous researchers,13,14,17,21 others have described a brief 5-minute recording as simple and efficient.8 Clearly, it was not possible to control for all potentially confounding factors, including medication administration and interventional therapies. Follow up of patients in our study identified those who were readmitted to the hospital for a cardiac reason, and this was confirmed in the medical record whenever possible. However, the exact nature of the cardiac rehospitalization was not always available. Finally, conclusions about HRV in relation to mortality are tempered by low power.
Conclusion
There are a variety of HRV measurement methods, and previous investigators have suggested that the measurements could be complimentary.2 Our findings support the suggestion that there may not be one primary HRV variable associated with increased risk of rehospitalization or death. To serve as a useful tool, HRV needs to be assessed within the context of the patient’s whole clinical profile. Time domain, frequency domain, and nonlinear HRV in conjunction with clinical indicators hold potential for assisting in the risk stratification of ACS patient subgroups, such as those with diabetes or prior CAD. HRV measured close to ACS symptom onset could provide additional useful information to assess ACS patients’ risk of rehospitalization and/or death within 1 year of ED presentation.
Future directions
The urgent and immediate therapies that patients are provided with in the ED and intensive care unit make this a challenging environment within which to conduct research. Patients admitted to the ED may have a highly activated sympathetic response to their situation and environment. It is important to take these factors into consideration in studies that attempt to capture an accurate reflection of patients’ autonomic function.
Areas for future research might include studies to:
- Determine the effects on HRV of cardiac drug therapies, including route, dose, and type;
- Identify the impact of patients’ sympathetic response in the ED; and
- Examine the cost effectiveness of HRV measurements incorporated into routine cardiac monitoring of hospitalized ACS patients.
Disclosure
The authors report no conflicts of interest in this work.
References
Heart rate variability: standards of measurement, physiological interpretation and clinical use. Task Force of the European Society of Cardiology and the North American Society of Pacing and Electrophysiology. Circulation. 1996;93(5):1043–1065. | |
Lahiri MK, Kannankeril PJ, Goldberger JJ. Assessment of autonomic function in cardiovascular disease: physiological basis and prognostic implications. J Am Coll Cardiol. 2008;51(18):1725–1733. | |
Kleiger RE, Miller JP, Bigger JT, Moss AJ. Decreased heart rate variability and its association with increased mortality after acute myocardial infarction. Am J Cardiol. 1987;59(4):256–262. | |
Bigger JT Jr, Fleiss JL, Steinman RC, Rolnitzky LM, Kleiger RE, Rottman JN. Frequency domain measures of heart period variability and mortality after myocardial infarction. Circulation. 1992;85(1):164–171. | |
La Rovere MT, Bigger JT Jr, Marcus FI, Mortara A, Schwartz PJ. Baroreflex sensitivity and heart-rate variability in prediction of total cardiac mortality after myocardial infarction. ATRAMI (Autonomic Tone and Reflexes After Myocardial Infarction) Investigators. Lancet. 1998;351(9101):478–484. | |
Carpeggiani C, L’Abbate A, Landi P, et al. Early assessment of heart rate variability is predictive of in-hospital death and major complications after acute myocardial infarction. Int J Cardiol. 2004;96(3):361–368. | |
Stein PK, Domitrovich PP, Huikuri HV, Kleiger RE; Cast Investigators. Traditional and nonlinear heart rate variability are each independently associated with mortality after myocardial infarction. J Cardiovasc Electrophysiol. 2005;16(1):13–20. | |
Buccelletti E, Gilardi E, Scaini E, et al. Heart rate variability and myocardial infarction: systematic literature review and metanalysis. Eur Rev Med Pharmacol Sci. 2009;13(4):299–307. | |
Shusterman V, Goldberg A, Schindler, DM, Fleischmann KE, Lux RL, Drew BJ. Dynamic tracking of ischemia in the surface electrocariogram. J Electrocardiol. 40;2007;S179–S186. | |
World Health Organization. The WHO Family of International Classifications. World Health Organization. Available from: http://www.who.int/classifications/en/. Accessed June 2, 2014. | |
Wright RS, Anderson JL, Adams CD, et al. 2011 ACCF/AHA focused update of the Guidelines for the Management of Patients with Unstable Angina/Non-ST-Elevation Myocardial Infarction (updating the 2007 guideline): a report of the American College of Cardiology Foundation/American Heart Association Task Force on Practice Guidelines developed in collaboration with the American College of Emergency Physicians, Society for Cardiovascular Angiography and Interventions, and Society of Thoracic Surgeons. J Am Coll Cardiol. 2011;57(19):1920–1959. | |
Tulppo MP, Kiviniemi AM, Hautala AJ, et al. Physiological background of the loss of fractal heart rate dynamics. Circulation. 2005;112(3):314–319. | |
Stein PK, Barzilay JI, Chaves PH, et al. Novel measures of heart rate variability predict cardiovascular mortality in older adults independent of traditional cardiovascular risk factors: the Cardiovascular Health Study (CHS). J Cardiovasc Electrophysiol. 2008;19(11):1169–1174. | |
Mäkikallio TH, Huikuri HV, Mäkikallio A, et al. Prediction of sudden cardiac death by fractal analysis of heart rate variability in elderly subjects. J Am Coll Cardiol. 2001;37(5):1395–1402. | |
Huikuri HV, Seppänen T, Koistinen MJ, et al. Abnormalities in beat-to-beat dynamics of heart rate before the spontaneous onset of life-threatening ventricular tachyarrhythmias in patients with prior myocardial infarction. Circulation. 1996;93(10):1836–1844. | |
Laitio TT, Mäkikallio TH, Huikuri HV, et al. Relation of heart rate dynamics to the occurrence of myocardial ischemia after coronary artery bypass grafting. Am J Cardiol. 2002;89(10):1176–1181. | |
Stein PK, Le Q, Domitrovich PP; CAST Investigators. Development of more erratic heart rate patterns is associated with mortality post-myocardial infarction. J Electrocardiol. 2008;41(2):110–115. | |
Casolo GC, Stroder P, Signorini C, et al. Heart rate variability during the acute phase of myocardial infarction. Circulation. 1992;85(6):2073–2079. | |
Luria MH, Sapoznikov D, Gilon D, et al. Early heart rate variability alterations after acute myocardial infarction. Am Heart J. 1993;125(3):676–681. | |
Singh N, Mironov D, Armstrong PW, Ross AM, Langer A. Heart rate variability assessment early after acute myocardial infarction. Pathophysiological and prognostic correlates. GUSTO ECG Substudy Investigators. Global Utilization of Streptokinase and TPA for Occluded Arteries. Circulation. 1996;93(7):1388–1395. | |
Tsuji H, Larson MG, Venditti FJ, et al. Impact of reduced heart rate variability on risk for cardiac events. The Framingham Heart Study. Circulation. 1996;94(11):2850–2855. | |
Stayerberg EW. Bootstrap resampling. In: Clinical Prediction Models. Rotterdam, The Netherlands: Springer; 2009:92–97. | |
Antman EM, Anbe DT, Armstrong PW, et al; American College of Cardiology/American Heart Association Task Force on Practice Guidelines (Writing Committee to Revise the 1999 Guidelines for the Management of Patients with Acute Myocardial Infarction). ACC/AHA guidelines for the management of patients with ST-elevation myocardial infarction – executive summary: a report of the American College of Cardiology/American Heart Association Task Force on Practice Guidelines (Writing Committee to Revise the 1999 Guidelines for the Management of Patients With Acute Myocardial Infarction). Circulation. 2004;110(5):588–636. Erratum in: Circulation. 2005;111(15):2013. | |
Huang J, Sopher SM, Leatham E, Redwood S, Camm AJ, Kaski JC. Heart rate variability depression in patients with unstable angina. Am Heart J. 1995;130(4):772–779. | |
Lanza GA, Cianflone D, Rebuzzi AG, et al; Stratificazione Prognostica dell’Angina Instabile Study Investigators. Prognostic value of ventricular arrhythmias and heart rate variability in patients with unstable angina. Heart. 2006;92(8):1055–1063. | |
Johnston SS, Curkendall S, Makenbaeva D, et al. The direct and indirect cost burden of acute coronary syndrome. J Occup Environ Med. 2011;53(1):2–7. | |
Yasuma F, Hayano J. Respiratory sinus arrhythmia: why does the heartbeat synchronize with respiratory rhythm? Chest. 2004;125(2):683–690. | |
Stein PK, Domitrovich PP, Hui N, Rautaharju P, Gottdiener J. Sometimes higher heart rate variability is not better heart rate variability: results of graphical and nonlinear analyses. J Cardiovasc Electrophysiol. 2005;16(9):954–959. | |
Fantoni C, Raffa S, Regoli F, et al. Cardiac resynchronization therapy improves heart rate profile and heart rate variability of patients with moderate to severe heart failure. J Am Coll Cardiol. 2005;46(10):1875–1882. | |
Schroeder EB, Chambless LE, Liao D, et al; Atherosclerosis Risk in Communities (ARIC) study. Diabetes, glucose, insulin, and heart rate variability: the Atherosclerosis Risk in Communities (ARIC) study. Diabetes Care. 2005;28(3):668–674. | |
Filipovic M, Jeger R, Probst C, et al. Heart rate variability and cardiac troponin I are incremental and independent predictors of one-year all-cause mortality after major noncardiac surgery in patients at risk of coronary artery disease. J Am Coll Cardiol. 2003;42(10):1767–1776. | |
Lombardi F, Stein PK. Origin of heart rate variability and turbulence: an appraisal of autonomic modulation of cardiovascular function. Front Physiol. 2011;2:95. | |
Drew BJ, Califf RM, Funk M, et al; American Heart Association. AHA scientific statement: practice standards for electrocardiographic monitoring in hospital settings: an American Heart Association Scientific Statement from the Councils on Cardiovascular Nursing, Clinical Cardiology, and Cardiovascular Disease in the Young: endorsed by the International Society of Computerized electrocardiology and the American Association of Critical-Care Nurses. J Cardiovasc Nurs. 2005;20(2):76–106. | |
Sandrone G, Mortara A, Torzillo D, La Rovere MT, Malliani A, Lombardi F. Effects of beta blockers (atenolol or metoprolol) on heart rate variability after acute myocardial infarction. Am J Cardiol. 1994;74(4):340–345. | |
Santangeli P, Lamendola P, Larosa C, et al. Effect of primary coronary intervention on heart rate variability and left ventricular function in patients with acute myocardial infarction. Minerva Cardioangiol. 2007;55(6):703–710. |
 © 2014 The Author(s). This work is published and licensed by Dove Medical Press Limited. The full terms of this license are available at https://www.dovepress.com/terms.php and incorporate the Creative Commons Attribution - Non Commercial (unported, v3.0) License.
By accessing the work you hereby accept the Terms. Non-commercial uses of the work are permitted without any further permission from Dove Medical Press Limited, provided the work is properly attributed. For permission for commercial use of this work, please see paragraphs 4.2 and 5 of our Terms.
© 2014 The Author(s). This work is published and licensed by Dove Medical Press Limited. The full terms of this license are available at https://www.dovepress.com/terms.php and incorporate the Creative Commons Attribution - Non Commercial (unported, v3.0) License.
By accessing the work you hereby accept the Terms. Non-commercial uses of the work are permitted without any further permission from Dove Medical Press Limited, provided the work is properly attributed. For permission for commercial use of this work, please see paragraphs 4.2 and 5 of our Terms.