")
Back to Journals » ClinicoEconomics and Outcomes Research » Volume 7
Health services financing and delivery: analysis of policy options for Dubai, United Arab Emirates
Authors Hamidi S
Received 13 October 2014
Accepted for publication 24 November 2014
Published 25 February 2015 Volume 2015:7 Pages 133—143
DOI https://doi.org/10.2147/CEOR.S75743
Checked for plagiarism Yes
Review by Single anonymous peer review
Peer reviewer comments 4
Editor who approved publication: Professor Giorgio L Colombo
Samer Hamidi
School of Health and Environmental Studies, Hamdan Bin Mohammed Smart University, Dubai, United Arab Emirates
Introduction: A national health account (NHA) provides a systematic approach to mapping the flow of health sector funds within a specified health system over a defined time period. This article attempts to present a profile of health system financing in Dubai, United Arab Emirates using data from NHAs, and to compare the functional structures of financing schemes in Dubai with schemes in Qatar and selected member countries of the Organization for Economic Cooperation and Development (OECD).
Methods: The author analyzed secondary data published in NHAs of Dubai and Qatar and data collected by the OECD countries and publicly available from Eurostat (Statistical Office of the European Union) of 25 OECD countries for comparative analysis. All health financing indicators used were as defined in the international System of Health Accounts (SHA).
Results: In Dubai, spending on inpatient care was the highest-costing component, with 30% of current health expenditures (CHE). Spending on outpatient care was the second highest-costing component and accounted for about 23% of the CHE. Household spending accounted for about 22% of CHE (equivalent to US$187 per capita), compared to an average of 20% of CHE of OECD countries. Dubai spent 0.02% of CHE on long-term care, compared to an average of 11% of CHE of OECD countries. Dubai spent about 6% of CHE on prevention and public health services, compared to an average of 3.2% of CHE of OECD countries.
Conclusion: The findings point to potential opportunities for growth and improvement in several health policy issues in Dubai, including increasing focus and funding of preventive services; shifting from inpatient care to day surgery, outpatient, and home-based services and strengthening long-term care; and introducing cost-containment measures for pharmaceuticals. More investment in the translation of NHA data into policy is suggested for future researchers.
Keywords: health finance schemes, health delivery, health policy
Introduction
Dubai is the second largest emirate in the United Arab Emirates (UAE), with an area of 4,114 km2. In 2013, the population of the emirate of Dubai was an estimated 2.2 million (24% females and 76% males). UAE nationals constitute approximately 12% of the total population, and expatriates constitute about 88% of the total population. The population doubles every 14 years with a natural increase rate of 1.3% per annum.1 The Dubai health system manages to cater to the rapid increase in population, which is concurrent with increasing demands for health care, despite suffering from a structural deficit in health care infrastructure, human resources, and delivery. The availability of health resources is low in Dubai by Organization for Economic Cooperation and Development (OECD) standards, and, in virtually all dimensions for which data are available, Dubai lies well below the average of OECD countries. While the number of physicians per capita increased substantially in Dubai over the past 2 decades, reaching 27 per 10,000 people, it remains well below the average of 32 in OECD countries. There were 56 nurses per 10,000 people in Dubai in 2012, much less than the average of 87 in OECD countries. The total bed capacity in Dubai was 3,815 beds in 2013, which can be translated into 19 beds per 10,000 people – well below the average of 48 beds in OECD countries.2
The Ministry of Health (MOH), which represents the federal government, and the Dubai Health Authority (DHA), which represents the local government, govern the health sector in Dubai. However, health services are delivered by MOH, DHA, and private facilities, including Dubai Healthcare City (DHCC). DHA owns four hospitals, with a capacity of 2,063 beds, and 14 primary health care centers (PHCs). MOH owns two hospitals, with a capacity of 284 beds, and nine PHCs in Dubai. The private sector comprises 22 hospitals, with a capacity of 1,468 beds, and over 1,000 outpatient clinics and polyclinics. About 95% of hospital beds in DHA achieve international Joint Commission International (JCI) accreditation. Table 1 summarizes selected health utilization indicators by provider in Dubai in 2012.
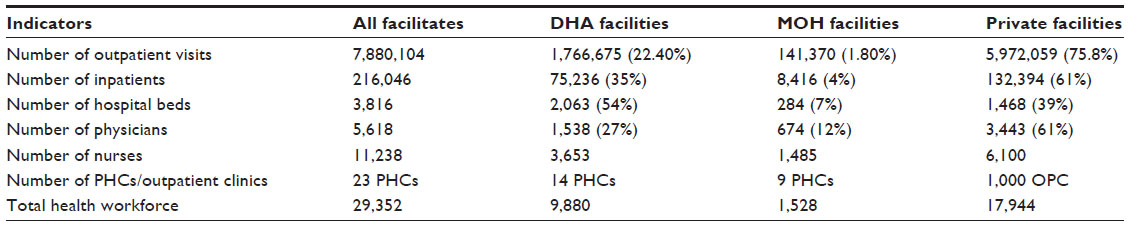 | Table 1 Selected health utilization indicators by provider in Dubai in 2012 |
Study objectives
Governments throughout the world have been under increasing pressure to improve their provision of health care services while seeking to employ scarce resources effectively. In fact, better understanding of relative differences in financing of health services will help guide policymakers as to how best to deliver them. Dubai released its first national health account (NHA) in 2014 utilizing data from 2012. The time of release of the NHA is very important, because Dubai is undergoing major developments based on the recent Health Insurance Law, whereby a mandatory insurance scheme is to be fully effected by 2016 to achieve universal coverage. Timely data can be used to evaluate current and future health policies related to overall spending and utilization of health services. The analysis of current expenditure patterns is crucial, and there are few published studies analyzing and describing the patterns of financing and utilization of health services in Dubai. The aim of this study is to describe the financing mechanisms and expenditures for various health functions provided in Dubai, specifically curative care, out-of-pocket payments, medical goods, and preventive health services, and to determine policy issues from the published NHAs by comparing Dubai with Qatar and 25 OECD countries.
Methodology
The study is based on processing of statistical information and comparative analysis of data related to health financing in Dubai, Qatar, and 25 OECD countries. Dubai was chosen instead of the UAE, because Dubai published its own NHA and because the information is not available for the UAE. Qatar was chosen because it has the same demographic and socioeconomic context as Dubai, and it is the only country in the Arabian Gulf that published its NHA. Twenty-five OECD countries were included in the analysis, comprising Japan, France, Germany, the United States of America, Sweden, Switzerland, Austria, Belgium, Canada, the Czech Republic, Denmark, Estonia, Finland, Hungary, Iceland, South Korea, the Netherlands, New Zealand, Norway, Poland, Portugal, the Slovak Republic, Slovenia, Spain, and Luxembourg. These countries were chosen because they are wealthy, have been relatively well studied, have relatively accurate and complete data, and represent an interesting variety of different models of health care systems. Data collected and used were as follows:
- Secondary data collected by DHA and published in Dubai’s first National Health Account Report 2012.3
- Secondary data collected by the Supreme Council of Health in Qatar and published in the National Health Account Report 2012.4
- Secondary data collected by the OECD countries and available publicly from Eurostat (Statistical Office of the European Union).5
The System of Health Accounts (SHA) is an internationally recognized methodology that tracks all health spending in a given country over a defined period of time to generate consistent and comprehensive data on health spending in a country, which, in turn, can contribute to evidence-based policymaking in the country (WHO, 2011). It was developed by the World Health Organization (WHO) in collaboration with the OECD and Eurostat.6 All measures used for the 26 countries included in this study and Dubai formed the primary base of information and were based on classifications derived from the SHA to allow for cross-national comparisons.7 Functional and provider structures of financing schemes are an integral part of the NHAs. Included databases were classified according to the following four dimensions:
- Financing sources: entities that provide health funds.
- Financing agents: entities that receive funds from financing sources and use them to pay for health services, products, and activities. This category accounts for those entities authorized to manage and organize funds.
- Providers: entities responsible for delivering health services.
- Functions: goods, services, or activities that providers deliver to beneficiaries.
Results
Dubai’s first NHA in 2012 provided a comprehensive overview of health spending and answered questions regarding functional and provider structures of financing schemes and allocation of financial resources. This section will discuss health expenditures by health function. Total health expenditures (THE), which consists of current health expenditures (CHE) and capital formation, is no longer included in NHAs this was decided based on recommendations from SHA 2011, and CHE are included instead.7 CHE includes all expenses on health services but excludes investments and exports. THE in Dubai was 10.8 billion United Arab Emirates Dirham (AED) in 2012, equivalent to 3.4% of gross domestic product, which is at more than 6% points lower than the average of OECD of 9.3%. The CHE constituted about 92% of THE, equivalent to 9.9 billion AED, and capital formation constitutes about 8%, equivalent to 867 million AED.
There are four main financing schemes in Dubai. The federal and local governments funded 33% of CHE and pooled 38% of CHE via local and governmental schemes; employers funded and pooled 36% of CHE via private health insurance; households funded and pooled about 22% of CHE; and corporations funded about 9% of CHE and pooled about 4% of CHE via enterprise financing schemes, as shown in Figure 1. Health functions are the services delivered by providers and include curative (inpatient, day care, and outpatient) and rehabilitative services, long-term care, ancillary services, medical goods, prevention and public health services, and health administration and governance services. Curative services, ancillary services, medical goods, and preventive services accounted for 55%, 14%, 20%, and 6% of CHE in 2012, respectively. Figure 1 shows the detailed flow of money per health function.
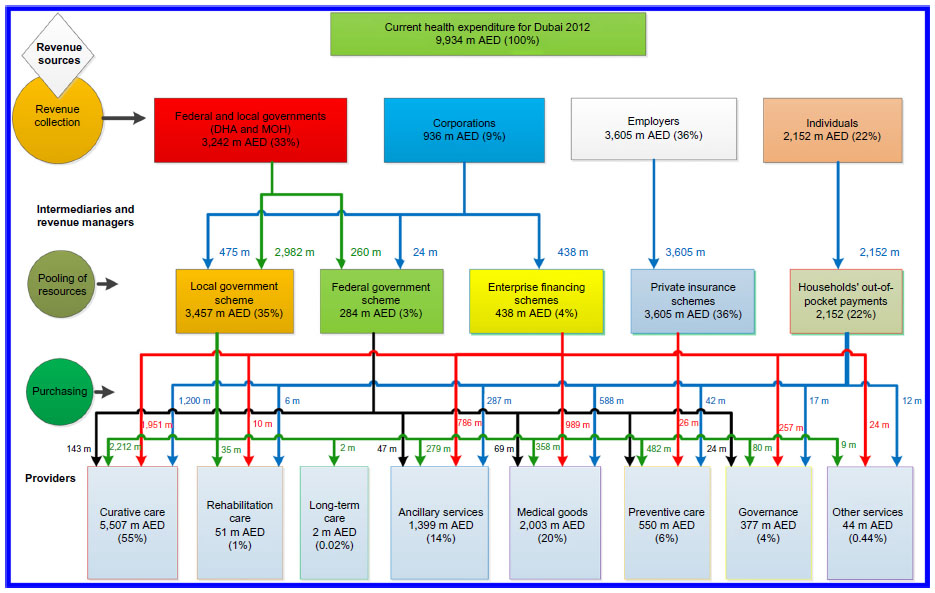 | Figure 1 Flow of money per health function for Dubai in 2012. |
Curative services
Data for spending on health functions show that curative services account for the most spending on health, at about 55% of CHE. Inpatient, day care, and outpatient services accounted for 30%, 2%, and 23% of CHE in 2012, respectively. The major contributor to spending on curative services is the local government (40%), followed by voluntary insurance (35%) and households (22%), while 3% is paid by the federal government. About 64% of CHE spent on curative services was spent by hospitals (78% of inpatient care, 83% of curative day care, and 45% of outpatient curative services), and 20% by providers of ambulatory health care (5% of curative day care and 47% of curative outpatient care). Table 2 shows the health function structure by financing schemes.
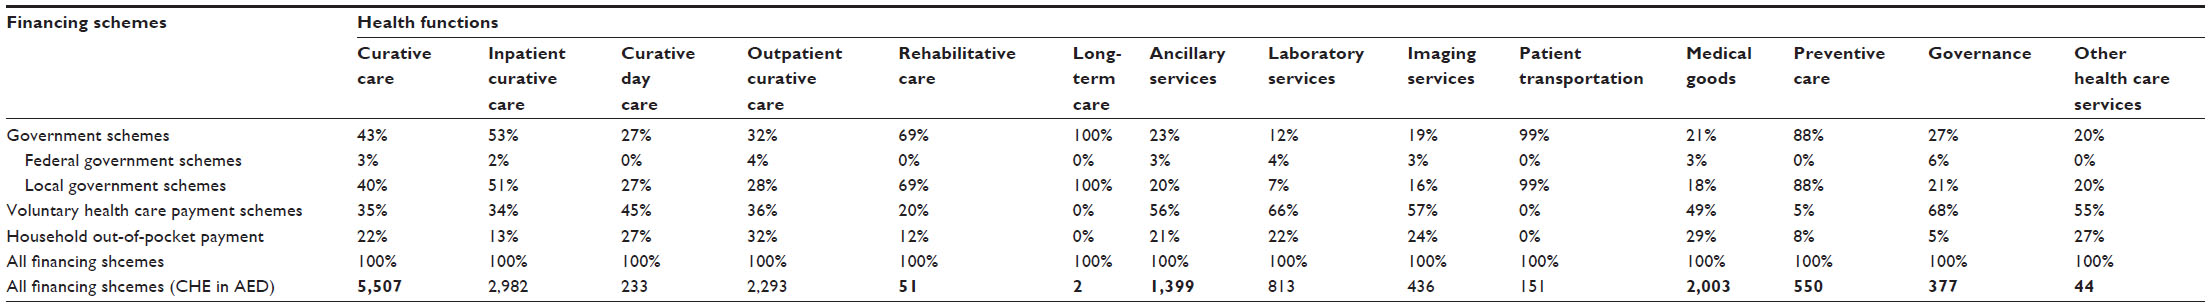 | Table 2 Health function structure by financing schemes |
Inpatient services
In 2012, 61% of inpatient visits in Dubai were done in the private health sector. The average monthly inpatient admission was about 18,119 inpatients and about two-thirds of visits provided by private hospitals. Spending on inpatient care was the highest-costing component for Dubai, at 30% of CHE, compared to an average of 29% of CHE of OECD27.8 The numbers presented here are for comparative analysis, because health care providers may not necessarily perform the same set of activities.
Day care services
Spending on curative day care services is about 2% of CHE, which is above the average of 1.8% of CHE of 19 OECD countries but lower than that of France and Canada. Figure 2 shows the percentage of spending on day care as percentage of CHE for Dubai and selected countries.
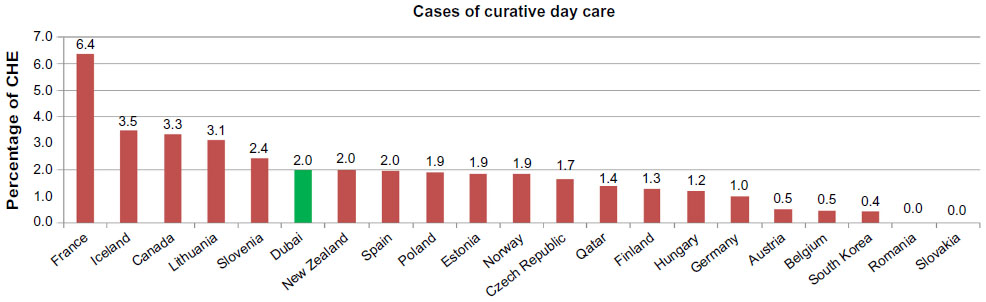 | Figure 2 Spending on day care as percentage of current health expenditures (CHE) for Dubai (2012) and selected countries (2011). |
Outpatient services
The private sector also dominated the delivery of outpatient services, with 76% of all outpatient visits in Dubai in 2012. There were about 3.8 physician consultations in Dubai per capita, compared to 6.3 in OECD countries. This translates to an average of 16 daily visits per 1,000 people, 251 daily visits per PHC, and 17 daily visits per PHC physician.2 Spending on outpatient care was the second highest-costing component and accounted for about 23% of CHE. For comparison purposes, spending on ancillary services was added to spending on outpatient care to enable comparison with OECD countries. The percentage of spending out of CHE of outpatient care is 33% (OECD, 2013). For most countries, and Dubai, the results reveal that the share of outpatient care (including the ancillary services) consumes a higher share of CHE than inpatient care, which is the opposite of what is usually expected. Figure 3 shows the share of health function structure as percentage of CHE of selected countries (2011) and Dubai (2012).
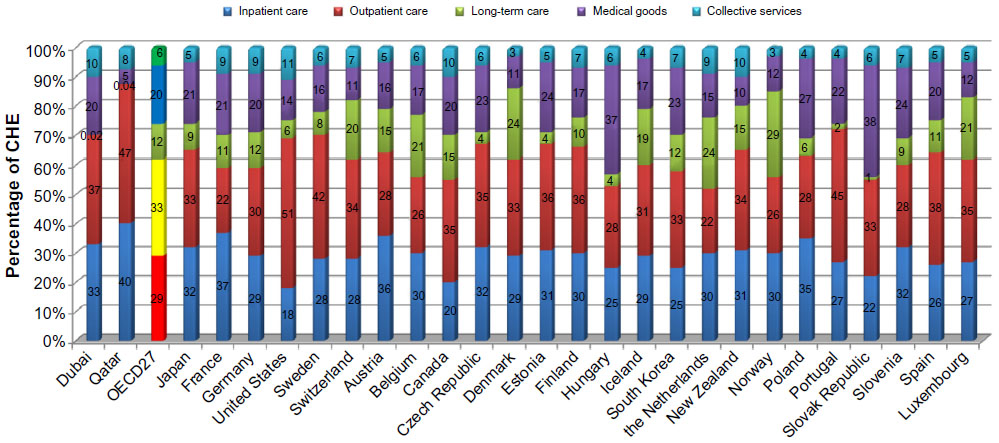 | Figure 3 Share of functional structure as percentage of current health expenditures of selected countries (2011) and Dubai (2012). |
Rehabilitation services
Without relevance in the functional structure is the rehabilitative care which had a share of 1% of CHE. The major contributor to spending on rehabilitation services was the local government (69%), followed by voluntary insurance (20%), with 12% paid by households. About 75% of CHE spent on rehabilitation services were spent in hospitals, and 22% were spent in ambulatory health care facilities.
Long-term care
The proportion of CHE reported to have been spent on long-term nursing care displays a striking range, from less than 1% in Dubai to 4% in Hungary, to 24% in Denmark, and 27% in Norway. Dubai spent 0.02% of CHE (2 million AED) on long-term care, compared to 11% for OECD countries. Figure 4 shows spending on long-term care for OECD countries (average for 2003–2011) and Dubai (2012) as percentage of CHE.
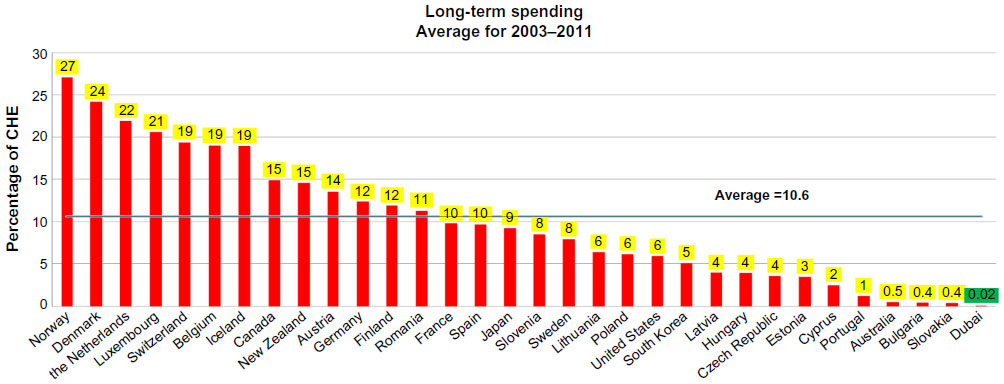 | Figure 4 Spending on long-term care for OECD countries (average for 2003–2011) and Dubai (2012) as percentage of current health expenditures (CHE). |
Ancillary services
Ancillary services accounted for 14% of the CHE. The major contributor to spending on ancillary services is voluntary insurance (56%), followed by households (21%), then local government (20%) and federal government (3%). About 35% of CHE spent on ancillary services were spent in hospitals (35% to laboratory services and 47% to imaging services), 24% was spent by providers of ambulatory health care (30% was spent on laboratory services and 19% was spent on imaging services), and 26% was spent by providers of ancillary services (17% was spent on laboratory services and 18% was spent on imaging services).
Medical goods
The results also show the importance of medical goods, with 20% of CHE were spent on medical goods. There is a significant degree of variation among countries, with the lowest share, of 11.5% of CHE, reported in Denmark, rising to 37% of CHE in Bulgaria, 37% of CHE in Slovakia, and 37.7% of CHE in Hungary. As shown in Table 2, the major contributor to spending on medical goods is voluntary insurance (49%), followed by households (29%), then local government (18%) and federal government (3%). About 32% of CHE spent on medical goods were spent in hospitals, 14% was spent by providers of ambulatory health care facilities, and 37% was spent by retailers and providers of medical goods.
Preventive services
About 88% of CHE spent on preventive services is funded by local government, followed by households (8%), then voluntary insurance (5%). About 3.5% of CHE spent on preventive services were spent in hospitals, 89% was spent by providers of ambulatory health care facilities, and 6% was spent by providers of preventive care. Dubai spent about 6% of CHE on prevention and public health programs, compared to 3.2% for 25 OECD countries (Figure 5). Only New Zealand, Canada, and Romania spent a greater proportion of CHE than Dubai. Expenditure related to prevention and public health programs exhibited large discrepancies among OECD countries, ranging from less than 1% to 7%, with 0.4% for Qatar.4,8 Figure 5 shows spending on preventive and public health services as percentage of CHE for Dubai (2012) in comparison to 26 selected countries (2011).
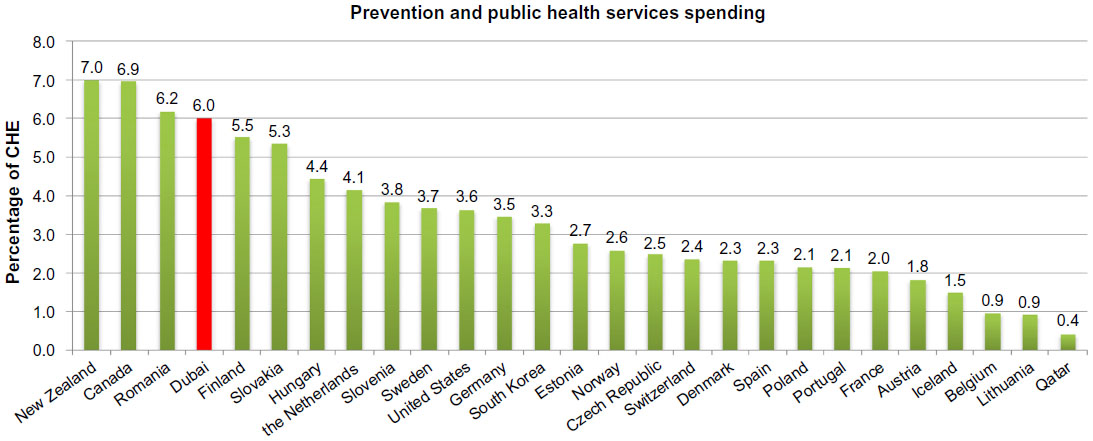 | Figure 5 Spending on preventive and public health services as percentage of current health expenditures (CHE) for Dubai (2012) in comparison to 26 selected countries (2011). |
Health administration and governance
Dubai spent 4% of CHE (377 million AED) on health administration. This is generally higher than those OECD countries where private insurance plays a relatively restricted role, with about 1.5% of CHE in Bulgaria, Denmark, Hungary, Poland, and Sweden, but it is lower than those OECD countries with centralized social security systems, such as Germany (5.5%) and France (7%). The major contributor to spending on health services administration is voluntary insurance (68%), followed by local government (21%), federal government (6%), and households (5%).
Discussion
Many critical issues are apparent from the results in terms of spending on preventive services, inpatient services, long-term care, and pharmaceuticals. This section will discuss each of these separately. Comparison of health expenditures between Dubai and OECD countries cannot show whether a particular level of expenditure is appropriate; however, it is useful for pointing out certain general patterns in spending, and will reflect specific circumstances, societal values, and solutions of Dubai and each of the countries. For example, spending on various health functions is influenced by the availability of a health workforce, hospital beds, and medical technology, as well as the financial and institutional arrangements.6 Also, demographic factors vary significantly among countries, given that some countries have high life expectancies and relatively old populations and there is therefore a need to spend more on older people, whose health costs are the highest per capita. The converse is true of countries with younger populations.9 These factors will be taken into account in our discussion.
Preventive services
Preventive services are designed to enhance the health status of the population and are distinct from curative services, which repair health dysfunction.10 Typical preventive services include counseling, screening, vaccinations, blood pressure measurement, basic tests for blood cholesterol, and blood glucose measurement. Dubai spent about 6% of CHE on preventive services, which can be considered quite reasonable. About 88% of expenditures spent on preventive services are funded by local government. The private sector is unwilling to invest in preventive programs, since the majority of the population in Dubai is transient. The percentage of CHE spent on preventive services in OECD countries (3.2%) may be underestimated, because the time and resources spent on these services are usually counted under curative services, seeing as they are provided in inpatient and outpatient settings. There is variability, and even a slight negative correlation (r=−0.22), between percentage of CHE spent on preventive services and national income levels for the 26 countries and Dubai, indicating that income convergence was not a key factor. Spending on preventive services is related mainly to resource allocation and planning.
Currently, the emphasis has shifted toward cost-effective delivery of health care, which implies attaining equilibrium between curative and preventive care through reinforcing primary care services.11 There is little doubt that emphasis on curative care is not as cost-effective as focusing on relatively inexpensive preventive services, and that evidence-based clinical preventive services offer high economic value. It has been shown that investing in a well-defined package of preventive services is effective in preventing disease and offers very good economic value.12 In fact, WHO has identified “best buy” interventions that are very cost-effective but also feasible, low-cost, and appropriate to implement within the constraints local health systems. Very cost-effective intervention will save 1 year of healthy life for less than the average annual income per person.
It is therefore suggested that deliberate efforts be taken to shift resources from curative to preventive services. A sustained and coordinated effort on health prevention and promotion is needed in Dubai through defining national broad-based policies for prevention to address major chronic disease risk factors, such as obesity and physical inactivity. Lifestyle changes today signal the rise of health risks within the population in the future, and addressing smoking (particularly among males) and physical inactivity (particularly among females) will facilitate sustainable primary prevention of noncommunicable diseases (NCDs) in Dubai13 The recently introduced smoking ban and breast cancer screening are two of a few major prevention policies that have been implemented. This is a comparatively small development compared with those achieved in many OECD countries in recent years.
Inpatient services
In Dubai, spending on inpatient services was the highest-costing component, at 30% of CHE. Inpatient care is highly labor-intensive and expensive. Dubai should reduce the share of spending on inpatient services by moving in favor of more day surgery, outpatient care, or home-based care and reforming the hospital payment mechanisms. This will reduce the total cost as well as the average length of stay (ALOS) in hospitals.14
The growth in various health functions reflects, in part, the relative stage of development of a health system. For example, low-income OECD countries seeking to expand their health systems have generally seen increases in spending on hospital inpatient care outpace other areas of spending, such that it has been the main contributor to overall health expenditure growth.6 Dubai ranks the highest after Qatar in terms of share of capital formation, as it spends 8% of THE, which is more than double the average of 3.7% of THE of the OECD countries, which indicates huge investments made in hospital and curative services. On the other hand, certain high-income countries sought to reduce the share of spending in hospitals in favor of more day surgery, outpatient care, or home-based care.6 The bed space in all OECD countries substantially reduced from 1985 onward.15 The number of hospital beds per capita has decreased at least slightly over the past decade in most OECD countries, falling from 56 per 10,000 people in 2000 to 50 per 10,000 in 2011.8 The lowest-ranking countries in OECD are UK and Sweden, with 28 and 27 hospital beds per 10,000 inhabitants, respectively. More day case discharges became feasible in OECD countries, mainly due to changes in medical technology, allowing for faster recovery of patients and allowing for shorter stays at hospitals.6
The ALOS in Dubai is about 4.9 days (ranging from 4 days in the DHA to 6 days in the private sector), compared to 6.3 days in OECD countries, for all causes. Medical progress and changes in payment systems reduced ALOS in acute care hospitals in OECD from 7.6 to 6.3 days per patient throughout 2003 to 2010.16 However, reduction of 1 day in the overall ALOS in Dubai could free up approximately 216,000 hospital bed-days, allowing an additional 54,400 inpatients to be treated per year, corresponding to a 25% increase in overall capacity. At the same time, too-short stays may increase the cost, because these tend to be more service-intensive and may increase the readmission rate.6 Although, overall, ALOS in Dubai is 2.3 days less than OECD countries per patient on average, this is not considered an indicator of efficiency, because ALOS is used as an indicator of efficiency when it is linked with diagnosis-related groups. The lower ALOS in Dubai is attributed partially to the fewer complex comorbid conditions, as the population in Dubai is younger. Dubai has a very youthful population, which has different health needs than other, older populations. About 70% of the population is men of working age, and only less than 1% of the population are aged over 65 years. Furthermore, a high percentage of those having severe medical conditions usually seek treatment abroad.
The payment methods for hospitals also play a major role in this shift. The way hospitals are currently organized and financed encourages excessive hospital utilization. Hospitals in Dubai are reimbursed using fee-for-service payment arrangements, which reward hospitals for doing more and provide weak incentives for cost containment.
Long-term care
Long-term care in Dubai is funded totally by the local governmental scheme. The proportion of CHE reported to be spent on long-term care displays a striking range, from less than 1% in Dubai to 27% in Norway. Some of the variation in spending on long-term care among different countries may be attributed to overestimation or underestimation in some countries. For example, the high share in Denmark reflects an overestimation, since it includes expenditure on accommodation in all nursing and residential facilities for the elderly, not only in nursing homes; the low share in Hungary is partly due to the greater role of informal care by private households and to the lack of data sources concerning the services provided in the social care sector.17
Medical goods and pharmaceuticals
Medical goods consumed 20% (2,003 million AED) of the CHE in 2012. Households contribute about 29% of expenditures on medical goods (588 million AED), of which about 86% (508 million AED) is spent in the retail sector. Household spending on medical goods (508 million AED) constitutes about 68% of the total amount of money spent in the retail sector (745 million AED), indicating both relatively high volumes of consumption and high cost. Patients pay very high prices for medicines when purchased from private retail pharmacies in the UAE, and the originator brands were found to be 23.5 times higher than the international reference price (WHO, 2010).18 Nevertheless, generics still only account for 15% of the pharmaceutical market,19 which is a significantly lower percentage than in many other countries. This spending pattern is likely due to self-prescribing practices and over-prescription of pharmaceuticals by providers, indicating that patients often demand medication that is not clinically indicated and ask private pharmacies to prescribe it. Globally, 20%–40% of human and financial resources spent on health are wasted.20 Common causes of inefficiency include demotivated health workers, duplication of services, and inappropriate use or overuse of medicines and technologies. By far, this indicates the need to control health spending in the pharmaceutical sector and to monitor use of medicines in retail pharmacies.
In the past 6 years, the UAE federal government has taken steps to reduce the relatively high prices of patented drugs and to boost generic markets, with some success. MOH managed to reduce the prices of medicines after the talks to unify branded medicine prices across the Gulf Cooperation Council states. Currently, prices of patented medicines are more in line with those of comparator countries than they used to be.
Conclusion and recommendations
The findings of this study point to potential opportunities for growth and improvement in several health policy issues, including increasing focus and funding of preventive services; shifting from inpatient care to day surgery, outpatient, and home-based services and strengthening long-term care; and introducing cost-containment measures for pharmaceuticals. The policy considerations are discussed below.
Shift spending from curative to preventive service
In Dubai, about 55% of CHE was spent on curative services, compared to 6% of CHE spent on preventive services. For example, most spending on diabetes in Dubai is used to manage and treat the complications of diabetes, yet we know that early detection and community management are more cost-effective. Given the potential to contain the burden and cost of disease in the long term, the importance given to disease prevention and health promotion should be reassessed. Reorientation of the health system toward prevention and management of several risk factors, counseling, and patient self-management is needed. According to a review commissioned by WHO in 2009, most essential care (80%) and most desirable health interventions (70%) can be delivered at the primary care level.21 WHO has also identified a number of best buys for NCD prevention, including detection and treatment of those at high risk of a heart attack through, for example, early detection and treatment of high blood pressure.22 A more balanced allocation of resources will ensure better value for money spent on services. Dubai should invest more in preventive services, build a model based on primary care, and reallocate expenditures from curative services to prevention and primary health care. Building new clinics in community settings is not the only way to increase primary care services. There are many policy tools that administrators may consider that do not involve capital builds, so no reallocation of budget toward capital formation is needed. In fact, with an appropriately qualified and trained workforce, frequently used health settings can also be used to provide selected interventions for NCDs. It is recommended to provide trained, skill-mixed teams and physicians who can deliver preventive care and effective treatment at the primary care level, which will facilitate adoption of the family practice model. The role of the private sector in realizing the equilibrium between curative and preventive care is very important and should be well defined. As things stand now, provision of curative health care is mostly left in the hands of private suppliers, while preventive health care is mainly provided by the government.23 This should change in order to reorient the whole health system from curative care to proactively promoting good health.
Shift spending from inpatient to day care, outpatient, and home-based services
Spending on inpatient services was the highest-costing component of CHE in Dubai. More care is often not better care, and inpatient care is highly labor-intensive and expensive. Reorientation of the health system is needed in terms of reducing the share of spending on inpatient services and moving in favor of day surgery, outpatient, and home-based services. This will reduce the total cost as well as the ALOS in hospitals. ALOS is used as an indicator of efficiency when it is linked with diagnosis-related groups, and it is recommended that this be reported in the annual health report published by DHA, besides reporting the overall ALOS. Reforming hospital payment mechanisms will influence incentives and behaviors of both patients and providers. Financing reforms by means of introducing new provider payment mechanisms hold the potential to reduce the utilization of hospitals in Dubai. For example, introduction of case-mix financing to hospital efficiency will provide an incentive to reduce costs and focus on those services in which certain hospitals are most efficient.
Strengthen long-term care
Dubai ranks the lowest in terms of spending on long-term care compared to OECD countries. This may be attributed partially to the demographic structure of the young population, of which less than 1% is aged over 65 years. This is also attributed to the dominance of the hospital sector and inpatient services. There is a need to introduce a wide spectrum of health facilities to accommodate the needs of the population in a cost-effective way. Long-term care is crucial in this shift.
Introduce cost-containment measures for pharmaceuticals
Further reforms could help Dubai increase the value for money of pharmaceutical spending. There is a need to control health spending in the pharmaceutical sector and to monitor use of medicines in retail pharmacies. Additional efforts should be made to reap the potential benefits from competition in generic markets; for example, through further price reductions and the use of evidence-based practice guidelines to encourage the use of less expensive products where appropriate. Cost-containment strategies such as utilization review mechanisms, rational drug use, and rigorous pharmaceutical pricing mechanisms are very important to consider while implementing the universal coverage reform.
This article is an attempt to translate data generated from the Dubai health account, the Qatar health account, and Eurostat database of health expenditure for OECD countries into policy-relevant information. This article made use of existing data that could facilitate health financing and policy decision-making by allowing comparison of Dubai with Qatar and 25 OECD countries. This article is also an invitation to other researchers in the field to apply quantitative techniques to measure and provide deeper insight into how to inform policy using the published Dubai NHA in our region. Only this kind of understanding could help us to be sure that we are moving forward in our journey to make informed health policy decisions.
Disclosure
The author reports no conflicts of interest in this work.
References
Dubai Statistics Center – Government of Dubai. Population bulletin emirate of Dubai 2013. Dubai: Dubai Statistics Center; 2013. Available from: http://www.dsc.gov.ae/EN/Themes/Pages/Publications.aspx?TopicId=23. Accessed July 15, 2014. | |
Dubai Health Authority. Dubai Annual Health Statistics Report. Dubai: Dubai Health Authority; 2012. Available from: https://www.dha.gov.ae/EN/SectorsDirectorates/Sectors/HealthPolicy/Pages/HealthDataandInformationAnalysis.aspx. Accessed July 15, 2014. | |
Dubai Health Authority. Health Accounts System of Dubai (HASD) Report 2012. Dubai: Dubai Health Authority; 2014. Available from: http://www.isahd.ae/content/docs/HASD%20English%202012.pdf. Accessed 15 July, 2014. | |
Policy Affairs Directorate. Qatar National Health Accounts Report – 2011. Qatar: Supreme Council of Health; 2012. Available from: http://www.nhsq.info/app/media/1299. Accessed July 25, 2014. | |
Health care statistics [webpage on the Internet]. Eurostat (Statistical office of the European Union); 2014 [updated November 27, 2014; cited March 31, 2014]. Available from: http://ec.europa.eu/eurostat/statistics-explained/index.php/Healthcare_statistics. Accessed November 28, 2014. | |
Organization for Economic Cooperation and Development (OECD). Health at a Glance 2011: OECD Indicators. OECD Publishing; 2011 [cited March 31, 2014]. Available from: http://www.oecd.org/els/health-systems/49105858.pdf. Accessed November 28, 2014. | |
A System of Health Accounts. Paris: Organization for Economic Cooperation and Development (OECD); 2011 [cited April 9, 2014]. Available from: http://www.oecd.org/dataoecd/41/4/1841456.pdf. Accessed November 28, 2014. | |
Organization for Economic Cooperation and Development (OECD). Health at a Glance 2013: OECD Indicators. OECD Publishing; 2013 [cited April 9, 2014]. Available from: http://www.oecd.org/els/health-systems/Health-at-a-Glance-2013.pdf. Accessed November 28, 2014. | |
United Arab Emirates Ministry of Health. Health Statistics. Dubai: United Arab Emirates Ministry of Health; 2012 [cited March 31, 2014]. Available from: http://www.moh.gov.ae/en/OpenData/Pages/OpenData.aspx?Category=All%20Open%20Data. Accessed November 28, 2014. | |
Glossary of Statistical Terms: Prevention and Public Health Services [webpage on the Internet]. Organization for Economic Cooperation and Development (OECD); 2001 [updated March 11, 2003; cited April 27, 2014]. Available from: http://stats.oecd.org/glossary/detail.asp?ID=2106. Accessed November 28, 2014. | |
Gutiérrez G, Pérez-Cuevas R, Levy S, et al. Strengthening preventive care programs: a permanent challenge for healthcare systems; lessons from PREVENIMSS México. BMC Public Health. 2010;10:417. | |
Woolf SH, Husten CG, Lewin LS, Marks JS, Fielding JE, Sanchez EJ. The economic argument for disease prevention: distinguishing between value and savings.Washington, DC: Partnership for Prevention; 2009. Available from: https://www.prevent.org/data/files/initiatives/economicargumentfordiseaseprevention.pdf. Accessed July 16, 2014. | |
Awofeso N, Hamidi S, Rammohan A, Wang C. Correlates of tobacco use and physical activity among Emirati citizens and non – citizens residents in Dubai, UAE. Global Journal of Medicine and Public Health. 2014;3(4). | |
Organization for Economic Cooperation and Development (OECD). Value for Money in Health Spending. OECD Publishing; 2010. Available from: http://www.oecd.org/berlin/46201464.pdf. Accessed July 16, 2014. | |
Kumar AB, Izekenova A, Abikulova A. Inpatient care in Kazakhstan: a comparative analysis. J Res Med Sci. 2013;18(7):549–553. | |
Public expenditure on health: its growing importance, drivers and policy reforms to curb growth. In: Report on Public Finances in EMU 2013. Brussels: European Commission; 2013:147–192. Available from: http://ec.europa.eu/economy_finance/publications/european_economy/2013/public-finances-in-emu-2013_en.htm. Accessed July 16, 2014. | |
Orosz E, Morgan D. SHA-Based National Health Accounts in Thirteen OECD Countries: A Comparative Analysis. OECD Health Working Papers No 16. Paris: Organization for Economic Cooperation and Development (OECD); 2004. Available from: http://www.oecd.org/els/health-systems/33661480.pdf. Accessed July 17, 2014. | |
World Health Organization (WHO). Medicine Prices, Availability, Affordability and Price Components in UAE. WHO, Regional Office for the Eastern Mediterranean; 2010. Available from: http://www.haiweb.org/medicineprices/surveys/200612AE/sdocs/EMP-UAE-summary-new%20pricing.pdf. Accessed July 17, 2014. | |
Alpen Capital investment Banking. GCC Pharmaceutical Industry. Qatar: Alpen Capital; 2013. Available from: http://www.alpencapital.com/downloads/GCC_Pharmaceuticals_Industry_Report_March_2013.pdf. Accessed July 17, 2014. | |
10 facts on universal health coverage [webpage on the Internet]. Geneva: World Health Organization (WHO); 2012 [cited April 9, 2014]. Available from: http://www.who.int/features/factfiles/universal_health_coverage/en/. Accessed November 28, 2014. | |
World Health Organization (WHO). Health Financing Strategy for the Asia Pacific Region (2010–2015). Geneva: WHO; 2009 [cited April 9, 2014]. Available from: http://www.who.int/health_financing/documents/cov-wprosearo-strategy2010/en/. Accessed November 28, 2014. | |
Global Status Report on Noncommunicable Diseases 2010. Geneva: World Health Organization (WHO); 2011 [cited April 28, 2014]. Available from: http://whqlibdoc.who.int/publications/2011/9789240686458_eng.pdf. Accessed November 28, 2014. | |
Msuya JM, Nyaruhucha CN, Kaswahili J. Does preventive health care have a chance in the changing health sector in Tanzania? East Afr Med J. 2003;80(3):135–139. |
 © 2015 The Author(s). This work is published and licensed by Dove Medical Press Limited. The full terms of this license are available at https://www.dovepress.com/terms.php and incorporate the Creative Commons Attribution - Non Commercial (unported, v3.0) License.
By accessing the work you hereby accept the Terms. Non-commercial uses of the work are permitted without any further permission from Dove Medical Press Limited, provided the work is properly attributed. For permission for commercial use of this work, please see paragraphs 4.2 and 5 of our Terms.
© 2015 The Author(s). This work is published and licensed by Dove Medical Press Limited. The full terms of this license are available at https://www.dovepress.com/terms.php and incorporate the Creative Commons Attribution - Non Commercial (unported, v3.0) License.
By accessing the work you hereby accept the Terms. Non-commercial uses of the work are permitted without any further permission from Dove Medical Press Limited, provided the work is properly attributed. For permission for commercial use of this work, please see paragraphs 4.2 and 5 of our Terms.