")
Back to Journals » International Journal of Nanomedicine » Volume 9 » Issue 1
Green synthesis of gold nanoparticles using plant extracts as reducing agents
Authors Elia P, Zach R, Hazan S, Kolusheva S, Porat Z, Zeiri Y
Received 10 November 2013
Accepted for publication 14 January 2014
Published 20 August 2014 Volume 2014:9(1) Pages 4007—4021
DOI https://doi.org/10.2147/IJN.S57343
Checked for plagiarism Yes
Review by Single anonymous peer review
Peer reviewer comments 4
Paz Elia,1 Raya Zach,1 Sharon Hazan,2 Sofiya Kolusheva,2 Ze’ev Porat,1,3 Yehuda Zeiri1,3
1Department of Biomedical Engineering, 2Ilse Katz Institute of Nanotechnology, Ben-Gurion University of the Negev, 3Division of Chemistry, Negev Nuclear Research Center Beersheba, Israel
Abstract: Gold nanoparticles (GNPs) were prepared using four different plant extracts as reducing and stabilizing agents. The extracts were obtained from the following plants: Salvia officinalis, Lippia citriodora, Pelargonium graveolens and Punica granatum. The size distributions of the GNPs were measured using three different methods: dynamic light scattering, nanoparticle-tracking analysis and analysis of scanning electron microscopy images. The three methods yielded similar size distributions. Biocompatibility was examined by correlation of L-cell growth in the presence of different amounts of GNPs. All GNPs showed good biocompatibility and good stability for over 3 weeks. Therefore, they can be used for imaging and drug-delivery applications in the human body. High-resolution transmission electron microscopy was used to view the shapes of the larger GNPs, while infrared spectroscopy was employed to characterize the various functional groups in the organic layer that stabilize the particles. Finally, active ingredients in the plant extract that might be involved in the formation of GNPs are proposed, based on experiments with pure antioxidants that are known to exist in that plant.
Keywords: gold nanoparticles, Lippia citriodora, Salvia officinalis, Pelargonium graveolens, Punica granatum, antioxidants, size distribution, zeta potential
Introduction
Biomedical applications using gold nanoparticles (GNPs) have become a very active research area in recent years.1–3 A large variety of possible biomedical applications has been examined, ie, drug and gene delivery,4,5 protein and pathogens detection, deoxyribonucleic acid labeling, fluorescent labeling, tissue engineering, photothermal ablation and contrast agents for magnetic resonance imaging and other imaging methods.6 Much of the research is devoted to the study of synthesis, stabilization, and functionalization of the GNPs.7 The most common stabilizing agents reported are sodium citrate, transferrin and cetyltrimethylammonium bromide, while common species used for functionalization include various amines, oligonucleotides, peptides, antibodies and lipids. The interest in GNPs is largely due to the relative ease of their synthesis, with good control of their sizes and shapes, their optical characteristics and their good biocompatibility. The accumulation of GNPs in the body following repeated administrations can reach toxic levels.8 Consequently, most of the studies using GNPs are still in the preclinical stage.9
To improve the biocompatibility of GNPs it is preferable to use nontoxic reagents. All GNP-preparation methods are based on the reduction of gold ions, mostly as solutions of HAuCl4. Various reducing agents have been reported in the literature, the most common being sodium borohydride and sodium citrate.10 In addition, GNP synthesis requires a protecting agent, whose role is to adsorb onto the surface of the newly formed nanoparticles (NPs) to prevent further growth and particle agglomeration. Therefore, the size and shape of GNPs can be controlled by the use of proper reduction and agitation methods and the choice of suitable types of protection agent and concentration, as well as synthesis conditions, ie, temperature, pH, stirring and the use of external fields (such as ultrasound). These considerations resulted in numerous publications suggesting new synthesis routes of GNPs in which green reduction and protection agents were used.11,12 Most of these reducing and stabilizing agents were obtained from plants,13,14 algae, bacteria and fungi.14,15 For example, Raveendran et al16 described a method to prepare NPs of gold, silver, and their alloys using glucose as a reducing agent and starch as a protective agent. The particle-size distributions obtained were in the range of 2–12 nm. Wang et al17 described a synthesis of GNPs in which an electrochemical method using an amino-terminated ionic liquid was used for ion reduction and GNP stabilization. This approach yielded small NPs with an average size of 1.7 nm. Huang et al18 found that Bayberry’s tannin extract can be used simultaneously as reducing and protective agents, yielding GNPs with an average size of 2 nm. Based on ultraviolet-visible (UV-vis) measurements, Sharma et al19 reported that tea leaf extract can be used in GNP synthesis. It was found that variation in the concentration of the tea leaf extract could be used to control the size distribution of the GNPs created. Suman et al20 used extract from Morinda citrifolia roots at room temperature, and the size of the resultant GNPs was in the range of 8–17 nm, while Shankar et al21 obtained GNPs with different shapes in the size range of 20–40 nm using Pelargonium graveolens (PeG) leaves and its endophytic fungus. Basavegowda et al22 synthesized GNPs in the size range of 10–50 nm using Punica granatum (PuG) extract as a reducing agent and examined its antibacterial properties, while Fierascu et al23 synthesized 10 nm GNPs from Salvia officinalis (SO) extract and Cruz et al24 synthesized silver NPs with a size distribution in the range of 15–30 nm from Lippia citriodora (LC). The study presented here describes a detailed investigation of the synthesis and characterization of GNPs using four different plant extracts.
Materials and methods
GNP preparation
Extracts of four common garden plants, listed in Table 1, were prepared as follows: 10 g of leaves or fruit were washed once with tap water and twice with double-distilled water (DDW; 18 MΩ/cm; EMD Millipore, Billerica, MA, USA) and then diced in a blade blender with 30 mL of DDW until a homogeneous fluid was obtained. The extract volume was completed with DDW to 50 mL. The extracted solution was homogenized by stirring and then centrifuged for 2 minutes, followed by filtering through a 0.45 μm filter (Millex® polyvinylidene difluoride; EMD Millipore). All the extracts were kept frozen at –18°C until used. As shown in Table 1, plant leaves were used to obtain the extracts for SO, LC, and PeG, while for PuG the edible grains of the fruit were used to generate the extract. Therefore, only consumable plant parts with high antioxidant content were employed to ensure biocompatibility. Both SO and PeG have been reported previously to be used in GNP synthesis;20,22 however, the plant extract used in the earlier studies was obtained using a markedly different procedure. Therefore, the identity and amount of the reducing and stabilizing agents in those extracts might have been very different compared to those in the present study.
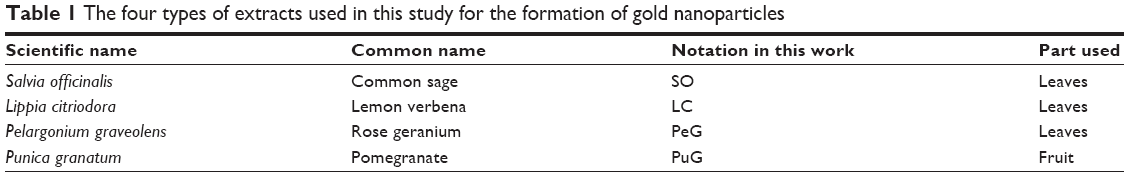 | Table 1 The four types of extracts used in this study for the formation of gold nanoparticles |
Gold ion solution was prepared by diluting 16.6 μL of 30 wt% HAuCl4 solution (Sigma-Aldrich, St Louis, MO, USA) in 50 mL of DDW to form a 0.1 g/L solution. GNPs were prepared by mixing 10 mL of the gold ion solution (1.0 mg HAuCl4) with 0.75 mL of plant extract. In the case of both PuG and PeG, the mixture changed color to a deep purple/red within a few seconds. The color change was due to GNP formation, as verified by UV-vis absorption at 530 nm. For the other extracts, slight heating to 35°C–40°C for several minutes was required until GNP formation was observed by the appropriate color change. The slight heating required in the case of SO and LC is related to the lower reducing activity of these two plant extracts.
Spectroscopic measurements
The UV-vis measurements were carried out with a V-550 spectrophotometer (Jasco Inc., Easton, MD, USA). Fourier-transform infrared (FTIR) spectra reported were recorded using an iN™10 FTIR microscope spectrometer (Thermo Fisher Scientific, Waltham, MA, USA) equipped with a narrow-band liquid nitrogen-cooled mercury cadmium telluride A (MCT-A) detector. All single-beam spectra were measured against a background recorded from gold. Appropriate backgrounds were obtained for each series of measurements. The spectra were recorded in the range from 4,000 to 700 cm−1, at 2 cm−1 resolution with 16 scans; the area of detection was 25×25 mm.
FTIR data were collected using Omnic Picta™ (Thermo Fisher Scientific) software. After collection, automatic atmospheric suppression (to minimize infrared (IR) absorption by CO2 and water vapor in ambient air) and automatic baseline correction were used. For preparation of the FTIR samples, 5 mL of the liquid samples was put on an alumina-coated glass slide and dried under vacuum overnight at room temperature. GNP samples were washed twice with DDW before placing on the slide.
Dynamic light-scattering measurements
These were carried out using a CGS-3 compact goniometer system (ALV, Langen, Germany). The He–Ne laser (line 632.8 nm) power used was 20 mW. Correlograms were calculated using an ALV/LSE 5003 correlator. A suitable procedure was applied for the averaged correlogram taken for 20 runs of 10 seconds’ duration at 25°C. The regularization method, also called the Contin model, was used to extract the diffusion coefficients.25 GNP-stability tests were performed using triplicate measurements that were performed at two angles – 90° and 60°. Size-distribution determination measurements were performed only at 90°. GNP-size distributions were calculated using the Stokes–Einstein relationship carried out with the ALV Correlator software version 3.0.2.1. All dynamic light-scattering (DLS) samples were 100× diluted with DDW water.
Nanoparticle-tracking analysis
Measurements were performed under trigger mode with a NanoSight NS300 (Malvern Instruments, Malvern, UK) equipped with a 405 nm laser module and a 450 nm long-pass filter. NanoSight software version NTA 2.3 was used for data accumulation and analysis. Data was recorded using a 20× objective and 60-second video clips. The Stokes–Einstein equation was used to calculate the mean hydrodynamic diameter. Three video measurements were conducted for each sample to provide an average size and standard deviation. All samples were also diluted hundredfold by DDW water.
DLS and nanoparticle-tracking analysis (NTA) are two methods that can be used to characterize NP-size distributions in liquids. Both are based on Rayleigh scattering from small particles performing Brownian motion in the liquid. DLS is very fast, and has a high sensitivity of size detection down to about 1 nm-size particles. However, due to the complex data evaluation, the method lacks precision and resolution, and thus it is not an accurate quantitative method. The NTA approach can be used for quantitative measurements; it is very fast, but it is limited to size detection of particles larger than approximately 20 nm.
Scanning electron microscopy
Scanning electron microscopy (SEM) was undertaken with a JSM-7400F microscope (JEOL, Tokyo, Japan), operated at 3 kV.
Energy-dispersive X-ray spectroscopy
Energy-dispersive X-ray spectroscopy (EDS) was undertaken with a Thermo Scientific™ NORAN™ System 6 EDS system.
Transmission electron microscopy
Transmission electron microscopy (TEM) was undertaken with a Tecnai™ G2 12 microscope (FEI, Hillsboro, OR, USA).
Image processing
The image-analysis tool JMicroVision version 1.2.7 (www.jmicrovision.com) was used for analysis of SEM and TEM images.26
Inductively coupled plasma optical emission spectrometry
Inductively coupled plasma optical emission spectrometry (ICP-OES) was undertaken with an Arcos spectrometer (Spectro Analytical Instruments, Kleve, Germany) with radial plasma observation. It was outfitted with a Paschen–Runge mount equipped with 32 linear charge-coupled device detectors, providing the capability of simultaneous monitoring of line intensities at wavelengths between 130 and 770 nm.
Zeta potential
Zeta-potential measurements were done with a Zetasizer Nano ZS (Malvern Instruments) in a disposable cell at 25°C, using Zetasizer 7.01 software. Both DLS and zeta-potential measurements were used to study GNP stability. These measurements were carried out first 2–3 hours after the GNPs were synthesized and then once a week for 3 weeks. Between measurements, all GNP suspensions were kept frozen at −18°C. The suspension was allowed to melt and equilibrate at room temperature for 2 hours prior to measurement. Straight away after the measurements were taken, the extracts were frozen again.
Cell-growth measurements
L-cells, a murine fibroblast cell line (contribution of Professor Amos Douvdevani, Department of Clinical Biochemistry and Pharmacology, Soroka Medical Center and Ben-Gurion University of the Negev, Be’er-Sheva, Israel), were cultured in 50 mm sterile disposable petri dishes, each with 4 mL growth medium and incubated at 37°C in approximately 5% (v/v) CO2 and 95% air in a humidified incubator. The growth medium contained 89.3% (v/v) Dulbecco’s modified Eagle’s medium (without d-glucose, sodium pyruvate, or l-glutamine), 8.9% certified fetal bovine serum, 0.9% l-glutamine solution, and 0.9% penicillin–streptomycin solution (all were purchased from Biological Industries Israel Beit-Haemek, Kibbutz Beit Haemek, Israel) and stored at 4°C until used.
For each plant extract, 12 clear petri dishes with 4 mL medium were cultured with 100,000 cells. Three volumes of GNP suspension (1, 10, and 100 μL) were added to three sets of three dishes in each set, while the remaining three plates were used as controls. A cell count of one dish from each of the four sets was performed after 24, 48, and 72 hours. Growth curves were created using the cell-count data of the GNP-containing dishes and the controls.
The cell counts were carried out after suspending the cells. To obtain the cell suspension, the growth medium was removed, the cell layer briefly rinsed with 1 mL Dulbecco’s phosphate buffered saline, 0.7 mL of trypsin solution (Biological Industries Israel Beit-Haemek Ltd) was added, the dish placed at 37°C for approximately 1 minute, 1.4 mL growth medium was added, and the cells aspirated by gently pipetting and vortexing the cell suspension at the end.
Cell counting was carried out manually using the hemocytometer method under an inverted microscope. Each data point represents an average of eight nonneighboring 1 mm2 (100 nL) squares. The error in counting was estimated by the standard deviation of the eight squares. The viability of the cells was tested by using a dilution of 50% (v/v) cell suspension and 50% trypan blue dye solution, 0.4% (Sigma-Aldrich) in the cell-counting process under the microscope.
Results
Synthesis and compositional characterization of the GNPs
The appearance of a purple color following mixing of the plant extract with HAuCl4 solution indicated the formation of GNPs. The resulting colloidal solutions were examined by UV-vis spectroscopy. Figure 1 presents typical spectra that were obtained using the four extracts. As is clearly seen, in three of the spectra the GNP-absorption peaks appeared at wavelengths in a narrow range – SO =535±8 nm, LC =536±2 nm, and PeG =538±8 nm – whereas for PuG, the absorption peak was observed at a higher wavelength (568±12 nm). These wavelength values corresponded to the average values of the peak positions on repeated measurements. The shift in the peak position of PuG was related to a shift in GNP-size distribution to larger values.27
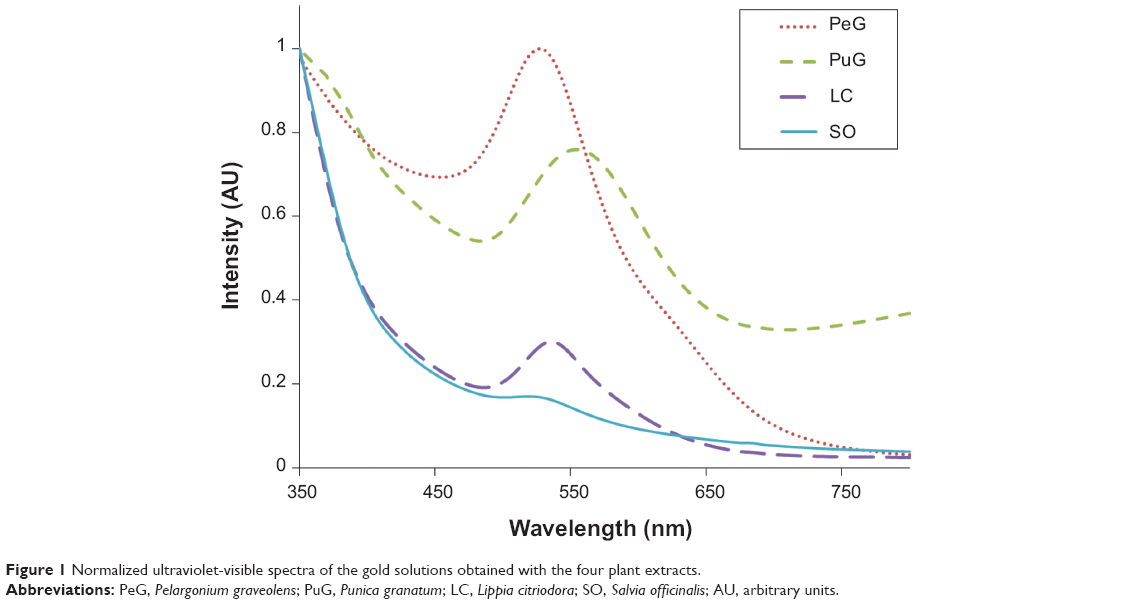 | Figure 1 Normalized ultraviolet-visible spectra of the gold solutions obtained with the four plant extracts. |
FTIR spectra were obtained from the pure extract as well as from the colloidal solutions. The main goal was to identify absorption peaks that exhibited prominent shifts in the two media. It was assumed that shifts in peak position were related to adsorption of extract constituents onto the GNP surfaces. In all four cases, very similar spectra were obtained for the two phases examined (Figure 2). The high similarity between extract and colloidal solutions indicated that the same compounds existed in both media. Despite the similarity between extract and colloidal solution spectra, some absorption peaks exhibited marked shifts in their position. The absorption peaks that exhibited major shifts and their possible interpretations are presented in Table 2.
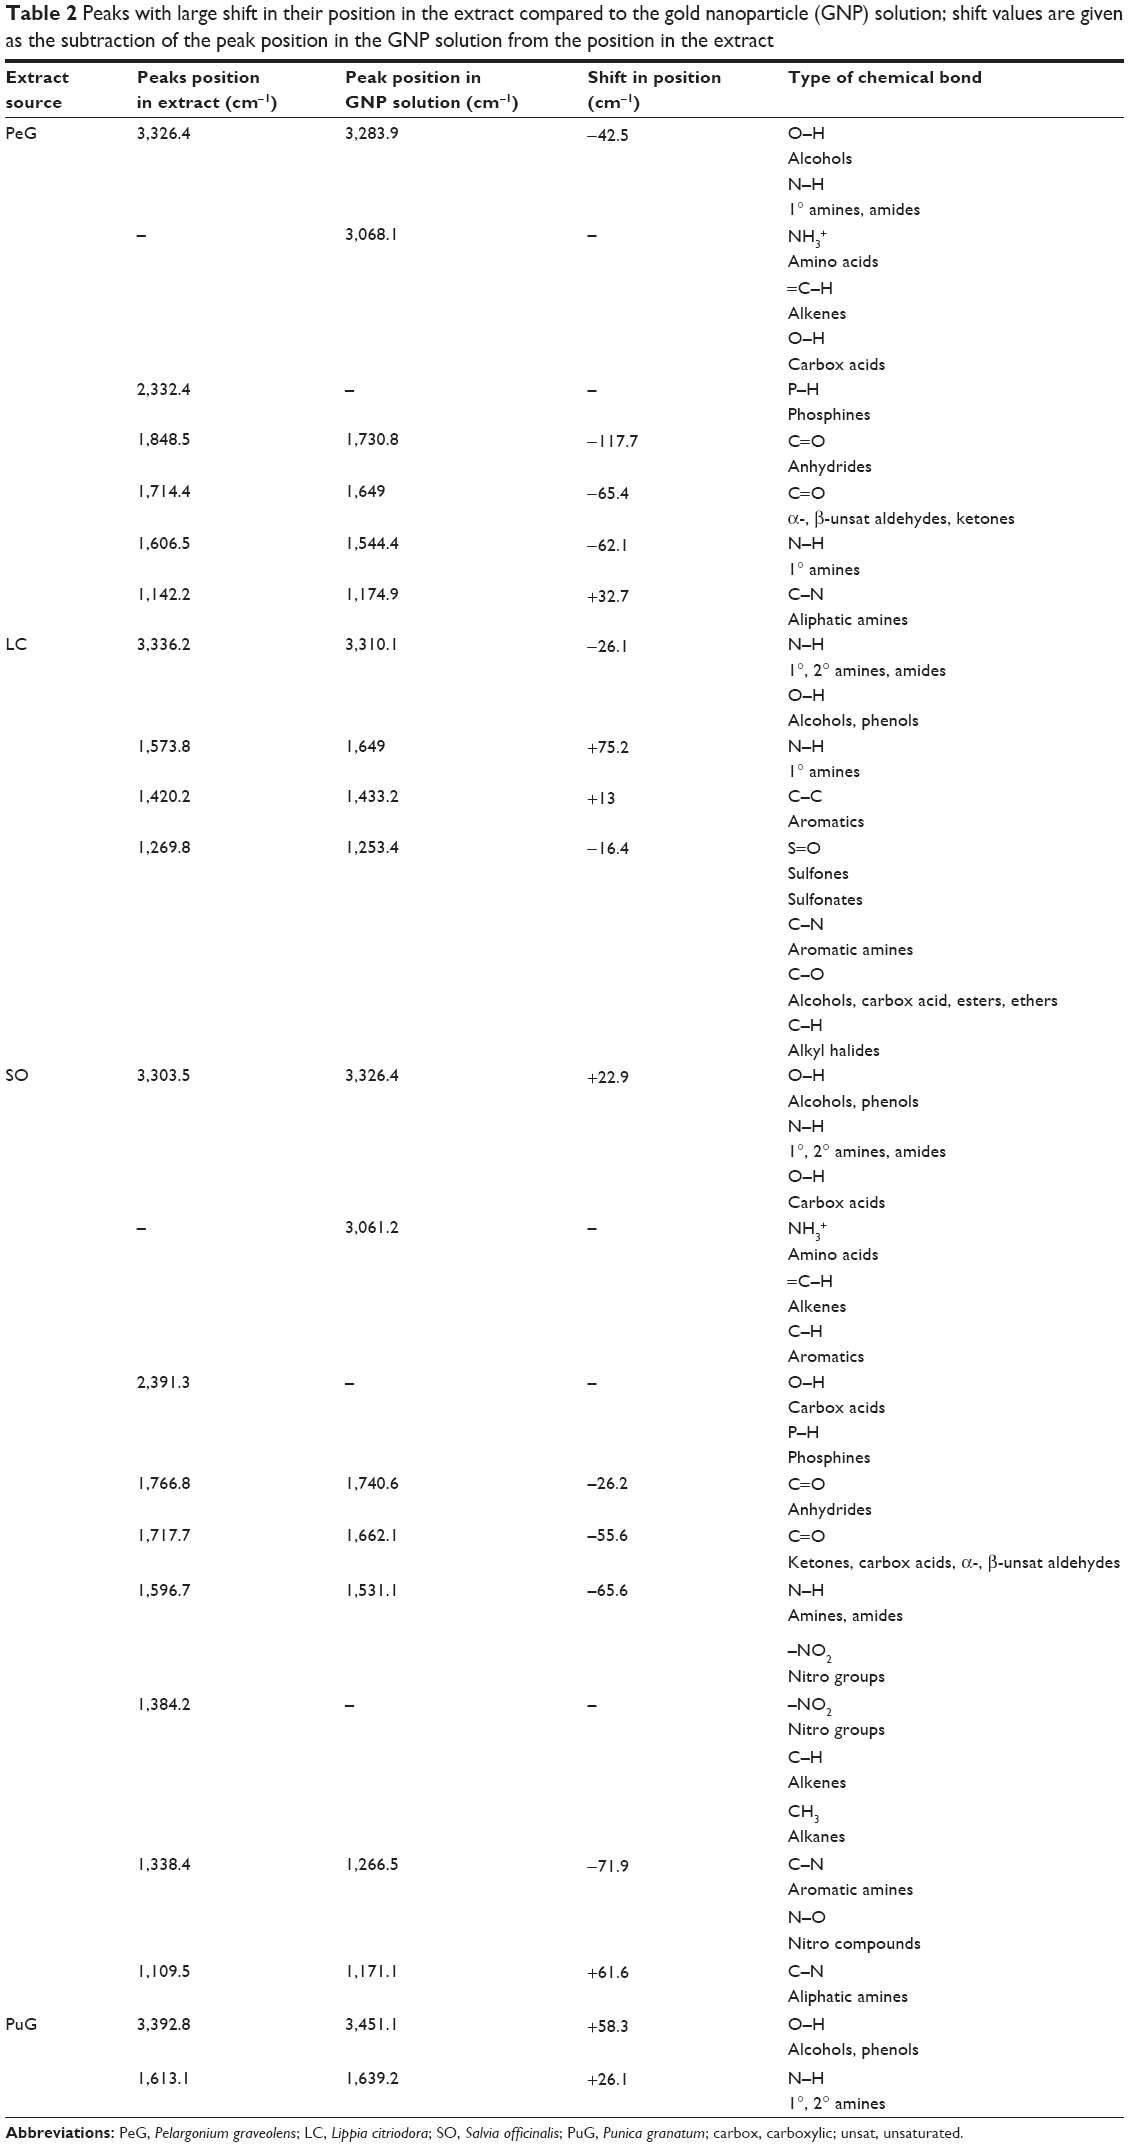 | Table 2 Peaks with large shift in their position in the extract compared to the gold nanoparticle (GNP) solution; shift values are given as the subtraction of the peak position in the GNP solution from the position in the extract |
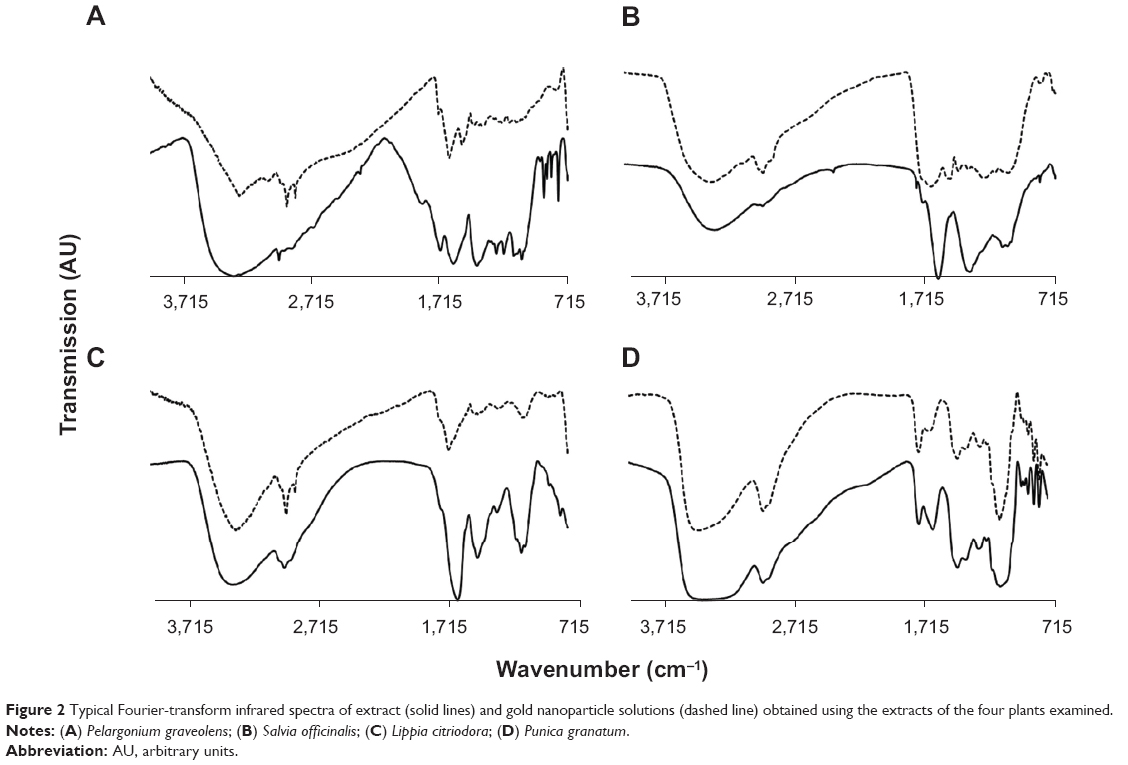 | Figure 2 Typical Fourier-transform infrared spectra of extract (solid lines) and gold nanoparticle solutions (dashed line) obtained using the extracts of the four plants examined. |
SEM-EDS analysis of particle composition was carried out by placing a droplet (~5 μL) of the sample solution onto a clean silicon-wafer surface. The droplets were dried at ambient temperature followed by thin (about 100 nm) carbon-film coating by evaporation. The carbon film was necessary to obtain electrical conductivity high enough to prevent sample charging. The e-beam used in the EDS measurements had a diameter that was larger than the particle diameter. Therefore, the elemental composition obtained reflected the composition of both particle and its surroundings. Figure 3 presents the EDS spectra obtained for three different samples. The results clearly show that the particle composition was indeed gold. The small quantities of additional elements, including C, O, Al, Na, Mg, K, and Ca, were associated with the elemental content of the plant extract following the solvent evaporation. Indeed, elemental analysis of the plant extracts by ICP-OES showed that all extracts contained minute quantities of these (as well as other) elements. The data showed good correlation between the levels of various elements in the four plant extracts and the EDS results.
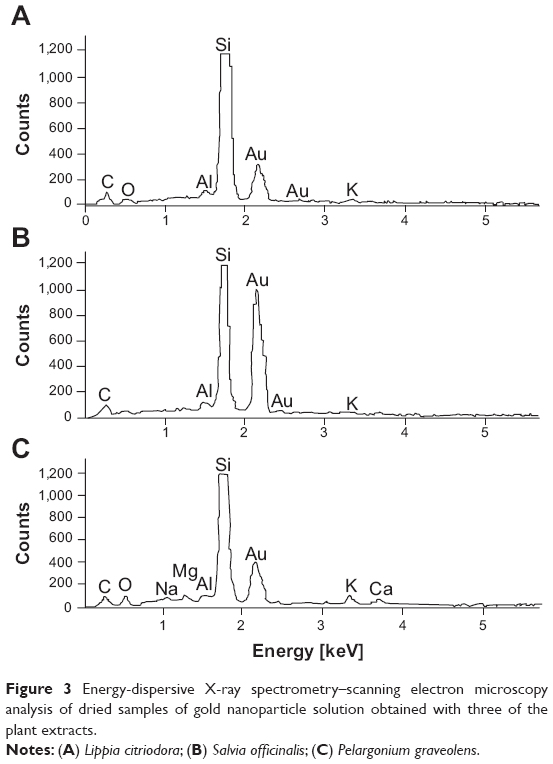 | Figure 3 Energy-dispersive X-ray spectrometry–scanning electron microscopy analysis of dried samples of gold nanoparticle solution obtained with three of the plant extracts. |
Size-distribution measurements
Distributions of the hydrodynamic diameters of the GNPs in the different samples were measured by two different light scattering-based techniques. DLS measurements were performed at 90° with three repetitions for each of three samples of each plant extract (total of nine measurements for each extract). The results are presented in Figure 4, where the scattering intensity is shown as a function of the logarithm of the particle diameters (Figure 4A). In all four cases, bimodal distributions were observed, with the peaks of the larger diameter exhibiting most of the intensity. However, this presentation might be misleading, since the scattering intensity increases at the sixth power of the particle radius. As a result, the particle-size distribution obtained in light-scattering intensity measurements is highly biased towards larger particles and do not faithfully represent the number of particles with given size. The intensity ratio between the two peaks in the DLS measurement was such that the peak that corresponded to the small particles constituted only 1%–3% of the total intensity, while the rest corresponded to the large particles. Number-weighted distributions obtained by the ALV software pointed to inverse distribution, namely the large majority (over 97%) of the particles in the colloid solution corresponded to the group of small particles. However, one should remember that the error introduced in the number-weighted DLS results was quite large, due to its sixth-power dependence on the error in the measurements. Particle number-weighted DLS results for all four samples are presented in Figure 4B. It is clear that most of the particles in the LC, PeG, and SO colloid solutions were small, in the size range of 1–8 nm. In the case of PuG, most of the particles were in the range of 30–70 nm, with a negligible amount of larger particles. The unweighted average diameters and the corresponding standard deviations of the DLS peaks shown in Figure 4A are summarized in Table 3. These results are in agreement with the data obtained by the UV-vis absorption measurements (Figure 1), where the first three samples absorbed at nearly the same wavelengths that corresponded to the existence of small particles, whereas the absorption of the PuG samples shifted to a higher value, indicating a shift to a larger particle size.
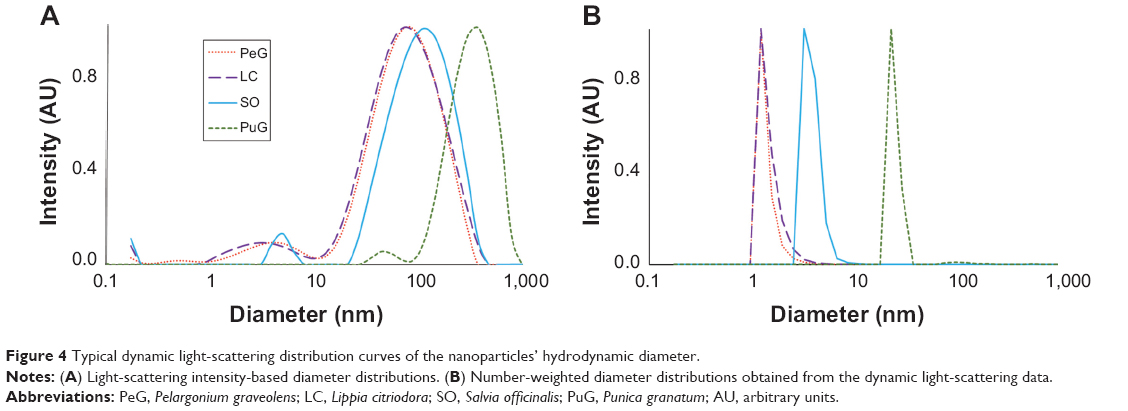 | Figure 4 Typical dynamic light-scattering distribution curves of the nanoparticles’ hydrodynamic diameter. |
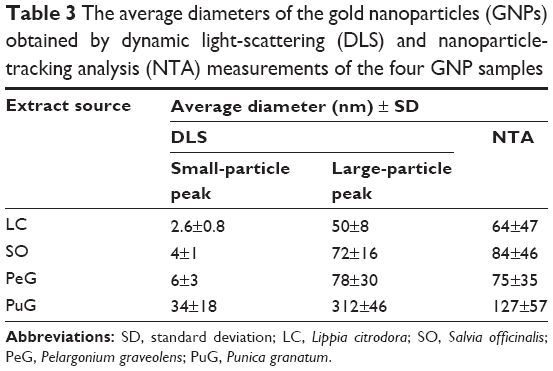 | Table 3 The average diameters of the gold nanoparticles (GNPs) obtained by dynamic light-scattering (DLS) and nanoparticle-tracking analysis (NTA) measurements of the four GNP samples |
Particle-size measurements were performed also by the NTA method. The results obtained for the four samples are presented in Figure 5. All samples exhibit similar asymmetric distribution curves with slow decaying tails towards large particle diameters, but with different distribution widths. These curve shapes are similar to those obtained in the DLS measurements (Figure 4A). Again, the distributions for LC, SO, and PeG peak at particle-size values below 100 nm, while the curve for PuG is markedly wider and spans over 300 nm. The existence of small particles (<20 nm) is not as obvious as in the DLS curves, since NTA is much less sensitive to particles with a diameter smaller than 20 nm.The average diameter values obtained by NTA are also presented in Table 3, showing a good agreement with the data obtained by DLS, with the exception of PuG, where the average diameter obtained by DLS was 2.4-fold larger than that obtained by NTA.
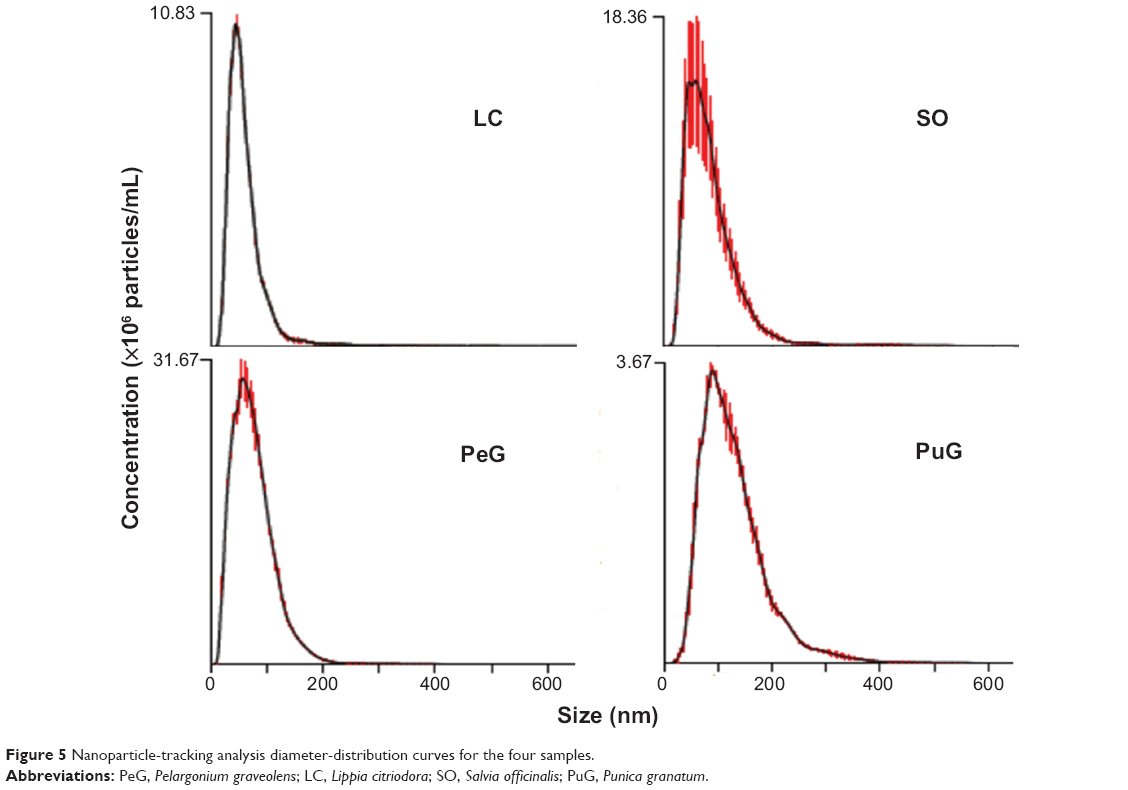 | Figure 5 Nanoparticle-tracking analysis diameter-distribution curves for the four samples. |
A different approach to assess particle-size distribution was by computerized analysis of SEM images. This was carried out using the JMicroVision code. The code can calculate the average diameter (d) of the particles in an image from any one of their geometrical characteristics, namely area (d =2v[s/π]), perimeter (d =p/π), or average of longest and shortest diameters (d =0.5[d1+d2]) in 2-D. Typical SEM images of two kinds of samples are presented in Figure 6A, and B. The number of particles seen in each image enabled only limited statistical accuracy, and hence for each type of sample several images were processed. The calculated average diameters obtained by the three geometrical characteristics are presented in Table 4, while their distribution curves are shown in Figure 7.
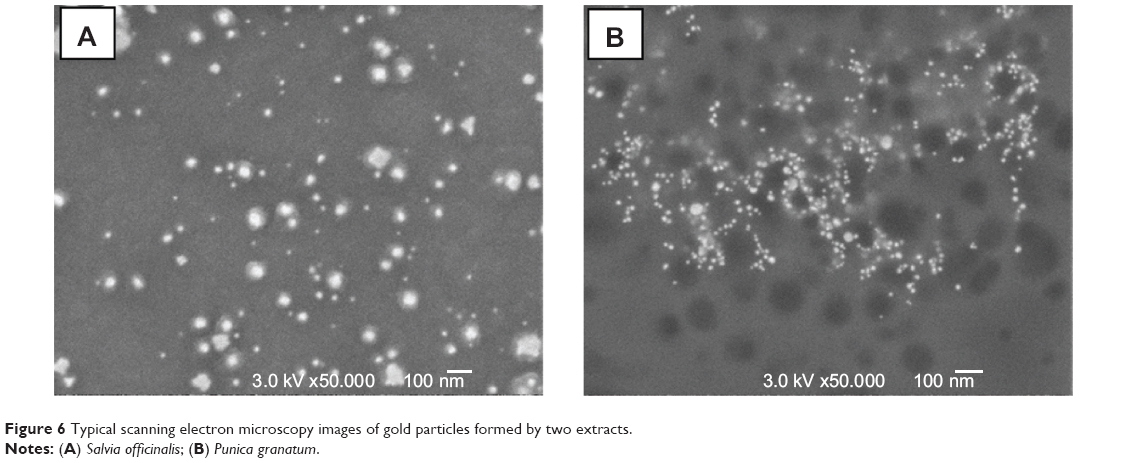 | Figure 6 Typical scanning electron microscopy images of gold particles formed by two extracts. |
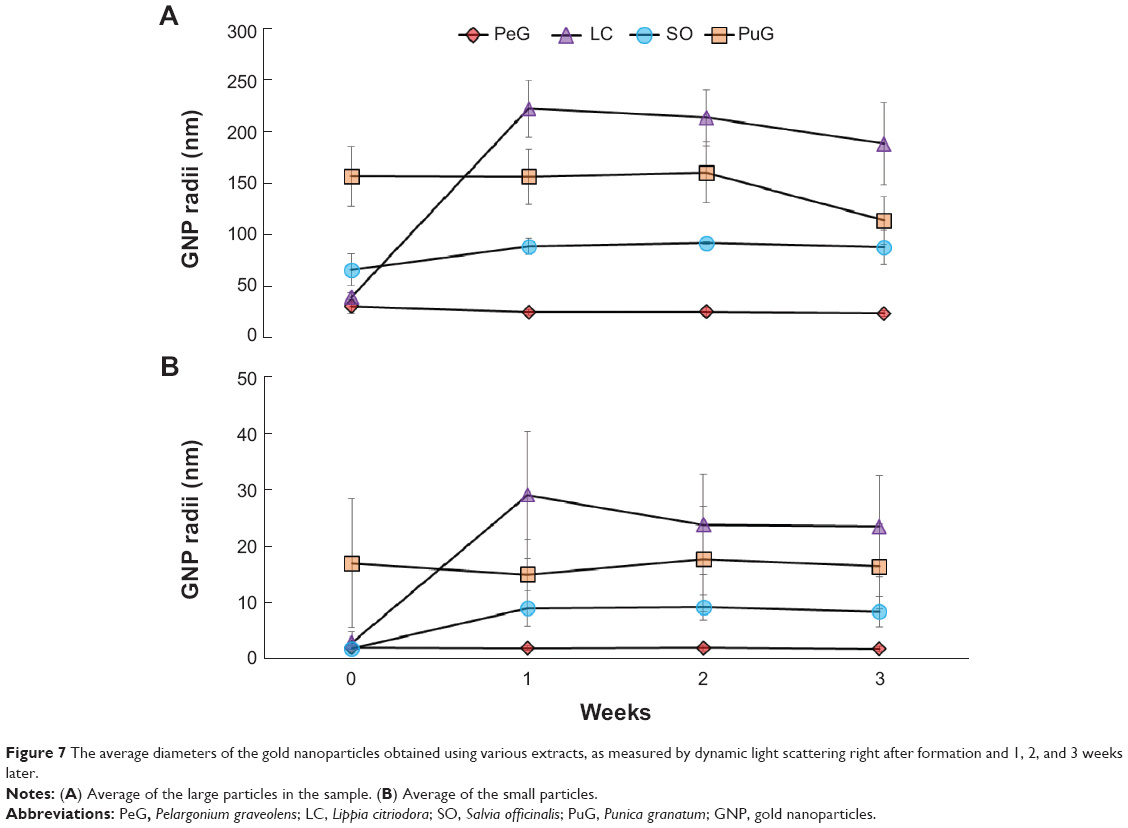 | Figure 7 The average diameters of the gold nanoparticles obtained using various extracts, as measured by dynamic light scattering right after formation and 1, 2, and 3 weeks later. |
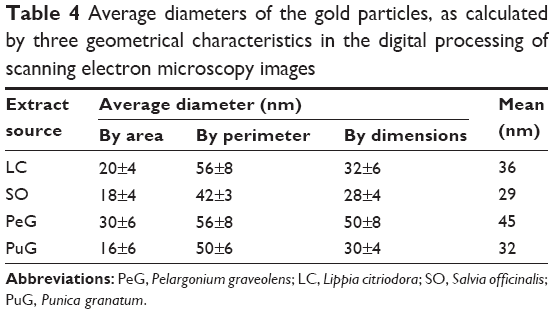 | Table 4 Average diameters of the gold particles, as calculated by three geometrical characteristics in the digital processing of scanning electron microscopy images |
The data in Table 4 show some variation in the results obtained by the three geometrical characteristics, although they are all in the same range. Unlike the results obtained by the light-scattering methods, here the particles formed with the PuG extract appeared to be similar in size to the other samples. This difference may be related to the fact that PuG colloids probably contained clusters of GNPs linked by organic molecules. These clusters would be larger than individual particles. In the SEM images, the large contrast between the GNPs and the surroundings allows sampling of the particles themselves without the organic material that binds them. However, in light scattering-based experiments, the cluster is expected to exhibit more intense scattering properties compared to the individual GNPs. However, there are four points to note associated with the image-processing method: 1) a closer examination of the SEM micrographs shows that many of the particles are surrounded by a halo, and thus may have been estimated to be larger than the actual particle size; 2) particles smaller than 10 nm cannot be observed by SEM, hence most of the small particles were not detected; 3) the SEM images represent only a limited portion of the particle population, contrary to the optical methods that measure the entire population; and 4) the contrast between the background and the organic matter in the SEM images is less significant than the contrast between the gold and the background. Therefore, most of the organic matter is transparent in the SEM images.
The stability of GNP-size distribution was examined by repeating DLS measurements of the same samples after 1, 2, and 3 weeks. In all these measurements, bimodal curves were obtained (Figure 7) very similar to those obtained in the first measurement carried out right after the GNPs were generated (Figure 4A). The average particle diameters in both peaks for PeG and PuG exhibited nearly constant values. However, the average size of particles obtained for SO showed a slight size increase for both small and large particle peaks during the first week, followed by constant values at later times. In the case of LC, a prominent increase in average particle size for both groups was observed after 1 week, followed by a small decrease at later times. These variations, as well as the fluctuation in the measured values, may have been associated with sedimentation of material that was observed in some of the solutions, thus resulting in size-distribution changes of the suspended particles.
Zeta potentials
The zeta potentials of the particles in the four samples were measured at 25°C. The initial values, measured approximately 3 hours after particle formation, are shown in Table 5. The GNPs in all samples had a negative zeta-potential values in the range of −10 to −30 mV. This range is considered as an incipient stability for colloids.28,29 The values obtained for LC, SO, and PeG were close to each other, whereas that for PuG exhibited a lower value. This is in accordance with the results of the average diameters of the particles (Table 4). The GNPs formed using PuG extract exhibited a lower zeta potential, indicating that they were less stable and thus had a higher tendency to aggregate and form larger particles. The zeta potentials for all the samples were measured again after 1, 2, and 3 weeks and showed negligible variations, except for small fluctuations that were within the variance of the data as shown in Table 5. The nearly constant zeta potential over 4 weeks suggests that most of the GNPs did not aggregate and were quite stable, in accordance with the stability found in the DLS measurements (Figure 7).
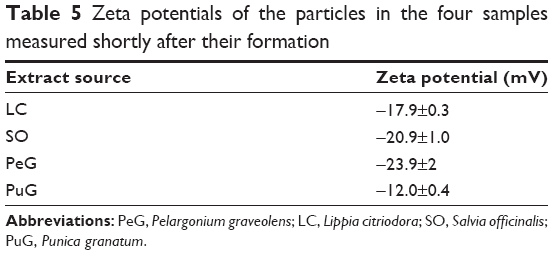 | Table 5 Zeta potentials of the particles in the four samples measured shortly after their formation |
GNP shapes
TEM images of the GNPs formed by the four extracts showed the existence of particles with a wide variety of shapes and sizes. The smaller detected particles, starting from ~10 nm in size, had nearly spherical/triangular shapes, while the larger particles, 150 nm in size, exhibited various geometrical shapes, such as triangles, truncated triangles, pentagons and hexagons. This variety of geometrical shapes is typical of GNPs and has been described in the literature.30–34 Several TEM images are presented in Figure 8 as examples of the GNP shapes formed when the different plant extracts were used. In some cases, these shapes corresponded to single crystals, as can be deduced from their diffraction patterns, eg, Figure 8B, and C. Since the TEM images show only a few particles in each picture, statistically reliable distributions of these shapes and sizes cannot be evaluated. The variety of particle shapes observed in Figure 8A, and D is expected to be manifested in the position of the UV-vis absorption peak of the GNPs (Figure 1).35 However, as shown in Figure 4B, the amount of large particles was negligible compared to that of small particles (diameters less than 10 nm). Therefore, the position of the absorption peak was dictated by the majority of small particles. Indeed, the increased particle size for PuG led to a shift of the absorption peak to a longer wavelength, as expected.
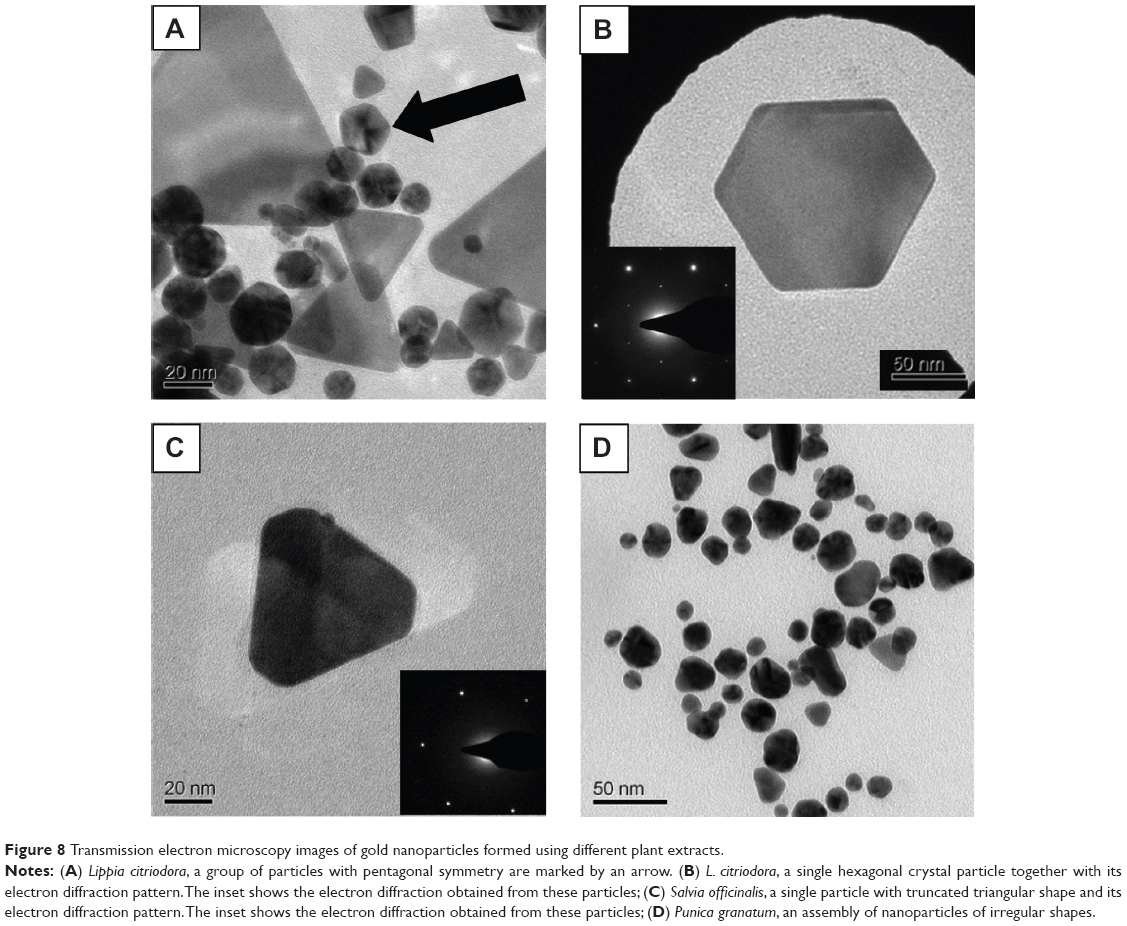 | Figure 8 Transmission electron microscopy images of gold nanoparticles formed using different plant extracts. |
GNP biocompatibility
One of the main goals in this study was to synthesize GNPs for potential applications in biomedical systems, and thus their biocompatibility was examined. The correlation between L-cell growth rate in cell culture together in the presence of different amounts of GNPs was used as a measure of biocompatibility. Therefore, volumes of 1, 10, and 100 μL GNP suspensions were synthesized using the four plant extracts, which were added to petri dishes containing L-cell cultures. The cells were counted after 24, 48, and 72 hours. The growth curves obtained in the presence of three GNP amounts that were checked were in all cases practically identical to the control curve (ie, cell culture without GNPs). Typical growth curves obtained with addition of GNPs synthesized using LC extract are shown in Figure 9. Very similar results were obtained for the other colloid suspensions synthesized using the other plant extracts. These results demonstrate excellent biocompatibility of all the GNPs with the L-cells.
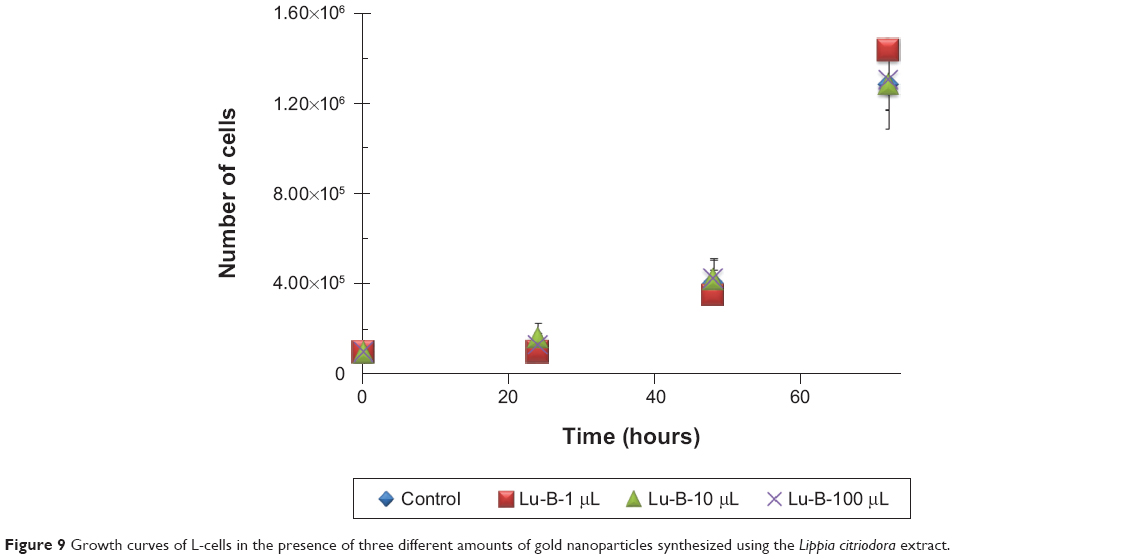 | Figure 9 Growth curves of L-cells in the presence of three different amounts of gold nanoparticles synthesized using the Lippia citriodora extract. |
Discussion and conclusion
GNPs are usually produced by the addition of a reducing agent to a solution of chloroaurate ions (AuCl4−), causing reduction of the gold ions and aggregation of the Au atoms into GNPs. Different organic compounds are usually added to form a protective layer on the surface of the GNPs, thus preventing their aggregation into larger particles. The present study describes a “green chemistry” synthesis of GNPs using environment-friendly reagents. We examined the activity as reducing and protecting agents of extracts from four common plants: LC, SO, PeG, and PuG. The GNPs obtained were thoroughly studied, and their size, shape, spectral characteristics, and biocompatibility were examined. As a first step to shed light on the synthesis of the GNPs, we tried to identify possible ingredients in the plant extracts that could serve as reducing agents. Therefore, a thorough literature survey was done to find the main antioxidants that were identified in the four plants used here. Since a large number of such compounds were found, we chose nine that were found to exhibit relatively large concentrations, which are water-soluble and are available commercially (Table 6). These antioxidants were tested as reducing agents in the synthesis of GNPs. Five compounds that were obtained as powders were dissolved in water, and their solutions were used in the synthesis. The other four reagents were obtained as solutions in organic solvents and used as obtained. The synthesis was carried out by mixing the antioxidant solution with the HAuCl4 solution, in the same proportions as the plant extracts, under magnetic stirring. In all cases, except for gallic acid, slight heating was required to temperatures in the range of 35°C–40°C. Seven of these compounds were found to serve as good reducing agents and led to the formation of GNPs. This suggests that these antioxidants might also play an active role in the synthesis when the corresponding plant extracts are used.
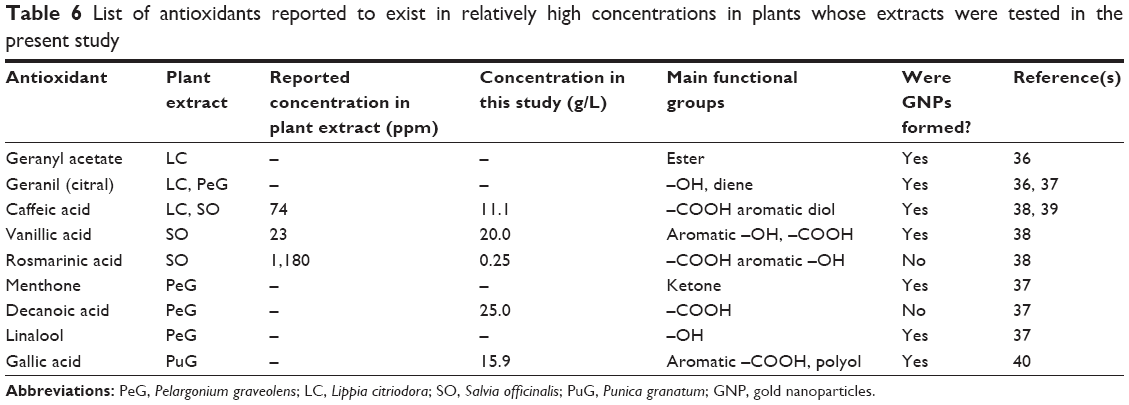 | Table 6 List of antioxidants reported to exist in relatively high concentrations in plants whose extracts were tested in the present study |
Two of the antioxidants, rosmarinic and decanoic acid, did not yield any GNPs. The concentration of the rosmarinic acid solution was much lower than the concentrations of the other antioxidants, due to its limited solubility in water. The concentration of the decanoic acid solution in the plant extract was not determined in the literature, probably due to its low solubility. It is unlikely that these two antioxidants are incapable of reducing AuCl4− ions; most probably, their concentrations in our experiments were insufficient.
The FTIR measurements reported in Table 2 were carried out in an attempt to obtain information about the nature of the organic protection layer that surrounds the GNPs. Based on similar analysis in the literature,41–47 it is suggested that the large shifts of some peaks in the spectra following GNP formation are due to the influence of the nearby metal surface. Therefore, the shifted peaks, listed in Table 2, are assumed to be associated with the organic matter around the GNPs formed during their synthesis. This information is very valuable for the design of functionalization procedures if one wants to use the particles for drug delivery. The geometrical characterization of the organic layer surrounding the GNPs are discussed later.
Measurements of particle size-distributions of the GNPs obtained using the different plant extracts were done by three different methods. However, only DLS is capable of detecting the existence of particles smaller than 10 nm. The agreement between the results obtained by the optical methods was excellent for three samples (LC, SO, and PeG), but for PuG the average results differed by a factor of 2.4. Analysis of the SEM images yielded smaller average values by approximately a factor of 2 for LC, SO, and PeG, while the discrepancy for PuG reached a factor of 4.
There are several issues that should be noted about the different methods for particle-size measurement and comparison between results. First, DLS can be used as a quantitative method only when normalization values for NPs of a given size are known. Unfortunately, this was not the case in the present study. Therefore, the quantitative assignment of particle amounts for the observed peaks is approximate. One can use a simple Rayleigh scattering model to convert light intensity into number of particles. After such a conversion, one finds that although over 90% of the light intensity is related to the peak that corresponds to the larger particles, in the particle-weighted description, the peak of the small particles corresponds to over 95% of the particles. Therefore, we can quite safely assume that most of our GNPs belonged to the 1–8 nm group, which can be detected only by DLS measurements. Approaches based on NTA and SEM measurements are limited to detection of particles that are larger than ~20 nm and ~10 nm, respectively. Another point to note is that the DLS method yields estimates of hydrodynamic diameters, which might be different from the apparent geometrical diameters obtained in SEM measurements. This is due to the large contrast between the GNPs and their surroundings, which is much larger than the contrast between the organic layers surrounding the GNPs and the environment. Therefore, particle-size distribution obtained from SEM images is expected to shift towards smaller values than distributions obtained using light-scattering techniques. Indeed, the organic layers surrounding the GNPs can be observed by TEM. However, TEM images contain only a few particles, and thus do not provide statistically significant data.
In spite of the differences between the size-distribution results obtained by the two optical methods, it is clear that the particles formed using LC, SO, and PeG extracts were of comparable sizes, whereas those formed using PuG extracts were larger. Since the HAuCl4 solution used was of the same concentration in all cases (0.1 g/L), the reason for this size variance must be in the extract composition. Three factors may influence this outcome: the ion-reduction rate with the different extracts, the concentrations of the reducing agents in the extracts, and the identity and concentration of the protecting agents in each extract. These three factors influence the rate of particle formation, the zeta potentials and the rates of agglomeration. The similarity between the particle-size distributions in three cases together with examination of the antioxidants described (Table 6) reveals that most of the antioxidants examined are in more than one of the plant extracts. However, gallic acid existed only in the PuG extract. Therefore, it is possible that due to the high reduction rate of this compound, when PuG extract was used, the rapid Au-atom production resulted in the formation of larger particles. A typical TEM image of a single GNP obtained using the SO extract is shown in Figure 10. A halo can be clearly seen around the NP. Since the TEM images were obtained using a dried droplet, it is not clear whether the hallo seen is indeed the actual protecting layer around the particle or if it is an artifact that was formed when the droplet was drying and shrinking around the particle. Similar organic layers were observed in numerous TEM images, all of them with a similar width of about 3–4 nm. This suggests that the layer seen is indeed the size of the protection layers around the GNPs in our system.
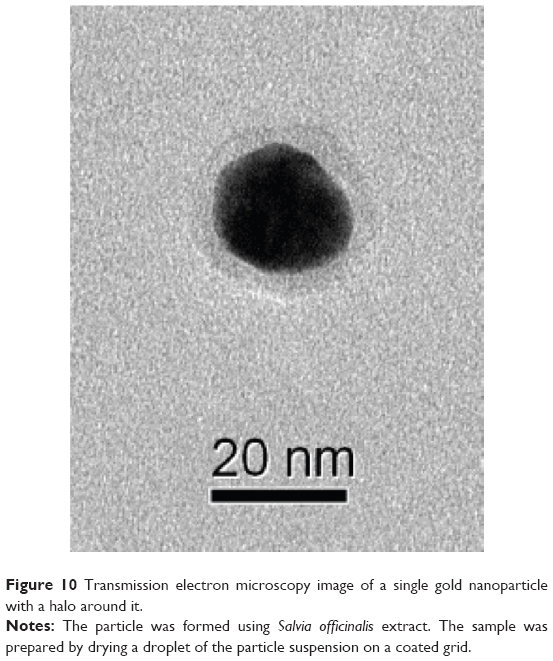 | Figure 10 Transmission electron microscopy image of a single gold nanoparticle with a halo around it. |
Two additional important properties of the GNPs were examined in this work: their biocompatibility and their stability. It was found that the presence of all four sources of GNPs examined here did not have any measurable negative influence on the normal growth of L-cells. Measurements of particle-size distribution and zeta potentials over a period of 4 weeks showed mostly constant values, which indicates the stability of all the particles examined.
Disclosure
The authors report no conflicts of interest in this work.
References
Daniel MC, Astruc D. Gold nanoparticles: assembly, supramolecular chemistry, quantum-size-related properties, and applications toward biology, catalysis, and nanotechnology. Chem Rev. 2004;104(1): 293–346. | ||
Zhang L, Gu FX, Chan JM, Wang AZ, Langer RS, Farokhzad OC. Nanoparticles in medicine: therapeutic applications and developments. Clin Pharm Ther. 2007;83(5):761–769. | ||
Mieszawska AJ, Mulder WJ, Fayad ZA, Cormode DP. Multifunctional gold nanoparticles for diagnosis and therapy of disease. Mol Pharm. 2013;10(3):831–847. | ||
Cho K, Wang XU, Nie S, Shin DM. Therapeutic nanoparticles for drug delivery in cancer. Clin Cancer Res. 2008;14(5):1310–1316. | ||
Kumar A, Zhang X, Liang XJ. Gold nanoparticles: emerging paradigm for targeted drug delivery system. Biotechnol Adv. 2013;31(5): 593–606. | ||
Salata OV. Applications of nanoparticles in biology and medicine. J Nanobiotechnology. 2004;2(1):3. | ||
Giljohann DA, Seferos DS, Daniel WL, Massich MD, Patel PC, Mirkin CA. Gold nanoparticles for biology and medicine. Angew Chem Int Ed Engl. 2010;49(19):3280–3294. | ||
Hartung GA, Mansoori GA. In vivo general trends, filtration and toxicity of nanoparticles. J Nanomater Mol Nanotechnol. 2013;2(3):1–21. | ||
Wang AZ, Langer R, Farokhzad OC. Nanoparticle delivery of cancer drugs. Annu Rev Med. 2012;63:185–198. | ||
Ghosh P, Han G, De M, Kim CK, Rotello VM. Gold nanoparticles in delivery applications. Ad Drug Deliv Rev. 2008;60(11):1307–1315. | ||
Salam HA, Rajiv P, Kamaraj M, Jagadeeswaran P, Gunalan S, Sivaraj R. Plants: green route for nanoparticle synthesis. Int Res J Biol Sci. 2012;1(5):85–90. | ||
Shukla D, Vankar PS. Synthesis of plant parts mediated gold nanoparticles. Int J Green Nanotechnol. 2012;4(3):277–288. | ||
Mittal AK, Chisti Y, Banerjee UC. Synthesis of metallic nanoparticles using plant extracts. Biotechnol Adv. 2013;31(2):346–356. | ||
Vankar PS, Bajpai D. Preparation of gold nanoparticles from Mirabilis jalapa flowers. Indian J Biochem Biophys. 2010;47(3):157–160. | ||
Das SK, Marsili E. A green chemical approach for the synthesis of gold nanoparticles: characterization and mechanistic aspect. Rev Environ Sci Biotechnol. 2010;9(3):199–204. | ||
Raveendran P, Fu J, Wallen SL. A simple and “green” method for the synthesis of Au, Ag, and Au-Ag alloy nanoparticles. Green Chem. 2006;8(1):34–38. | ||
Wang Z, Zhang Q, Kuehner D, Ivaska A, Niu L. Green synthesis of 1–2 nm gold nanoparticles stabilized by amine-terminated ionic liquid and their electrocatalytic activity in oxygen reduction. Green Chem. 2008;10(9):907–909. | ||
Huang X, Wu H, Liao X, Shi B. One-step, size-controlled synthesis of gold nanoparticles at room temperature using plant tannin. Green Chem. 2010;12(3):395–399. | ||
Sharma RK, Gulati S, Mehta S. Preparation of gold nanoparticles using tea: a green chemistry experiment. J Chem Educ. 2012;89(10): 1316–1318. | ||
Suman TY, Radhika Rajasree SR, Ramkumar R, Rajthilak C, Perumal P. The green synthesis of gold nanoparticles using an aqueous root extract of Morinda citrifolia L. Spectrochim Acta A Mol Biomol Spectrosc. 2014;118:11–16. | ||
Shankar SS, Ahmad A, Pasricha R, Sastry M. Bioreduction of chloroaurate ions by geranium leaves and its endophytic fungus yields gold nanoparticles of different shapes. J Mater Chem. 2003;13(7):1822–1826. | ||
Basavegowda N, Sobczak-Kupiec A, Fenn RI, Dinakar S. Bioreduction of chloroaurate ions using fruit extract Punica granatum (pomegranate) for synthesis of highly stable gold nanoparticles and assessment of its antibacterial activity. Micro Nano Lett. 2013;8(8):400–404. | ||
Fierascu RC, Ion RM, Dumitriu I. Noble metals nanoparticles synthesis in plant extracts. Optoelectron Adv Mater Rapid Commun. 2010;4(9):1297–1300. | ||
Cruz D, Falé PL, Mourato A, Vaz PD, Serralheiro ML, Lino AR. Preparation and physicochemical characterization of Ag nanoparticles biosynthesized by Lippia citriodora (lemon verbena). Colloids Surf B Biointerfaces. 2010;81(1):67–73. | ||
Provencher SW. CONTIN: a general purpose constrained regularization program for inverting noisy linear algebraic and integral equations. Comput Phys Commun. 1982;27(3):229–242. | ||
Roduit N. JMicroVision: image analysis toolbox for measuring and quantifying components of high-definition images. Version 1.2.7. 2008. Available from: http://www.jmicrovision.com. Accessed June 16, 2014. | ||
Haiss W, Thanh NT, Aveyard J, Fernig DG. Determination of size and concentration of gold nanoparticles from UV-vis spectra. Anal Chem. 2007;79(11):4215–4221. | ||
ASTM International. Standard test methods for zeta potential of colloids in water and waste water. The Annual Book of ASTM Standards. Vol D. West Conshohocken (PA): ASTM International; 1985:4182–4187. | ||
Salopek B, Krasiọć D, Filipoviọć S. Measurement and application of zeta potential. Rud Geol Naft Zb. 1992;4:147–151. | ||
Ascencio JA, Pérez M, José-Yacamán M. A truncated icosahedral structure observed in gold nanoparticles. Surf Sci. 2000;447(1):73–80. | ||
Chen R, Wu J, Li H, Cheng G, Lu Z, Che CM. Fabrication of gold nanoparticles with different morphologies in HEPES buffer. Rare Metals. 2010;29(2):180–186. | ||
Cornejo-Monroy D, Acosta-Torres LS, Moreno-Vega AI, Saldana C, Morales-Tlalpan V, Castaño VM. Gold nanostructures in medicine: past, present and future. J Nanosci Lett. 2013;3:25. | ||
Foss CA Jr, Hornyak GL, Stockert JA, Martin CR. Template-synthesized nanoscopic gold particles: optical spectra and the effects of particle size and shape. J Phys Chem. 1994;98(11):2963–2971. | ||
Tsuji M, Hikino S, Tanaka I, et al. Shape and size controlled synthesis of gold nanocrystals using oxidative etching by AuCl4-and Cl-anions in microwave-polyol process. Colloids Surf A Physicochem Eng Asp. 2007;302(1–3):587–598. | ||
Kumar KM, Mandal BK, Sinha M, Krishnakumar V. Terminalia chebula mediated green and rapid synthesis of gold nanoparticles. Spectrochim Acta A Mol Biomol Spectrosc. 2012;86:490–494. | ||
Pereira CG, Meireles MA. Evaluation of global yield, composition, antioxidant activity and cost of manufacturing of extracts from lemon verbena (Aloysia triphylla [l’Hérit] Britton) and mango (Mangifera indica L.) leaves. J Food Process Eng. 2007;30(2):150–173. | ||
Cavar S, Maksimović M. Antioxidant activity of essential oil and aqueous extract of Pelargonium graveolens l’Her. Food Control. 2012;23(1):263–267. | ||
Zheng W, Wang SY. Antioxidant activity and phenolic compounds in selected herbs. J Agric Food Chem. 2001;49(11):5165–5170. | ||
Bilia AR, Giomi M, Innocenti M, Gallori S, Vincieri FF. HPLC-DAD-ESI-MS analysis of the constituents of aqueous preparations of verbena and lemon verbena and evaluation of the antioxidant activity. J Pharm Biomed Anal. 2008;46(3):463–470. | ||
Gil MI, Tomás-Barberán FA, Hess-Pierce B, Holcroft DM, Kader AA. Antioxidant activity of pomegranate juice and its relationship with phenolic composition and processing. J Agric Food Chem. 2000;48(10): 4581–4589. | ||
Annamalai A, Babu ST, Jose NA, Sudha D, Lyza CV. Biosynthesis and characterization of silver and gold nanoparticles using aqueous leaf extraction of Phyllanthus amarus Schum. and Thonn. World Appl Sci J. 2011;13:1833–1840. | ||
Guan XH, Chen GH, Shang C. ATR-FTIR and XPS study on the structure of complexes formed upon the adsorption of simple organic acids on aluminum hydroxide. J Environ Sci (China). 2007;19(4):438–443. | ||
Naiya TK, Singha B, Das SK. FTIR study for the Cr (VI) removal from aqueous solution using rice waste. Int Proc Chem Biol Environ Eng. 2011;10:114–119. | ||
Nikolić GS, Cakić MD. Analysis of bioactive olygosaccharide-metal complexes by modern FTIR spectroscopy: copper complexes. In: Nikolić GS, editor. Fourier Transforms – New Analytical Approaches and FTIR Strategies. Rijeka, Croatia: InTech; 2011. | ||
Shi W, Sahoo Y, Swihart MT. Gold nanoparticles surface-terminated with bifunctional ligands. Colloids Surf A Physicochem Eng Asp. 2004; 246(1):109–113. | ||
Tu WX, Zuo XB, Liu HF. Study on the interaction between polyvinylpyrrolidone and platinum metals during the formation of the colloidal metal nanoparticles. Chin J Poly Sci. 2008;26:23–29. | ||
Zhang HL, Evans SD, Henderson JR, Miles RE, Shen T. Spectroscopic characterization of gold nanoparticles passivated by mercaptopyridine and mercaptopyrimidine derivatives. J Phys Chem B. 2003;107(25): 6087–6095. |
 © 2014 The Author(s). This work is published and licensed by Dove Medical Press Limited. The full terms of this license are available at https://www.dovepress.com/terms.php and incorporate the Creative Commons Attribution - Non Commercial (unported, v3.0) License.
By accessing the work you hereby accept the Terms. Non-commercial uses of the work are permitted without any further permission from Dove Medical Press Limited, provided the work is properly attributed. For permission for commercial use of this work, please see paragraphs 4.2 and 5 of our Terms.
© 2014 The Author(s). This work is published and licensed by Dove Medical Press Limited. The full terms of this license are available at https://www.dovepress.com/terms.php and incorporate the Creative Commons Attribution - Non Commercial (unported, v3.0) License.
By accessing the work you hereby accept the Terms. Non-commercial uses of the work are permitted without any further permission from Dove Medical Press Limited, provided the work is properly attributed. For permission for commercial use of this work, please see paragraphs 4.2 and 5 of our Terms.