")
Back to Journals » Neuropsychiatric Disease and Treatment » Volume 11
Global and regional brain volumes normalization in weight-recovered adolescents with anorexia nervosa: preliminary findings of a longitudinal voxel-based morphometry study
Authors bomba M , riva A, Morzenti S, Grimaldi M, neri F, Nacinovich R
Received 26 August 2014
Accepted for publication 9 October 2014
Published 9 March 2015 Volume 2015:11 Pages 637—645
DOI https://doi.org/10.2147/NDT.S73239
Checked for plagiarism Yes
Review by Single anonymous peer review
Peer reviewer comments 2
Editor who approved publication: Dr Roger Pinder
Monica Bomba,1,* Anna Riva,1,* Sabrina Morzenti,2 Marco Grimaldi,3 Francesca Neri,1 Renata Nacinovich1
1Child and Adolescent Mental Health Department, San Gerardo Hospital, University of Milano-Bicocca, Monza, Italy; 2Medical Physics Department, San Gerardo Hospital, Monza, Italy; 3Department of Radiology, Humanitas Research Hospital, Milan, Italy
*These authors contributed equally to this work
Abstract: The recent literature on anorexia nervosa (AN) suggests that functional and structural abnormalities of cortico-limbic areas might play a role in the evolution of the disease. We explored global and regional brain volumes in a cross-sectional and follow-up study on adolescents affected by AN. Eleven adolescents with AN underwent a voxel-based morphometry study at time of diagnosis and immediately after weight recovery. Data were compared to volumes carried out in eight healthy, age and sex matched controls. Subjects with AN showed increased cerebrospinal fluid volumes and decreased white and gray matter volumes, when compared to controls. Moreover, significant regional gray matter decrease in insular cortex and cerebellum was found at time of diagnosis. No regional white matter decrease was found between samples and controls. Correlations between psychological evaluation and insular volumes were explored. After weight recovery gray matter volumes normalized while reduced global white matter volumes persisted.
Keywords: anorexia nervosa, adolescent, gray matter, insula, voxel-based morphometry study
Introduction
Anorexia nervosa (AN) is a psychiatric disorder of unknown etiology that typically tends to affect female adolescents and is characterized by restricted eating, severe weight loss, relentless pursuit of thinness, and obsessive fears of becoming fat.1 Most common complications include severe alterations of the brain and peripheral-organs.2–4 It is however unclear whether these changes are the cause or the consequence of malnutrition and weight loss. Kaye et al5 distinguished the neurobiological alterations in AN into two categories: trait-related and state-related. Trait-related include premorbid, genetically-determined alterations that seem to contribute to a vulnerability to develop the illness, and state-related are alterations secondary to malnutrition that might sustain and perhaps accelerate the illness. Recent literature on the etiology of AN suggests a pathogenetic role of functional and structural abnormalities of cortico-limbic structures but actually it is still not clear whether these alterations are primary or secondary to malnutrition.6–8
Kaye et al5 described a dysfunction of two neurocircuits that might be of particular interest in AN: a ventral (limbic) neurocircuit (amygdala, insula, ventral striatum and ventral regions of the anterior cingulate cortex and the orbitofrontal cortex), important for recognizing the emotional significance of stimuli and for creating an effective response to them, and a dorsal (cognitive) neurocircuit (hippocampus, dorsal regions of the anterior cingulate cortex, dorsolateral prefrontal cortex, parietal cortex, and other regions) that is implicated in modulating selective attention, planning an effortful regulation of affective states.
Brain structural alterations in AN include global and regional volume reductions. Most studies are still conducted on adults with AN and not on adolescents. Previous neuroimaging studies in adolescents with AN that have used a classical or voxel-based morphometry (VBM) technique show global gray matter (GM) and white matter (WM) reduction and an increase in cerebrospinal fluid (CSF) volumes,9,10 while others did not confirm GM11,12 or WM decrease.13 Use of VBM in AN during the acute phase of the illness allows to describe regional GM decreases in different cerebral areas.14 In adolescents with AN, the GM of the posterior (temporal and parietal) regions of the brain seem to be the most affected.13 In particular, in adolescents with AN of the restrictive type, a region-specific bilateral volume decrease of GM in middle cingulate cortex, precuneus, and inferior and superior parietal lobules, was described.15 The entity of global brain atrophy seems to be correlated not with the low body weight itself or to disease duration but with the degree of weight loss and the timetable in which it occurs.16 Overall GM alterations are reversible after weight restoration, but it is still not clear whether reversibility is complete.9–19 Pathogenetic mechanisms of cerebral alterations are not still completely explained and current hypotheses include: i) decreased serum proteins resulting in decreased colloidal osmotic pressure and a shift of fluid from the intravascular space into the subarachnoid spaces;20 ii) partial regeneration of damaged neurons and their axons with possible regeneration of myelin;21 iii) loss of lean body tissue mass;22 iv) increased urine and serum cortisol levels;23 and v) decreased protein synthesis resulting in loss of dendritic spines, a reduction in the number of synaptic junctions, and delayed synaptogenesis.10
The aim of our study, in contrast to other published longitudinal research carried out in adolescents affected by AN, is to analyze, using volumetric magnetic resonance imaging (MRI) and VBM, regional and global brain volumes at time of diagnosis and immediately after weight recovery in order to evaluate not only the degree of restoration of brain volumes but also the timetable in which these changes occur.
Materials and methods
Participants
Eleven girls, aged 11–17, who fulfilled the Diagnostic and Statistical Manual of Mental Disorders, fourth Edition, Text Revision diagnostic criteria for AN restricting type were enrolled in a period of 6 months. They were all new patients of the Eating Disorders Unit of the Child and Adolescent Mental Health Department, at the San Gerardo Hospital, University of Milano Bicocca (Monza, Italy). Five patients refused to participate in the study and two patients dropped out of the study before the radiological re-evaluation. Clinical variables such as age, body-mass-index (BMI), age of AN onset, disease duration, the presence of primary/secondary amenorrhea were evaluated by means of a clinical interview. Mean disease duration was 14.45 months (standard deviation [SD] =10.92). Eating Disorders Inventory 3 (EDI-3)24 was administered at admission to all participants and Hollingshead 4-factor index was carried out as a measure of socio-economical status. A normal academic performance and a normal IQ was reported for all the girls enrolled. Patients did not have any concomitant medical diseases or psychiatric comorbidity and no prenatal/perinatal/postnatal cerebral suffering was reported.
Eight age-matched girls without psychiatric disorders were also enrolled as controls.
Parents and participants were told the purpose of the study and a written informed consent to participate was obtained. The research was reviewed and approved by an institutional review board.
Procedures
MRI data acquisition
Each subject underwent two high-resolution T1-weighted MRI scans at time of diagnosis and immediately after weight recovery. Acquisition consists of a set of 160 adjacent sagittal images with a slice thickness of 1 mm and pixel size of 0.94×0.94 mm, using spoiled gradient echo sequence.
All MRI data were acquired on a 1.5T Achieva Philips scanner using the same parameters (TR =25 ms, TE =4.6 ms, FOV =240 mm, matrix =256×256) according to strictly standardized procedures.
MRI data analysis
Image analyses were performed using the VBM25 and the IBASPM (Individual Brain Atlas using Statistical Parametric Mapping)26 toolboxes as part of SPM5 (Statistical Parametric Mapping software package version 5; Wellcome Department of Cognitive Neurology, Institute of Neurology, London); all running in MATLAB version 7.5.0.
Since subjects ranged from 12 to 17 years old, two customized T1 templates were used rather than the standard Montréal Neurological Institute template as the reference stereotactic space for the pre-processing analysis. In particular a T1 template in the pre-adolescent age (12–14 years) and one in the adolescent age (14–19 years) was generated using the TOM (Template-O-Matic; https://irc.cchmc.org/software/tom.php) toolbox of SPM5;27 it comes with data allowing the creation of pediatric templates and tissue maps based on the objective 404 NIH data in the age range of 5–18 years.
Morphometric analysis
The VBM toolbox (http://dbm.neuro.uni-jena.de/vbm),25 used to investigate the morphometric changes between the patient group and control group, increases the quality of segmentation by applying a hidden Markov random field model on the unified segmentation approach of SPM. The pre-processing of the magnetic resonance images included the following steps: bias field correction, tissue classification and registration using non-linear transformations. In order to account for the shrinkage or growth of brain regions following the nonlinear spatial normalization step and to analyze volume differences between the various groups, the different tissue maps (GM, WM, and CSF) were modulated with the Jacobian determinants of the deformation parameters derived by normalization to the T1 template. The modulated GM images were smoothed with an 8 mm FWHM Gaussian kernel.
Two two-sample Student’s t-tests were performed on GM and WM modulated images to look for local volume differences between controls and anorexic patients and to determine GM and WM areas significantly greater in the first group, separately analyzing baseline and follow-up. Data were generated at P<0.001 uncorrected and for cluster sizes larger than 2,000 contiguous voxels (2 cm3) using a cut-off of P<0.05 family-wise error correction for multiple comparisons.
The anatomical localization was done using projection onto the T1 customized template. Labels and the corresponding percentage of voxels belonging to the labeled regions were obtained for each significant cluster using the Automated Anatomical Labeling (AAL) Toolbox (http://www.gin.cnrs.fr/spip.php?article217&lang=en)28 of SPM5.
Volume computation
The IBASPM toolbox (http://www.thomaskoenig.ch/Lester/ibaspm.htm)25 was used to calculate the volume of the anatomical region identified with the VBM analysis. IBASPM toolbox uses the segmentation and spatial normalization routines of SPM to perform the automatic volume computation of GM back into the individual anatomy space.
Each normalized individual GM voxel is anatomically labeled, based on an AAL Toolbox atlas of predefined structures. Taking into account the transformation matrix obtained in the normalization process an individual brain atlas that consisted of 116 different GM areas was created for each subject. The volume of each identified structure was calculated with the IBASPM volume statistic function.
Statistical analysis
All continuous variables were expressed as mean ± SD. The Mann–Whitney U-test was used to compare partial volumes (GM, WM, and CSF), and clinical variables between patients and controls at admission and 1 month after weight recovery. Data and results obtained from the comparison of first assessment and follow-up were processed with analysis of variance (ANOVA).
Correlations between left insular volumes and EDI-3 scores were evaluated using the Spearman non-parametric correlation. The level of significance was set at P<0.05. Statistical analysis was performed using the SPSS 20 (IBM Corporation, Armonk, NY, USA), statistical package for social sciences.
Results
Comparison between anorexic patients and controls at first assessment
The socio-demographic features and BMI, adjusted for sex and age according to the tables for Italian children and adolescents of Cacciari et al29 of participants with AN and controls are summarized in Table 1. Three girls with AN presented primary amenorrhea, eight girls presented secondary amenorrhea. All girls suffered from restrictive type-AN. The EDI-3 profiles in the two groups are described in Table 2.
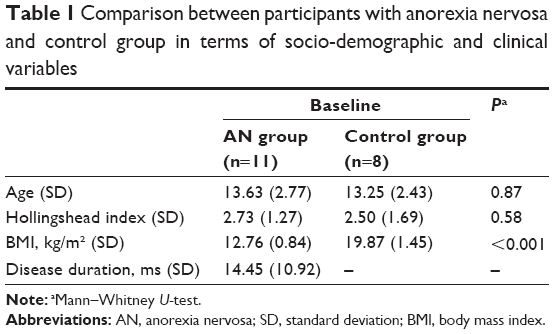 | Table 1 Comparison between participants with anorexia nervosa and control group in terms of socio-demographic and clinical variables |
 | Table 2 Comparison between participants with anorexia nervosa at first evaluation and control group in EDI-3 scores |
Differences were found in WM, GM, and CSF volumes, when comparing the two groups (Table 3): participants with AN showed reduced GM and WM volumes and higher CSF volumes than controls. In the regional VBM study at first evaluation several areas of decreased GM were detected in anorexic patients (Table 4; Figure 1). Statistically significant clusters were found bilaterally in cerebellum, left insula, right superior occipital cortex, right inferior parietal lobule, right and left precentral and post central gyrus, and left superior temporal lobule.
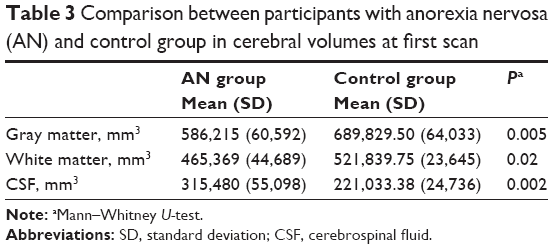 | Table 3 Comparison between participants with anorexia nervosa (AN) and control group in cerebral volumes at first scan |
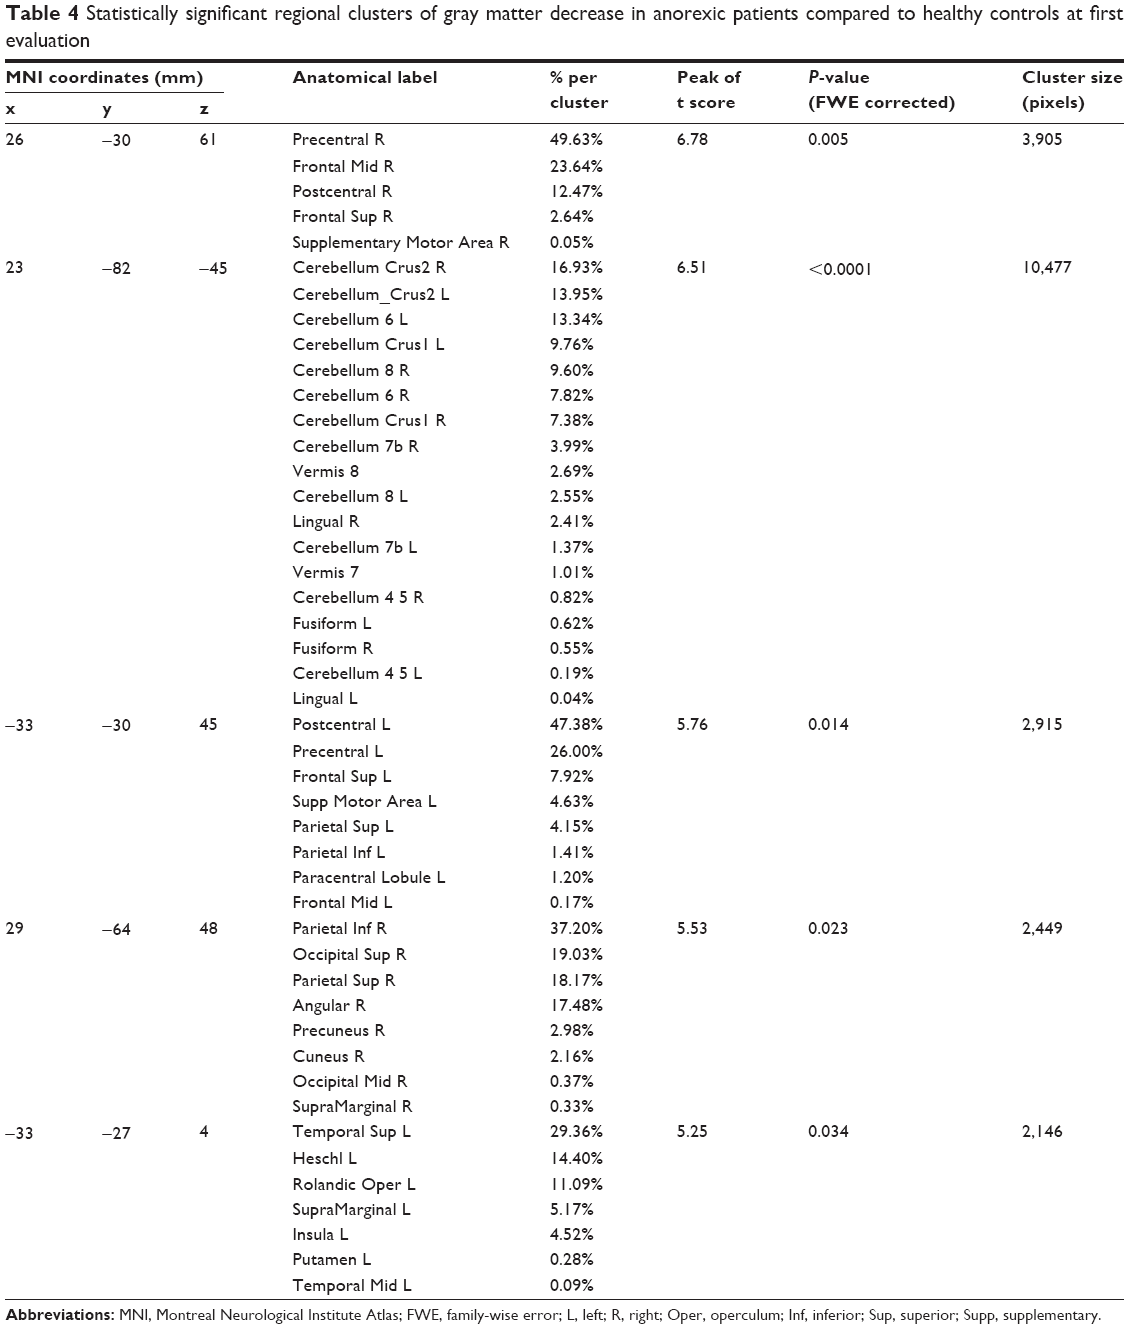 | Table 4 Statistically significant regional clusters of gray matter decrease in anorexic patients compared to healthy controls at first evaluation |
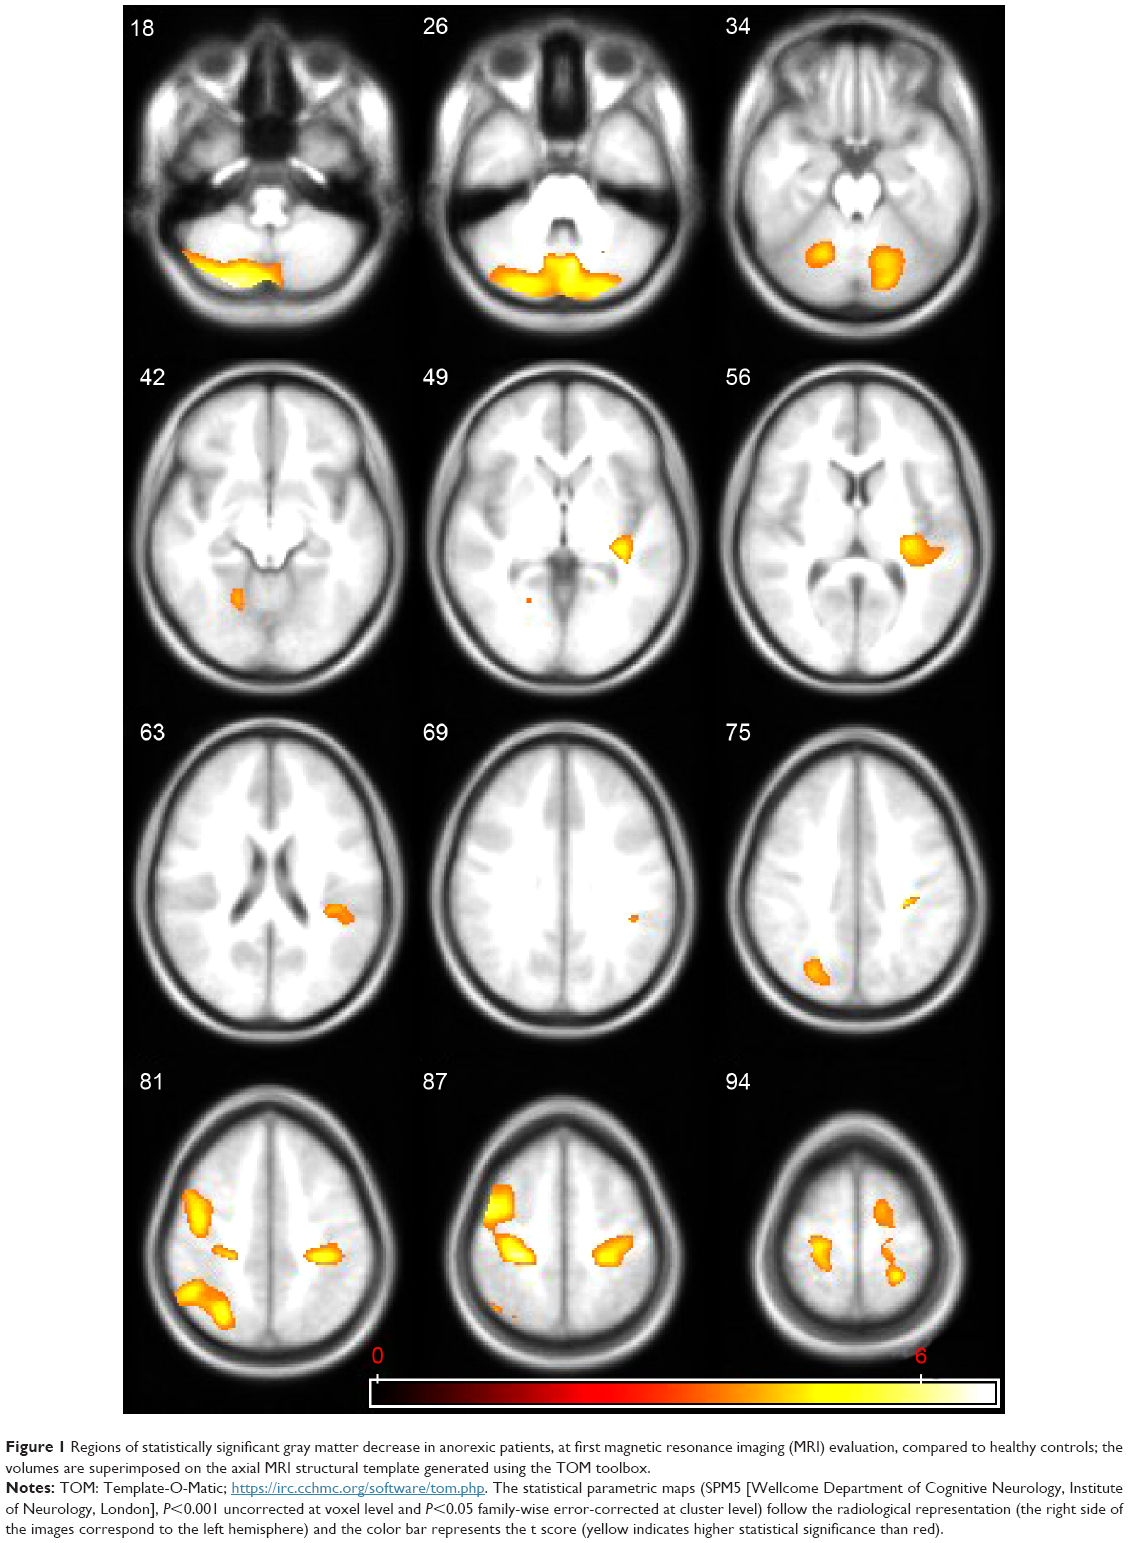 | Figure 1 Regions of statistically significant gray matter decrease in anorexic patients, at first magnetic resonance imaging (MRI) evaluation, compared to healthy controls; the volumes are superimposed on the axial MRI structural template generated using the TOM toolbox. |
Left insular volumes weakly correlated (P=0.051) with the composite low self-esteem scale of the EDI-3 test.24
No other correlations between other identified local volumes and EDI-3 scales were found.
No WM areas of decrease were identified in anorexic patients using VBM analysis.
Comparison between first assessment and follow-up
All patients followed our therapeutic program of medical and psychological care and re-feeding at our Eating Disorder Unit. One month after weight recovery all girls underwent another a high-resolution T1-weighted MRI scan. At the time of re-evaluation three patients with secondary amenorrhea presented with normal menses during the previous 3 months, and during the period of evaluation none of the patients took medications or manifested new medical or psychiatric comorbidity.
After weight recovery mean volumes of GM increased, and CSF decreased. No statistically significant difference was observed in WM (Table 5).
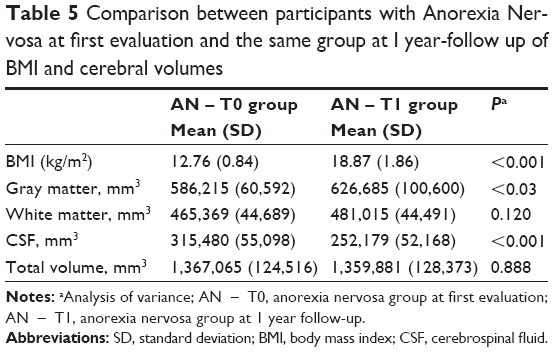 | Table 5 Comparison between participants with Anorexia Nervosa at first evaluation and the same group at I year-follow up of BMI and cerebral volumes |
Comparison between follow-up and controls
Table 6 describes the results of statistical analysis about BMI and volumetric measures comparing anorexic patients at follow-up with controls. The two groups did not differ significantly in mean BMI, global GM, CSF total volumes, while they differed in global WM volumes. The regional VBM study did not show statistically significant differences in GM and WM between the sample and controls.
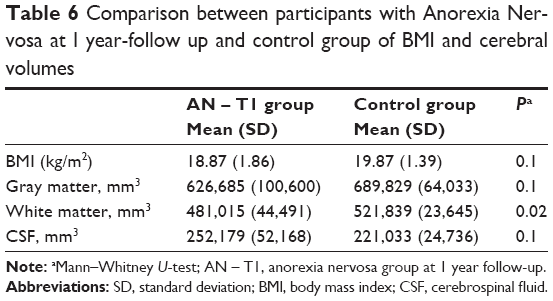 | Table 6 Comparison between participants with Anorexia Nervosa at I year-follow up and control group of BMI and cerebral volumes |
Discussion
According to the literature,12 girls with AN at first assessment displayed reduced GM and WM volumes and increased CSF volumes. These data differ from the only existing longitudinal study13 in which girls with AN with a higher BMI than that of our sample showed decreased GM and increased CSF volume, without the alteration of WM volumes. In adult patients with AN, a widening of cerebral sulci, enlarged lateral and third ventricle, and a decrease of the WM volume have been described.11 These changes were attributed to lipolysis of the lipids that form the bulk of myelin in both WM and GM and the reduced levels of IGF-1 have been considered responsible for it. Moreover, the reduction of the brain tissue mass would especially affect the WM due to its greater proportion of myelin.
One month after weight recovery the group of patients showed normalization of GM and CSF volumes, but not WM volume. This result is in contrast with two other studies conducted on weight-stabilized adolescents with AN: Golden et al10 showed a normalization of CSF volume only, while Castro-Fornieles13 and Lazaro30 of GM, WM and CSF volumes. Our result may suggest that GM and CSF are more sensitive than WM to weight gain and so they tend to normalize immediately after or before complete weight recovery. In a previous study16 conducted by our research group in a sample of adolescents affected by AN we proved that the degree of weight loss (deltaBMI) correlated inversely with the GM volume while the increase of CSF compartment correlated directly with the rapidity of weight loss. We hypothesized that a similar mechanism could sustain complete normalization of GM and CSF and not of WM volumes immediately after weight recovery.
Instead, VBM analysis between the sample group and controls at first evaluation defined different clusters of reduced GM volumes in cerebellum bilaterally, left insular cortex, right superior occipital cortex, bilateral superior and inferior parietal lobule, right precentral and postcentral gyrus, and left superior temporal cortex. Our results are similar to two other studies13–15 conducted on adolescents using the same technique but differ in cerebellum an insular cortex implications.
Decrease of GM volume in cerebellum has been described in studies on adults conducted with a classical31,32 and VBM technique.33 Cerebellar atrophy is described in anorexic patients and in alcoholics in which is correlated to electrolytic alterations, thiamine deficit, and reduced protein synthesis.34–36 Cerebellar involvement in AN is considered to be of particular interest; indeed, it is no longer believed to play a purely motor role; rather, its role in modulating higher order neural functions is now well accepted.37 Some authors hypothesized that some aspects of the AN psychopathology, such as ritualistic, stereotypical, ruminative and obsessive behaviors, and perseveration, could be due, at least in part, to a cerebellar dysfunction.12–37
Insular cortex volume reduction has been recently described in adults with AN 38 and in functional MRI studies39 but, to our knowledge, no studies were conducted in adolescent subjects with AN. The insula is part of the neural circuit, including the anterior cingulate cortex, involved in the analysis of the physiological feedback and all subjective findings from the body. Insula interoceptive processing contributes to the formation of an integrated sense of the physiological condition of the entire body and is crucial for the instantiation of the self-body representation. Altered interoceptive awareness might be a precipitating and reinforcing factor in anorexia.5
Moreover, the insula seems to be involved in the perception of body dissatisfaction in AN.40 Our finding of a correlation between left insular volumes and the composite low self-esteem scale of the EDI-3 test could represent a further confirmation of these hypotheses.
In our study we found only a significant difference in global WM volumes between weight recovered AN and controls but not in regional volumes. This result differs from the only existing longitudinal study13 conducted on adolescents in which, after 7 months’ follow-up, persisted in anorexic patients several reduced GM areas in right temporal and in both supplementary motor areas but differs also from data of another study30 conducted by the same Spanish group on adolescents with a past history of AN in which no differences in global and regional volumes were found in comparison with controls. If confirmed in further investigations, our result might support the hypothesis that GM restoration precedes WM restoration in adolescents with AN and that GM is more sensitive to weight gain.
The main limitations of the present work were the relatively small sample size and the absence of MRI re-evaluation in controls.
In conclusion, our study contributes to the discussion on brain alterations in adolescents with AN. Furthermore, our results support the hypothesis that global and regional GM decreases might be state-related and dependent on weight restoration. It will be interesting to see future studies with a larger sample size which will be able to evaluate correlations between speed and entity of weight gain and restoration of brain volumes.
Acknowledgments
We thank all the patients and families who took part in this study.
Disclosure
The authors have no conflicts of interest to disclose.
References
American Psychiatric Association, editor. Diagnostic and Statistical Manual of Mental Disorders Fourth Edition Text Revision DSM-VI-TR. American Psychiatric Association; 2000. | ||
Casiero D, Frishman WH. Cardiovascular complications of eating disorders. Cardiol Rev. 2006;14(5):227–231. | ||
Teng K. Premenopausal osteoporosis, an overlooked consequence of anorexia nervosa. Cleve Clin J Med. 2011;78(1):50–58. | ||
Warren MP. Endocrine manifestations in eating disorders. J Clin Endocrinol Metab. 2011;96(2):333–343. | ||
Kaye WH, Fudge JL, Paulus M. New insights into symptoms and neurocircuit function of anorexia nervosa. Nat Rev Neurosci. 2009;10(8):573–584. | ||
Wagner A, Aizenstein H, Venkatraman VK, et al. Altered reward processing in women recovered from anorexia nervosa. Am J Psychiatry. 2007;164(12):1842–1849. | ||
Frank GK. Advances in the diagnosis of anorexia nervosa and bulimia nervosa using brain imaging. Expert Opin Med Diagn. 2012;6(3):235–244. | ||
Dichter GS, Damiano CA, Allen JA. Reward circuitry dysfunction in psychiatric and neurodevelopmental disorders and genetic syndromes: animal models and clinical findings. J Neurodev Dis. 2012;4(1):19. | ||
Katzman DK, Lambe EK, Mikulis DJ, Ridgley JN, Goldbloom DS, Zipursky RB. Cerebral gray matter and white matter volume deficits in adolescent girls with anorexia nervosa. J Pediatr. 1996;129(6):794–803. | ||
Golden NH, Ashtari M, Kohn MR, et al. Reversibility of cerebral ventricular enlargement in anorexia nervosa, demonstrated by quantitative magnetic resonance imaging. J Pediatr. 1996;128(2):296–301. | ||
Swayze VW 2nd, Andersen AE, Andreasen NC, Arndt S, Sato Y, Ziebell S. Brain tissue volume segmentation in patients with anorexia nervosa before and after weight normalization. Int J Eat Disord. 2003;33(1):33–44. | ||
Boghi A, Sterpone S, Sales S, et al. In vivo evidence of global and focal brain alterations in anorexia nervosa. Psychiatry Res. 2011;192(3):154–159. | ||
Castro-Fornieles J, Bargalló N, Lázaro L, et al. A cross-sectional and follow-up voxel-based morphometric MRI study in adolescent anorexia nervosa. J Psychiatr Res. 2009;43(3):331–340. | ||
Van den Eynde F, Suda M, Broadbent H, et al. Structural magnetic resonance imaging in eating disorders: a systematic review of voxel-based morphometry studies. Eur Eat Disord Rev. 2012;20(2):94–105. | ||
Gaudio S, Nocchi F, Franchin T, et al. Gray matter decrease distribution in the early stages of Anorexia Nervosa restrictive type in adolescents. Psychiatry Res. 2011;191(1):24–30. | ||
Bomba M, Riva A, Veggo F, et al. Impact of speed and magnitude of weight loss on the development of brain trophic changes in adolescents with anorexia nervosa: a case control study. Ital J Pediatr. 2013;39(1):14. | ||
Katzman DK, Zipursky RB, Lambe EK, Mikulis DJ. A longitudinal magnetic resonance imaging study of brain changes in adolescents with anorexia nervosa. Arch Pediatr Adolesc Med. 1997;151(8):793–797. | ||
Kingston K, Szmukler G, Andrewes D, Tress B, Desmond P. Neuropsychological and structural brain changes in anorexia nervosa before and after refeeding. Psychol Med. 1996;26(1):15–28. | ||
Lambe EK, Katzman DK, Mikulis DJ, Kennedy SH, Zipursky RB. Cerebral gray matter volume deficits after weight recovery from anorexia nervosa. Arch Gen Psychiatry. 1997;54(6):537–542. | ||
Heinz ER, Martinez J, Haenggeli A. Reversibility of cerebral atrophy in anorexia nervosa and Cushing’s syndrome. J Comput Assist Tomogr. 1977;1(4):415–418. | ||
Artmann H, Grau H, Adelmann M, Schleiffer R. Reversible and non-reversible enlargement of cerebrospinal fluid spaces in anorexia nervosa. Neuroradiology. 1985;27(4):304–312. | ||
Datlof S, Coleman PD, Forbes GB, Kreipe RE. Ventricular dilation on CAT scans of patients with anorexia nervosa. Am J Psychiatry. 1986;143(1):96–98. | ||
Krieg JC, Lauer C, Pirke KM. Hormonal and metabolic mechanism in the development of cerebral pseudoatrophy in eating disorders. Psychother Psychosom. 1987;48(1–4):176–180. | ||
Garner DM. Eating Disorder Inventory – 3 (EDI-3). Italian version. Firenze: Giunti OS; 2008. | ||
Ashburner J, Friston KJ. Voxel-based morphometry – the methods. Neuroimage. 2000;11(6 Pt 1):805–821. | ||
Alemán-Gómez Y, Melie-García L, Valdés-Hernandez P. IBASPM: toolbox for automatic parcellation of brain structures. Presented at: the 12th Annual Meeting of the Organization for Human Brain Mapping; 2006; Florence, Italy. | ||
Wilke M, Holland SK, Altaye M, Gaser C. Template-O-Matic: A toolbox for creating customized pediatric templates. Neuroimage. 2008;41(3):903–913. | ||
Tzourio-Mazoyer N, Landeau B, Papathanassiou D, et al. Automated anatomical labelling of activations in SPM using a macroscopic anatomical parcellation of the MNI MRI single-subject brain. Neuroimage. 2002;15(1):273–289. | ||
Cacciari E, Milani S, Balsamo A, et al. Italian cross-sectional growth charts for height, weight and BMI (2 to 20 yr). J Endocrinol Invest. 2006;29(7):581–593. | ||
Lázaro L, Andrés S, Calvo A, et al. Normal gray and white matter volume after weight restoration in adolescents with anorexia nervosa. Int J Eat Disord. 2013;46(8):841–848. | ||
Addolorato G, Taranto C, Rossi G, Gasbarrini G. Neuroimaging of cerebral and cerebellar atrophy in anorexia nervosa. Psychiatry Res. 1997;76(2–3):139–141. | ||
Miwa H, Nakanishi I, Kodama R, Kondo T. Cerebellar atrophy in a patient with anorexia nervosa. Int J Eat Disord. 2004;34(2):238–241. | ||
Brooks SJ, Barker GJ, O’Daly OG, et al. Restraint of appetite and reduced regional brain volumes in anorexia nervosa: a voxel-based morphometric study. BMC Psychiatry. 2011;11:179. | ||
Carlen PL, Wortzman G, Holgate RC, Wilkinson DA, Rankin JC. Reversible cerebral atrophy in recently abstinent chronic alcoholics measured by computed tomography scans. Science. 1978;200(4345):1076–1078. | ||
Ron MA, Acker W, Lishman WA. Morphological abnormalities in the brains of chronic alcoholics-a clinical psychological and computerized axial tomographic study. Acta Psychiatr Scand Suppl. 1980;286:41–46. | ||
Vargas MI, Lenz V, Bin JF, et al. [Brain MR imaging of chronic alcoholism]. J Radiol. 2003;84(4 Pt 1):369–379. French. | ||
Schmahmann JD, Weilburg JB, Sherman JC. The neuropsychiatry of the cerebellum – insights from the clinic. Cerebellum. 2007;6(3):254–267. | ||
Friederich HC, Walther S, Bendszus M, et al. Grey matter abnormalities within cortico-limbic-striatal circuits in acute and weight-restored anorexia nervosa patients. Neuroimage. 2012;59(2):1106–1113. | ||
Kojima S, Nagai N, Nakabeppu Y, et al. Comparison of regional cerebral blood flow in patients with anorexia nervosa before and after weight gain. Psychiatry Res. 2005;140(3):251–258. | ||
Friederich HC, Brooks S, Uher R, et al. Neural correlates of body dissatisfaction in anorexia nervosa. Neuropsychologia. 2010;48(10):2878–2885. |
 © 2015 The Author(s). This work is published and licensed by Dove Medical Press Limited. The full terms of this license are available at https://www.dovepress.com/terms.php and incorporate the Creative Commons Attribution - Non Commercial (unported, v3.0) License.
By accessing the work you hereby accept the Terms. Non-commercial uses of the work are permitted without any further permission from Dove Medical Press Limited, provided the work is properly attributed. For permission for commercial use of this work, please see paragraphs 4.2 and 5 of our Terms.
© 2015 The Author(s). This work is published and licensed by Dove Medical Press Limited. The full terms of this license are available at https://www.dovepress.com/terms.php and incorporate the Creative Commons Attribution - Non Commercial (unported, v3.0) License.
By accessing the work you hereby accept the Terms. Non-commercial uses of the work are permitted without any further permission from Dove Medical Press Limited, provided the work is properly attributed. For permission for commercial use of this work, please see paragraphs 4.2 and 5 of our Terms.