")
Back to Journals » Clinical Ophthalmology » Volume 9
Folate status in type 2 diabetic patients with and without retinopathy
Authors Malaguarnera G , Gagliano C, Salomone S, Giordano M, Bucolo C, Pappalardo A, Drago F, Caraci F, Avitabile T, Motta M
Received 14 November 2014
Accepted for publication 18 March 2015
Published 7 August 2015 Volume 2015:9 Pages 1437—1442
DOI https://doi.org/10.2147/OPTH.S77538
Checked for plagiarism Yes
Review by Single anonymous peer review
Peer reviewer comments 3
Editor who approved publication: Dr Scott Fraser
Giulia Malaguarnera,1 Caterina Gagliano,2,3 Salvatore Salomone,1 Maria Giordano,4 Claudio Bucolo,1 Antonino Pappalardo,5 Filippo Drago,1 Filippo Caraci,6,7 Teresio Avitabile,2 Massimo Motta5
1Department of Biomedical and Biotechnological Sciences, University of Catania, Catania, Italy; 2Department of Ophthalmology, University of Catania, Catania, Italy; 3Neurovisual Science Technology (NEST), Catania, Catania, Italy; 4Gerontology and Bone Metabolic Disease Section, Department of Medical Sciences, University of Turin, Turin; 5Department of Medical and Paediatric Sciences, University of Catania, Italy; 6Department of Drug Sciences, University of Catania, Catania, Italy; 7IRCCS Association Oasi Maria S.S.-Institute for Research on Mental Retardation and Brain Aging, Troina, Enna, Italy
Background: Folate deficiency is associated with cardiovascular disease, megaloblastic anemia, and with hyperhomocysteinemia. This study has been undertaken to investigate the role of folate status during the progression of the diabetic retinopathy.
Methods: We measured the plasma levels of homocysteine, folic acid, and red cell folate in 70 diabetic type 2 patients with nonproliferative diabetic retinopathy (NPDR), 65 with proliferative diabetic retinopathy (PDR), 96 without diabetic retinopathy, and 80 healthy subjects used as a control group.
Results: We found higher plasma levels of homocysteine in the NPDR group compared to the control group (P<0.001) and in the PDR group compared to control group (P<0.001) and NPDR group (P<0.01). The severity of diabetic retinopathy was associated with lower folic acid and red cell folate levels, and a significant difference was observed between PDR and NPDR groups (P<0.05).
Conclusion: The folate status could play a role in the development and progression of diabetic retinopathy.
Keywords: homocysteine, proliferative diabetic retinopathy, nonproliferative diabetic retinopathy, diabetes mellitus
Introduction
Type 2 diabetes mellitus is a metabolic disorder characterized by hyperglycemia resulting from insulin resistance and relative insulin deficiency. Coexisting disorders, including obesity, hypertension, and dyslipidemia, contribute to the severity of type 2 diabetes.1
Interventions to reduce blood glucose significantly lower the risk of microvascular and macrovascular disease.2–5
A number of nutritional, hormonal, and genetic factors may result in metabolic disruption of these interrelated pathways that is associated with various pathological conditions, including cardiovascular diseases and neurodegenerative diseases.6
Folate is a water-soluble vitamin B critical for health as a cofactor in a multitude of single-carbon transfer reactions. The folate is an essential vitamin for humans and is obtained from the diet, especially from fruits and vegetables. Folate is required for nucleotide and methionine biosynthesis.7
Folic acid requires reduction to tetrahydrofolate and needs l-carbon substitution to commence its task as l-carbon donor for methylation and DNA–RNA synthesis. During passage of small amounts of folic acid through the gut cells and liver, reduction and l-carbon substitution is complete, and 5-methyltetrahydrofolate is by far the most predominant form entering the systemic circulation.
Folate transport across epithelia and into systemic tissues occurs via the reduced folate carrier, the folate reception family, and the recently discovered proton-coupled folate transporter.8
Nutritional deficiencies, particularly those involving B-group vitamins and folate, important cofactors of homocysteine (Hcy) metabolism, are commonly related with high circulating levels of Hcy.
Therefore, changes in folate status may influence the DNA stability and integrity, and affect the methylation patterns in neural tube tissue predisposing patients to the development of diabetic retinopathy.
However, very little evidence is currently available to suggest that folate deficiency alone leads to diabetic retinopathy.
In this study, we investigate the folate status in patients with diabetic retinopathy.
Methods and patients
Patients
A total of 231 diabetic patients were consecutively recruited from people attending our department at Cannizzaro Hospital. The mean age was 63.4±10.2 years. In this group, there were 111 women and 120 men. The mean duration was 8.2±4.6 years. Eighty control subjects (42 men and 38 women) were recruited from the clinical and laboratory staff and blood donors. None of the controls had a known history of macroangiopathy, nephropathy, retinopathy, or neuropathy.
Diabetes was diagnosed and classified according to the World Health Organization criteria.
Patients with familial hypercholesterolemia, hypothyroidism, chronic liver disease, advanced renal disease, and malignancies were excluded.
None of the patients were taking lipid-lowering drugs or glitazones, folate, oral contraceptive pills, or hormone replacement therapy.
All participants included in this analysis had an eye examination and completed a questionnaire which collected ocular and medical history.
This study was approved by Hospital Cannizzaro Ethics Committee. The recruitment was performed in observation and respect of the Helsinki Declaration. All patients gave their informed consent for the study participation and for each invasive procedure they underwent. All sensitive data was collected and protected in respect of present privacy statements.
Methods
A trained phlebotomist drew 20 mL blood from each research patients after overnight fast.
Six evacuated blood collection tubes were obtained: three tubes with a serum separator and three with ethylenediaminetetracetil acid as anticoagulant. For the red blood cell folate assay, 0.100 mL whole blood was added to 2 mL 0.2% ascorbic acid before storage. Next, the tubes were placed on ice and centrifuged at 2,900× g for 10 minutes at 4°C. The blood was separated into plasma and samples were stored at -45°C until the analysis. Fasting plasma glucose was measured in fresh specimens with a hexokinase reagent kit. Fasting plasma triglyceride and total cholesterol levels were measured enzymatically and the high density lipoprotein (HDL) cholesterol fraction was measured after precipitation of low-density lipoproteins and very low density lipoprotein (VLDL) with dextran sulfate magnesium.9–14 Low-density lipoprotein level was calculated by using the Friedwald’s formula.15 Serum creatinine levels (upper reference limit 120 μmol/L) were assayed with routine laboratory method.
Total plasma Hcy concentrations were determined using an immunoassay. Folate concentration in plasma and red blood cell (RBC) folate in whole blood hemolysate sample were measured using Quantaphase II folate radioassay kit (Bio-Rad Laboratories, Hercules, CA, USA).
Measurement of glycated hemoglobin (HbA1c) was made by high-performance liquid chromatography (Menarini Diagnostics, Italy). All assays were completed in duplicate. For the folate assessments, the intra-assay coefficient of variation was 3.7%, whereas the inter-assay coefficient of variation was 6.4%.
Clinical assessment
Clinical assessment consisted of anthropometric measurements, which included height, weight, body mass index, and waist-to-hip ratio. Measurements of heart rate, systolic blood pressure, and diastolic blood pressure were also obtained. The systolic and diastolic blood pressure levels were measured in the right arm by standard methods with the participants in a relaxed sitting position, using a mercury sphygmomanometer.
Assessment of diabetic retinopathy
The presence and severity of diabetic retinopathy were assessed from ophthalmoscopy and/or biomicroscopy through dilated pupils and fluorescein angiography when indicated. Retinopathy was classified as absent, nonproliferative, and proliferative.
Statistical analysis
Statistical analyses were performed using SPSS 15.0 (SPSS Inc., Chicago, IL, USA). All data are presented as mean ± standard deviation. Continuous variables were compared using the two-sample t-test or Mann–Whitney U-test, where applicable.
To verify the diagnostic value of both serum folate and red blood folate, receiver operating characteristic curves were plotted and the area under the curve was calculated.
Results
In our study, 135 out of 231 enrolled patients had diabetic retinopathy (Table 1). The patients were divided into three groups: patients with proliferative diabetic retinopathy, with nonproliferative diabetic retinopathy, and without retinopathy. As regards diabetic management, 64 were on dietary treatment, 117 on metformin treatment, and 50 on insulin treatment.
 | Table 1 Demographic characteristics of the study population |
Laboratory parameters
Subjects with PDR had higher glycated hemoglobin levels compared with patients without retinopathy (P<0.01) and fasting plasma glucose compared to subjects with NPDR (P<0.05). No significant differences were observed when comparing subjects with PDR versus subjects with NPDR in total cholesterol, low-density lipoprotein, and triglycerides (Table 2).
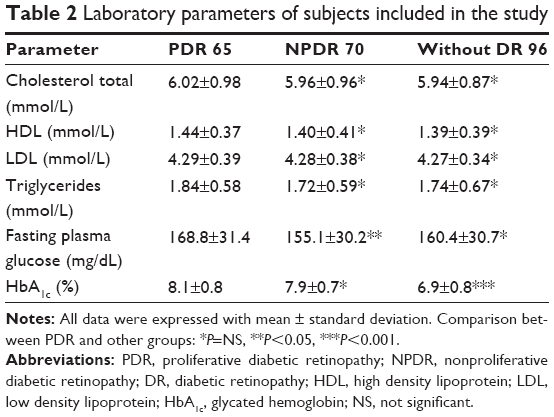 | Table 2 Laboratory parameters of subjects included in the study |
As regards creatinine levels, PDR showed significant differences compared to controls (P<0.01), NPDR (P<0.05), and diabetic without retinopathy (P<0.05). NPDR showed significant differences compared to health controls. Diabetic without retinopathy showed differences compared to PDR and controls (Figure 1A).
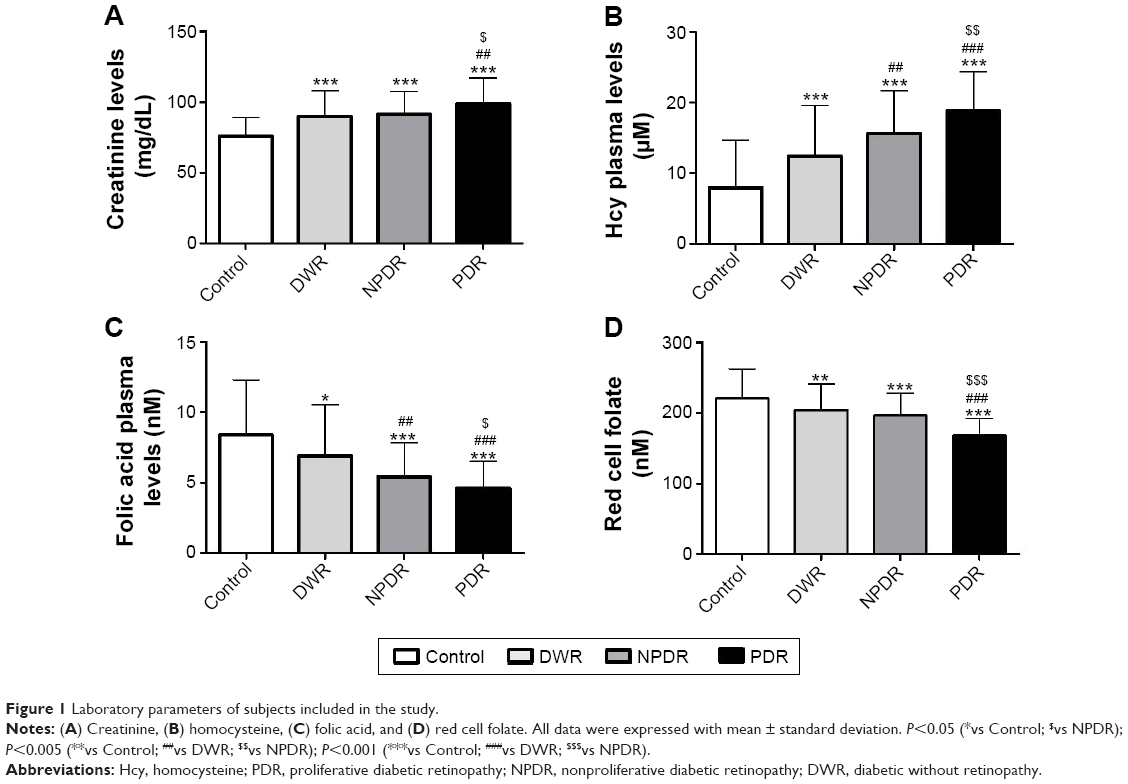 | Figure 1 Laboratory parameters of subjects included in the study. |
Folate status
With regard to the diabetic patients in treatment groups, the folic acid was decreased by 3.1%, 34.1%, and 12%, respectively, in dietary, metformin, and insulin groups; red folate cell was decreased by 4.6%, 37.6%, and 10%, respectively, in dietary, metformin, and insulin groups; and Hcy was increased by 4.6%, 58.1%, and 18%, respectively, in dietary, metformin, and insulin groups. The patients treated with metformin showed significant decrease of plasmatic folate (P<0.01) and RBC (P<0.01), and a significant increase of Hcy (P<0.01) (Figure 1B).
PDR showed significant differences in plasmatic folic acid compared to NPDR (P<0.05), DWR (P<0.01), and health controls (P<0.01). NPDR showed differences compared to PDR (P<0.05), healthy controls (P<0.001), and diabetic without retinopathy (P<0.05); plasmatic folic acid healthy controls showed differences compared to PDR (P<0.001), NPDR (P<0.001), and diabetic without retinopathy (P<0.05) (Figure 1C).
For red cell folate deficiency, PDR showed reduced red cell folate compared to NPDR, DWR, and controls (P<0.001) (Figure 1D).
We found that both plasmatic folic acid and red cell folate in these patients were not associated with smoke and body mass index. It was found that folate levels in the blood are associate with age, sex, and severity of retinopathy. Besides, plasmatic folic acid is inversely related with Hcy (P<0.05); red cell folate is inversely related with both HbA1c (P<0.01) and Hcy (P<0.01). The correlation between plasmatic and red cell folate was significant (P<0.05).
Discussion
Numerous factors have shown as having an effect on the development and progression of diabetic retinopathy.9–14 The results of the present study show that lower levels of both folic acid plasmatic and red blood cell folate were observed in patients with type 2 diabetes mellitus irrespective of the presence of retinopathy. Plasmatic folate concentrations fluctuate rapidly with recent changes in folate intakes and with temporary changes in folate metabolism even when body stores remain stable. Any alteration in folate metabolism leads to deficiency of methyltetrahydrofolate, thereby impairing remethylation of Hcy. Plasma folate is a marker for recent folate intake, as concentrations change after the intake of folate and is quite limited in determining folate status.
In our study, the diabetic patients with both PDR and NPDR show a significant deficiency in plasmatic folic acid and in red cell folate compared with healthy subjects and diabetic subjects without retinopathy.
Folic acid plays an important role in the remethylation (methionine–folate cycle) of Hcy and is thus capable of lowering elevated levels of Hcy.
Red blood cell folate and plasma folate levels are widely accepted direct biochemical indicators of folate status. Therefore we included RBC folate, since it is recognized as an indicator of folate stores in the body.
However, the association between plasma and folate is higher in proliferative retinopathy than in nonproliferative retinopathy and without retinopathy. High levels of plasma Hcy are toxic to the vascular endothelium and induce thrombosis via the formation of free radicals. In our study, low levels of peripheral folate (PF) and red blood folate show a significant inverse correlation with Hcy. The main mechanisms of hyperhomocysteinemia for the development of atherothrombosis are endothelial injury, platelet activation, and oxidative modification of low-density lipoproteins.15–19 Increasing evidence suggests that the proliferation rate of cells would cause an elevation of circulating total Hcy or an increase in the concentration of cells would deplete folate and inactivate the methionine synthase catalyzed remethylation reaction.
Deficiency or impairment of folate metabolism is associated with hyperhomocysteinemia, hypomethylation (the decreased on carbon unit transfer to purines and pyrimidines for DNA repair and biosynthesis), DNA damage, and impaired cell proliferation, malignancies, and impaired NO production. Recent study indicates that DNA methylation is an important player in both DNA repair and gene stability. Low folate levels was related to DNA damage and global DNA hypomethylation.16
It has been suggested that the inactivation of DNA repair pathways, which leads to an increased mutation rate and chromosomal instability, can initiate and accelerate the proliferative process.19
Thus, understanding and characterizing the epigenetic regulators and their role in the pathogenesis of diabetic retinopathy could help in identifying novel target to combat this blinding disease which is the major cause of blindness in adults.
Deficiencies in the cofactors folate, pyridoxine, and vitamin B12 and metformin treatment have been demonstrated to elevate plasma Hcy.
The Hcy-increasing effect of metformin has been ascribed to the inhibition of vitamin B12 absorption and hence decreased intracellular levels of vitamin B12.20–26 However, metformin also seems to reduce serum folate levels.27
Various studies have demonstrated that long-term use of metformin increased the risk of vitamin B12 and folate deficiency and thus influenced the Hcy metabolism and contributed to the progression of diabetic retinopathy.28,29 But controversies remain regarding the influence of metformin on folate. Wulffelé23 reported that metformin alone or combined with insulin lowered both folate and vitamin B12 levels and increased Hcy concentration compared to insulin therapy alone. Another study demonstrated that patients treated with metformin had no significant depletion of serum folate.30 Another trial showed that metformin decreased folate levels but after adjustment for body mass index and smoking, the decrement turned out to be insignificant.28 In our study, patients treated with metformin showed a significant decrease in the PF and RBC, whereas Hcy was significantly increased.
RBC represents a long-term marker as the red blood cell folate pool turns over slowly and represents folate stores. Concentration levels change slowly as folate is incorporated to RBCs, accumulated only during erythropoiesis and RBCs have a half-life of 120 days. Kinetic studies have shown that the half-life of red cell folate closely matches the half-life of red blood cells (60 days).15 In contrast, circulating PF changes rapidly after intake.16
Red folate blood is inversely related to HbA1c. Analysis of folate in red cells is considered to be a strong indicator of folate adequacy because it reflects intracellular status and is not influenced by recent or transient changes in dietary folate intake. Plasmatic folate alone does not differentiate between what may be a transitory reduction in folate intake or chronic folate deficiency accompanied by depleted folate stones and functional changes. Tissue folate status is assessed by the measurement of total folate concentration in blood because available assays are unable to differentiate between the various circulatory forms.
The potential link between the microvascular changes that occur in diabetic retinopathy and folate deficiency may be useful as a predictor for retinopathy. Diabetic retinopathy is one of the microvascular complications of diabetes which may not have symptoms in the early stages. Control of these complications depends on proper management and monitoring of retinal status and blood glucose levels after the early detection of retinopathy, but may progress to a sight-threatening stage if left untreated. Based on our results, we demonstrated that metformin was the most consistent risk factor for folate deficiency. A large-scale study that is specifically designed is needed to investigate the prevalence and contributing factor for folate deficiency. Our data raise the possibility that these favorable effects of metformin may be even pronounced if decreases in folate and vitamin B12 are avoided. Thus, folate status could play a role in the development and progression of diabetic retinopathy. According to our hypothesis, the recovery or delay of diabetic retinopathy may occur by folate supplement treatment.
Acknowledgment
GM has been supported by the International PhD program in Neuropharmacology, University of Catania, Italy.
Disclosure
The authors report no conflicts of interest in this work.
References
Mehlsen J, Erlandsen M, Poulsen PL, et al. Identification of independent risk factors for the development of diabetic retinopathy requiring treatment. Acta Ophthalmol. 2011;89:515–521. | ||
Madsen-Bouterse SA, Kowluru RA. Oxidative stress and diabetic retinopathy: pathophysiological mechanisms and treatment perspectives. Rev Endocr Metab Disord. 2008;9:315–327. | ||
Rampello L, Vecchio I, Malaguarnera G, et al. Diabetic neuropathy. Diagnosis. Acta Medica Mediterranea. 2012;28:133. | ||
Zhang W, Liu H, Al-Shabrawey M, et al. Inflammation and diabetic retinal microvascular complications. J Cardiovasc Dis Res. 2011;2: 96–103. | ||
Mujumdar VS, Aru GM, Tyagi SC, et al. Induction of oxidative stress by homocyst(e)ine impairs endothelial function. J Cell Biochem. 2001;82:491–500. | ||
Marrazzo G, Barbagallo I, Galvano F, et al. Role of dietary and endogenous antioxidants in diabetes. Crit Rev Food Sci Nutr. 2014;54:1599–1616. | ||
Stover PJ. Physiology of folate and vitamin B12 in health and disease. Nutr Rev. 2004;62:s3–s12. | ||
Zhao J, Cao SL, Zheng XL, Zhao, B. Folate receptor-mediated antitumor drugs. Yao Xue Xue Bao. 2009;44:109–114. | ||
Malaguarnera M, Vacante M, Russo C, et al. Lipoprotein(a) in cardiovascular diseases. Biomed Res Int. 2013;2013:650989. | ||
Miller A, Mujumdar V, Palmer L, et al. Reversal of endocardial endothelial dysfunction by folic acid in homocysteinemic hypertensive rats. Am J Hypertens. 2002;15(2 Pt 1):157–163. | ||
Miller A, Mujumdar V, Shek E, et al. Hyperhomocyst(e)inemia induces multiorgan damage. Heart Vessels. 2000;15:135–143. | ||
Veeranna V, Zalawadiya SK, Niraj A, et al. Homocysteine and reclassification of cardiovascular disease risk. J Am Coll Cardiol. 2011;58:1025–1033. | ||
Galvano F, Malaguarnera M, Vacante M, et al. The physiopathology of lipoprotein (a). Front Biosci (Schol Ed). 2010;2:866–875. | ||
Malaguarnera G, Gagliano C, Bucolo C, et al. Lipoprotein(a) serum levels in diabetic patients with retinopathy. Biomed Res Int. 2013;2013:943505. | ||
Pietrzik K, Lamers Y, Brämswig S, et al. Calculation of red blood cell folate steady state conditions and elimination kinetics after daily supplementation with various folate forms and doses in women of childbearing age. Am J Clin Nutr. 2007;86:1414–1419. | ||
Prinz-Langenohl R, Brönstrup A, Thorand B, et al. Availability of food folate in humans. J Nutr. 1999;129:913–916. | ||
Ozkan Y, Ozkan E, Simşek B, et al. Plasma total homocysteine and cysteine levels as cardiovascular risk factors in coronary heart disease. Int J Cardiol. 2002;82:269–277. | ||
Lynch SM. Assessment of student pharmacists’ knowledge concerning folic acid and prevention of birth defects demonstrates a need for further education. J Nutr. 2002;132:439–442. | ||
Malaguarnera G, Gagliano C, Giordano M, et al. Homocysteine serum levels in diabetic patients with non-proliferative, proliferative and without retinopathy. Biomed Res Int. 2014;2014:191497. | ||
Stowers JM, Smith OA. Vitamin B12 and metformin. Br Med J. 1971;3(5768):246–247. | ||
Carlsen SM, Følling I, Grill V, et al. Metformin increases total serum homocysteine levels in non-diabetic male patients with coronary heart disease. Scand J Clin Lab Invest. 1997;57(6):521–527. | ||
Ko SH, Ko SH, Ahn YB, et al. Association of vitamin B12 deficiency and metformin use in patients with type 2 diabetes. J Korean Med Sci. 2014;29(7):965–972. | ||
Wulffelé MG, Kooy A, Lehert P, et al. Effects of short-term treatment with metformin on serum concentrations of homocysteine, folate and vitamin B12 in type 2 diabetes mellitus: a randomized, placebo-controlled trial. J Intern Med. 2003;254(5):455–463. | ||
Kang D, Yun JS, Ko SH, et al. Higher prevalence of metformin-induced vitamin B12 deficiency in sulfonylurea combination compared with insulin combination in patients with type 2 diabetes: a cross-sectional study. PLoS One. 2014;9(10):e109878. | ||
Hidalgo SF, Prieto de Paula JM, Salado Valdivieso I, et al. Metformin and vitaminB12 deficiency. Med Clin. 2010;135(6):286–287. | ||
Esteban Jiménez O, González Rubio F, Buñuel Granados JM, et al. Vitamin B12 deficiency secondary to metformin therapy. Med Clin. 2010;135(6):287–288. | ||
Aarsand AK, Carlsen SM. Folate administration reduces circulating homocysteine levels in NIDDM patients on long-term metformin treatment. J Intern Med. 1998;244(2):169–174. | ||
De Jager J, Kooy A, Lehert P, et al. Long term treatment with metformin in patients with type 2 diabetes and risk of vitamin B-12 deficiency: randomised placebo controlled trial. BMJ. 2010;340:c2181. | ||
Essais O, Bouzid C, Ouni Z, et al. Factors influencing homocysteineamia in type 2 diabetic patients. Tunis Med. 2006;84(5):279–281. | ||
Pongchaidecha M, Srikusalanukul V, Chattananon A, et al. Effect of metformin on plasma homocysteine, vitamin B12 and folic acid: a cross-sectional study in patients with type 2 diabetes mellitus. J Med Assoc Thai. 2004;87(7):780–787. |
 © 2015 The Author(s). This work is published and licensed by Dove Medical Press Limited. The full terms of this license are available at https://www.dovepress.com/terms.php and incorporate the Creative Commons Attribution - Non Commercial (unported, v3.0) License.
By accessing the work you hereby accept the Terms. Non-commercial uses of the work are permitted without any further permission from Dove Medical Press Limited, provided the work is properly attributed. For permission for commercial use of this work, please see paragraphs 4.2 and 5 of our Terms.
© 2015 The Author(s). This work is published and licensed by Dove Medical Press Limited. The full terms of this license are available at https://www.dovepress.com/terms.php and incorporate the Creative Commons Attribution - Non Commercial (unported, v3.0) License.
By accessing the work you hereby accept the Terms. Non-commercial uses of the work are permitted without any further permission from Dove Medical Press Limited, provided the work is properly attributed. For permission for commercial use of this work, please see paragraphs 4.2 and 5 of our Terms.