")
Back to Journals » International Journal of Nanomedicine » Volume 9 » Issue 1
Effects of titania nanotubes with or without bovine serum albumin loaded on human gingival fibroblasts
Authors Liu X, Zhou X, Li S, Lai R, Zhou Z, Zhang Y, Zhou L
Received 7 October 2013
Accepted for publication 6 December 2013
Published 6 March 2014 Volume 2014:9(1) Pages 1185—1198
DOI https://doi.org/10.2147/IJN.S55514
Checked for plagiarism Yes
Review by Single anonymous peer review
Peer reviewer comments 2
Xiangning Liu,1,* Xiaosong Zhou,2,* Shaobing Li,3 Renfa Lai,1 Zhiying Zhou,1 Ye Zhang,1 Lei Zhou3
1The First Affiliated Hospital of Jinan University, Guangzhou, 2Chemistry Science and Technology School, Zhanjiang Normal University, Zhanjiang, 3Guangdong Provincial Stomatological Hospital, Southern Medical University, Guangzhou, People's Republic of China
*These authors contributed equally to this work
Abstract: Modifying the surface of the transmucosal area is a key research area because this process positively affects the three functions of implants: attachment to soft tissue, inhibiting bacterial biofilm adhesion, and the preservation of the crestal bone. To exploit the potential of titania nanotube arrays (TNTs) with or without using bovine serum albumin (BSA) to modify the surface of a dental implant in contact with the transmucosal area, BSA was loaded into TNTs that were fabricated by anodizing Ti sheets; the physical characteristics of these arrays, including their morphology, chemical composition, surface roughness, contact angle, and surface free energy (SFE), were assessed. The effect of Ti surfaces with TNTs or TNTs-BSA on human gingival fibroblasts (HGFs) was determined by analyzing cell morphology, early adhesion, proliferation, type I collagen (COL-1) gene expression, and the extracellular secretion of COL-1. The results indicate that early HGF adhesion and spreading behavior is positively correlated with surface characteristics, including hydrophilicity, SFE, and surface roughness. Additionally, TNT surfaces not only promoted early HGF adhesion, but also promoted COL-1 secretion. BSA-loaded TNT surfaces promoted early HGF adhesion, while suppressing late proliferation and COL-1 secretion. Therefore, TNT-modified smooth surfaces are expected to be applicable for uses involving the transmucosal area. Further study is required to determine whether BSA-loaded TNT surfaces actually affect closed loop formation of connective tissue because BSA coating actions in vivo are very rapid.
Keywords: titania nanotubes, bovine serum albumin, modified surface, transmucosal area, human gingival fibroblast
Introduction
Implant dentistry has maintained success rates exceeding 90% over the last several years;1 successful implantation relies not only on osseointegration but also on the healing of soft tissue around the transmucosal area of the implant. Numerous studies2–5 have demonstrated that osseointegration is facilitated by surface modifications. Over time, the surface designs of the endosseous and transmucosal areas have dynamically changed to enable faster integration after implantation and improve long-term bone maintenance; long-term bone maintenance relies heavily on the surface modification of the transmucosal area because the surface positively affects the three functions of the implants: the attachment of soft tissue,6,7 the inhibition of bacterial biofilm adhesion,8,9 and the preservation of the crestal bone.10,11
Subramani et al12 reviewed the literature published from 1966–2007 and drew the following conclusions: increasing the surface roughness (Ra) and surface free energy (SFE) facilitates abutment and biofilm formation on dental implants. The smooth surface of machined necks (Ra <0.5 μm) has generally been considered to be conducive for the attachment of soft tissue while inhibiting bacterial biofilm adhesion and helping to maintain healthy osseointegration.13 However, researchers gradually discovered that the machined necks led to crestal bone loss during early functional loading after several decades of installation procedures.14–17 Additionally, some scholars reported that the micro-roughened surface did not increase plaque accumulation, nor did it lead to crestal bone loss; however, the surface was reportedly more conducive for forming a wide and tightly attached closed loop of connective tissue.18–21 Therefore, the suitability of machined and micro-roughened surfaces for the transmucosal area is currently debated.
During nanotechnological developments, electrochemically engineered titania nanotube arrays (TNTs) have been generated via self-ordering anodization on a Ti surface; the materials are mechanically and chemically stable, biocompatible, and beneficial for bone formation.22–25 Numerous studies have described TNT-modified endosseous areas, but few reports have covered transmucosal areas modified with TNTs. Because these materials improve bone formation, a Ti surface modified with TNTs might help to preserve the crestal bone. Furthermore, because the Ra may be controlled similarly to that of the smooth surface (Ra <0.5 μm), TNT-modified Ti surfaces might be conducive for soft tissue attachment while inhibiting bacterial biofilm adhesion. Therefore, a smooth surface modified with TNTs might meet three requirements for the transmucosal area; these requirements include facilitating the attachment of soft tissue, inhibiting the adhesion of bacterial biofilm, and preserving the crestal bone under applied biomechanical force. To prove the third prerequisite, systematic experiments are required. Therefore, TNTs might be appropriate for use in the transmucosal area.
Moreover, TNTs are an attractive solution for local and implantable drug delivery; these applications append an antibacterial substance such as gentamycin, lysozyme, and serum proteins, and so on, to the Ti surface.26,27 The significant inhibitory effects of serum proteins are well known; these effects are often used to hinder protein adsorption or bacterial adhesion on experimental devices because serum proteins are a component of the blood with obvious biocompatibility.28,29 Furthermore, serum protein may promote mineral deposition because they contain structures, such as -OH, -NH, and -SH, with strong affinities for inorganic cations and anions, causing them to become commonly used in simulated biomineralization experiments.30 Therefore, a Ti surface modified with bovine serum albumin (BSA)-loaded TNTs may also be conducive for preserving the crestal bone, while the effects of these materials on soft tissue remains to be studied in detail.
The soft tissue around the implant includes the epithelial tissue and the underlying fibrous connective tissue and attaching the connective tissue to the implant is critical for separating the implant-bone interface from the oral environment. The connective tissue around a dental implant is characterized by collagen fibers mostly aligned parallel to the implant surface. An absolute biological attachment between the implant and surrounding parallel connective tissue fibers remains elusive.31–33 The collagen fibers are closely attached to the implant surface via glycoproteins that can combine the upper epithelial tissue with the implant surface, forming the hemidesmosome; these structures may prevent the downgrowth of the epithelium, facilitating the long-term success of osseointegrated implants.31,34 The collagen, glycoproteins, and other connective tissue matrix, are produced by gingival fibroblasts. Therefore, we studied the biological response of gingival fibroblasts toward TNTs while assessing the interactions between soft tissue and TNTs.
In this study, the effects of the TNTs with or without BSA loaded on human gingival fibroblasts (HGFs) were assessed to highlight TNT potential for use as a modified surface in the transmucosal area.
Materials and methods
Fabrication and morphology of the TNT arrays
The TNTs were fabricated via anodic oxidation on a Ti sheet, as reported previously.35 The Ti sheet was mechanically polished and subsequently sonicated in acetone for 30 minutes before anodization. In a typical procedure, a 2 × 3 cm2 Ti sheet (99%) 0.1 mm thick was used as an anode alongside an Ir/Ta alloy cathode. The electrolyte was a solution containing 1,2,3-propanetriol, NH4F (1.0% weight), and H2O (15% volume). The anodizing voltage varied from 0 to 25 V at 500 mV seconds−1 and was kept at 25 V for 1 hour. The TNTs were subsequently annealed in air at 450°C for 4 hours.
The different surface morphologies were examined by thermal field emission environmental scanning electron microscopy (SEM; Hitachi S-520, Hitachi Ltd, Tokyo, Japan) at a 20 kV acceleration voltage.
Loading BSA into the TNTs
BSA was loaded into the TNTs using a simplified drying method under vacuum, as described by Popat et al.26 The TNT surfaces (1 cm × 1 cm) were cleaned with deionized water and anhydrous ethanol before adding the BSA. Three groups containing 200, 400, or 600 μg of BSA were prepared. Twenty microliters from the same volume of 1 mL solution containing BSA was pipetted onto the TNT surface and spread gently to ensure even coverage. The surfaces were allowed to dry under vacuum at room temperature for 2 hours. After drying, the loading step was repeated until an appropriate amount of BSA was added to the TNT arrays. Subsequently, the surfaces were loaded with 200, 400, or 600 μg of BSA. After the final drying step, the surfaces were rinsed with 500 μL of phosphate buffered saline (PBS), to remove any excess drug. The rinse solutions were collected and stored for further analysis.
It was important to evaluate BSA loading efficiency in the nanotubes. The concentrations of BSA in the original and the rinse solutions were evaluated with a bicinchoninic acid (BCA) assay kit (Thermo Fisher Scientific, Waltham, MA USA). The loading efficiency was expressed as the percentage of loaded BSA after washing:

where η is the loading efficiency, Co is the concentration of BSA in the original solution, and Cr is the concentration of BSA in the rinse solution.
Characterization of the Ti specimens
Five groups were examined while characterizing the Ti specimens: polished Ti metal (PT), uncoated TNTs (NT), TNTs loaded with BSA (NTB; NTB1, 200 μg BSA; NTB2, 400 μg BSA; NTB3, 600 μg BSA).
X-ray photoelectron spectroscopy
The chemical composition of the different surfaces was examined using X-ray photoelectron spectroscopy (XPS; KratosAxis UltraDLD, Shimaszu Corporation, Kyoto, Japan) under high vacuum. The photoelectrons were generated via monochromatic Al Ka X-ray radiation at 150 W (15 kV, 10 mA) and were analyzed with a hemispherical electron energy analyzer. Survey and narrower high-resolution scans of the major characteristic peaks (Ti 2p, O 1s, C 1s, and N 1s) were recorded at a 90° take-off angle. The binding energy was calibrated using the C 1s (hydrocarbons C-C, C-H) signal at 284.6 eV, and the semi-quantitative analysis of elements was enacted with CasaXPS software (Casa Software Ltd, Teignmouth, UK). For peak fitting, Gaussian line shapes were used for O 1s, and a mixed Gaussian-Lorentzian function for Ti 2p.
Surface roughness
Three-dimensional profile characteristics of different surfaces were analyzed with an optical profilometer (Wyko NT9300; Veeco Instruments Inc, Plainview, NY, USA) in white light vertical scanning interferometry mode. The roughness parameter (Ra: arithmetic mean height deviation from the mean plane) was quantified using software (Vision 4.20; Veeco Instruments Inc) at a 10.28× magnification over a 736 μm × 480 μm scanning area.
Contact angle and surface free energy
The wettability of the Ti specimens was examined with an optical contact angle (CA) measuring device (Dataphysics OCA 40 Micro; DataPhysics Instruments GmbH, Filderstadt, Germany) using 10 μL dH2O and 10 μL of diiodomethane at 25°C and 45% humidity. The CA was measured using the profiles of the droplets deposited on the modified surfaces immediately after stabilization using SCA 40 software (DataPhysics Instruments GmbH). According to Owens’ equation, surface free energy (SFE) was composed of polar (γp) and dispersive (γd) components and was calculated with CA values for these two different liquids;36 γl and γs are related to the liquid surface tension and solid surface energy, respectively:

Cell culture
The cytological features of the Ti sheets were evaluated in vitro using HGFs (HGF-1, CRL-2014; ATCC, Manassas, VA, USA) cultured in complete medium under standard culture conditions (37°C and 5% CO2). HGFs were used at passage numbers 3–5. The complete medium included Dulbecco’s Modified Eagle’s Medium (DMEM; Life Technologies, Carlsbad, CA, USA) supplemented with 10% fetal calf serum (FCS; Life Technologies), 100 U/mL penicillin, and 100 mg/mL streptomycin (Sigma-Aldrich, St Louis, MI, USA).
Three groups of Ti sheets were tested: TNTs loaded with BSA (400 μg of BSA; NTB), uncoated TNTs (NT) as the positive control, and polished Ti metal (PT) as the negative control.
To seed cells on the surfaces of the Ti sheets (1 cm × 1 cm), each sheet was placed into the bottom of one well in a 24-well plate. The plates were then placed in a biological hood and sterilized with ozone for 30 minutes. The ozone was produced by an ultraviolet light in the enclosed biological hood. The surfaces of the Ti sheets were subsequently washed twice with warm PBS, and the cells were plated at 2 × 10⁴ cells/cm2. After 24 hours, all media were removed, and the cells were supplied with fresh complete medium to remove any non-adherent cells. Subsequently, the medium was exchanged every other day.
Cell morphology
To study cell morphology via field emission SEM, cells (2 × 10⁴ cells/cm2) were seeded on the Ti samples and incubated for 1, 3, 9, and 24 hours. After incubation, the Ti samples were washed with PBS and the cells were fixed with a 2.5% glutaraldehyde solution for 1 hour. After three rinses with PBS, the samples were dehydrated in an ethanol series (30% and 50% twice, 70% and 90% once, 100% three times) followed by three treatments in tert-Butanol. The samples were freeze dried for 4 hours under vacuum before being mounted on aluminum stubs, sputter-coated with aurum and palladium, and observed via thermal field emission environmental SEM.
Early cell adhesion
Immunofluorescence staining was used to evaluate cell adhesion after 1 and 3 hours of incubation. After incubation, the samples were rinsed twice with pre-warmed PBS and then fixed in 4% paraformaldehyde at room temperature for 10 minutes followed by two PBS rinses. Cells were made permeable with 0.1% Triton X-100 for 5 minutes at room temperature followed by two PBS rinses. The nonspecific binding sites were blocked with 1% BSA in PBS for 1 hour at room temperature. The samples used to evaluate early cell adhesion were only incubated with PBS containing 10 μg/mL Hoechst 33342 in the dark. The samples were stored in PBS under low light and temperature conditions before being observed by confocal laser scanning microscopy (TCS SP5, Leica Microsystems, Wetlzer, Germany). High-magnification immunofluorescence images were used to study the adhesion points.
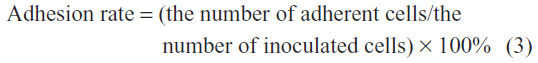
Each sample used to evaluate early cell adhesion was selected to obtain a relatively uniform distribution of five different horizons (816 μm × 816 μm) for the images collected at 200× magnification. An image processing system was used to analyze and count adherent cells. The adhesion rate was calculated according to the following equation:
Cell proliferation
Cell proliferation was evaluated using the enzymatic activity of the mitochondrial dehydrogenase in metabolically active cells with the methyl tetrazole sulfate (MTS) assay kit (CellTiter® 96VR AQueous One Solution Cell Proliferation Assay; Promega Corporation, Fitchburg, WI, USA) to measure the conversion of MTS into a colored water-soluble formazan product. After 3, 4, 7, and 14 days of incubation, the Ti samples were rinsed three times with PBS and subsequently incubated with 10% MTS reagent at 37°C for 4 hours in a humidified 5% CO2 atmosphere. Afterwards, the absorbance of 200 μL culture medium containing the colored formazan product was measured in a 96-well plate with a spectrophotometric microplate reader (Multiscan MK3; Thermo Fisher Scientific) at 490 nm.
Gene expression of type I collagen
Fluorescence quantitative real-time PCR (FQ-PCR) can accurately measure the messenger ribonucleic acid (mRNA) level of a gene and is a highly reliable method for in vitro studies. Although posttranslational modifications and regulation may occur, the amount of mRNA is a good predictor of the protein level. After the HGFs of each group were cultured for 3, 4, 7, and 14 days, type I collagen (COL-1) RNA was extracted using TRIzol® Reagent (Life Technologies), followed by purification in chloroform and precipitation using isopropanol. RNA purity was verified by measuring the optical density (OD) 260:OD 280 absorbance ratio with a Biophotometer Plus (Eppendorf, Hamburg, Germany) and ensuring that this value was 1.8. The integrity of the RNA was verified using sepharose electrophoresis. The reaction reagents for the RNA reverse transcription were added to a PCR tube. The final reaction volume for the RNA reverse transcription was 20 μL and was composed of 1 μg total RNA, 0.5 μL oligodeoxythymidylic acid (oligo-dT), 0.5 μL random primer, 0.5 μL RNase inhibitor, 0.5 μL moloney murine leukemia virus reverse transcriptase (M-MLV RT), 2 μL deoxyribonucleotides (dNTPs), 4 μL 5 × buffer, and diethylpyrocarbonate (DEPC)-treated water. The reverse transcription was performed at 30°C for 10 minutes, followed by 42°C for 60 minutes. The reaction was then denatured at 72°C for 10 minutes. The quantitative PCR generated a 164 bp amplicon of COL-1 produced using a COL-1 primer pair (forward, 5′-CCTGGATGCCATCAAAGTCT-3′; reverse, 5′-ACTGCAACTGGAATCCATCG-3′). A second 112 bp amplicon was produced using an 18S ribosomal (r) RNA primer pair (forward, 5′-CCTGGATACCGCAGCTAGGA-3′; reverse, 5′-GCGGCGCAATACGAATGCCCC-3′) located within the COL-1 amplicon as the reference. The PCR reaction volume was 20 μL and was composed of the following materials: 5 μL complementary deoxyribonucleic acid (cDNA; 1/20 dilution), 0.5 μL COL-1 primer, 0.5 μL 18S rRNA primer, 10 μL 2 × SYBR® Green PCR Master Mix (Life Technologies), and 4 μL DEPC-treated water. The reactions were performed in a PCR amplification machine (ABI 7500; Applied Biosystems, Foster City, CA, USA). The amplifying conditions were as follows: pre-denaturation at 95°C for 5 minutes, followed by 40 cycles of denaturation at 95°C for 15 seconds, annealing at 60°C for 15 seconds, and extension at 72°C for 32 seconds. A single fluorescent reading was collected at the end of each cycle. The specificity of the primers was confirmed for every PCR run via melting curve analysis.
Enzyme-linked immunosorbent assay for the type I collagen
COL-1 concentrations were determined with an enzyme-linked immunosorbent assay (ELISA) using a human anti-type I collagen IgA antibody assay kit (Chondrex Inca; Redmond, WA, USA). After 3, 4, 7, and 14 days of incubation, the cell lysates and the supernatant from each Ti sample were collected and subjected to the ELISA. Briefly, 100 μL of the standard or sample was added to a 96-well plate, and after incubation at 37°C for 120 minutes, the plates were washed five times with 1× wash buffer. Subsequently, COL-1 antiserum was added to each well, and after incubating at 37°C for 60 minutes, the plates were again subjected to five washes. Next, 100 μL of streptavidin horseradish peroxidase reagent was added to each well and incubated for 30 minutes at 37°C. After washing plates five times, 100 μL of a substrate solution (TMB solution:hydrogen peroxide solution =1:1) was added to each well and incubated in the dark for 15 minutes at 37°C; a stop solution was subsequently added to terminate the reaction. The COL-1 concentrations were quantified by measuring the absorbance at 450 nm.
Statistical analysis
All data are expressed as means ± standard deviation (SD). Statistical analysis was performed with a factorial-designed analysis of variance (ANOVA) using SPSS statistical package 13.0 (IBM Corporation, Armonk, NY, USA). The Levene test for the homogeneity of variance was used before pairwise comparison using the Bonferroni test for cases displaying homogeneity of variance or by Tamhane’s T2 test for cases displaying heterogeneity of variance. The differences were considered significant when the P-value was below 0.05.
Results
Morphology of the TNT arrays
The morphology of TNT arrays was characterized by thermal field emission environmental SEM and is summarized in Figure 1. A typical cross-sectional image of the free-standing TNT structures that were removed from the Ti substrate for imaging purposes is presented. A high-resolution image of the cross-sectional SEM image of the TNT layer reveals a vertically aligned and densely packed array of TNTs across the entire structure. The SEM images displaying the top of the TNT surface (Figure 1A) exhibited pores approximately 80–100 nm in diameter and tube walls approximately 15–20 nm thick.
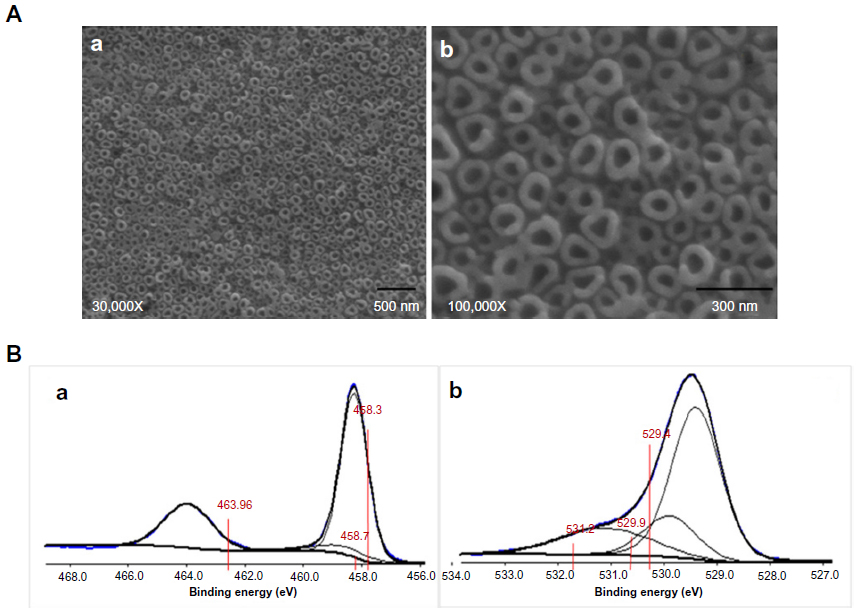 | Figure 1 (A) Thermal field emission environmental SEM images of the titania nanotubular surfaces (top view of the nanotubular surface revealing the tube diameter approximately 80–100 nm): (a) 50,000× magnification, bar =500 nm; (b) 100,000× magnification, bar =300 nm. (B) The Ti 2p XPS spectra data for the (a) Ti 2p of the NT sample surface and the (b) XPS data for the O 1s of the NT sample surface. |
The loading efficiency of BSA
As summarized in Table 1, the loading efficiency of NTB1, NTB2, or NTB3 is up to 99%.
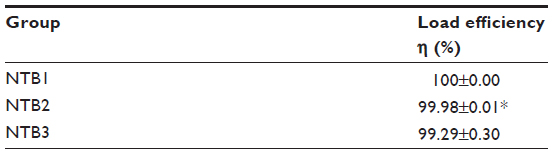 | Table 1 Load efficiency of the different doses of BSA in the TiO2 nanotubes |
Characterization of the Ti specimens
XPS analysis
As indicated by the XPS data, all surfaces were composed of Ti, O, C, and N. As presented in Table 2, the content ratio of Ti:O on the PT surface was 1:2, suggesting that the surface was formed from a TiO2 oxide film; the ratio of Ti:O on the NT surface was greater than 1:2, suggesting that the NT surface also contains oxides other than TiO2. Different amounts of BSA were adsorbed in the TNTs of NTB, as proven by the higher C and N content relative to the others; the S content on the surface of the NTB2 and NTB3 also validated this result because the molecular structure of BSA contains C, H, O, N, and S. To determine the chemical states of Ti and O on the NT surface, the surface contamination C 1s (284.6 eV) signal was used as the reference to correct the energy of the decomposed binding energy peaks for Ti and O. The high-resolution XPS spectra for the Ti 2p and O 1s of NT are displayed in Figure 1Ba and 1Bb. The Ti 2p XPS spectra (Figure 1Ba) displayed three peaks at 458.7 eV, 458.3 eV, and 463.96 eV. The binding energies at 458.3 eV and 458.7 eV matched that of the Ti4+ in TiO2. According to the literature, the binding energy at 463.96 eV revealed an increase in acidity on the NT surface, making this surface conducive for adsorbing polar organic contaminants on the TNT surfaces. As displayed in Figure 1Bb, the original O 1s spectra were deconvoluted into three peaks at 529.4 eV, 529.9 eV, and 531.2 eV. The main peak at 529.4 eV was assigned to the O 1s in Ca-O. The second peak at 529.9 eV represented the O 1s in TiO2; the third signal (531.2 eV) might correspond to the O-H in Ca(OH)2 or the organic contaminants, as well as the C-O or Si-O in the organic contaminants.
 | Table 2 The average content of titanium surface of the sample composition detected by XPS (%; n=3) |
Surface roughness
A reconstructed three-dimensional image is displayed in Figure 2A. The rough surface was characterized by irregular wavy peaks and valleys. The depth was indicated by different colors. As displayed in Figure 2B, the Ra under 10.28× magnification gradually increased in PT, NT, NTB1, NTB2, and NTB3, while the differences between each group were statistically significant (P<0.05).
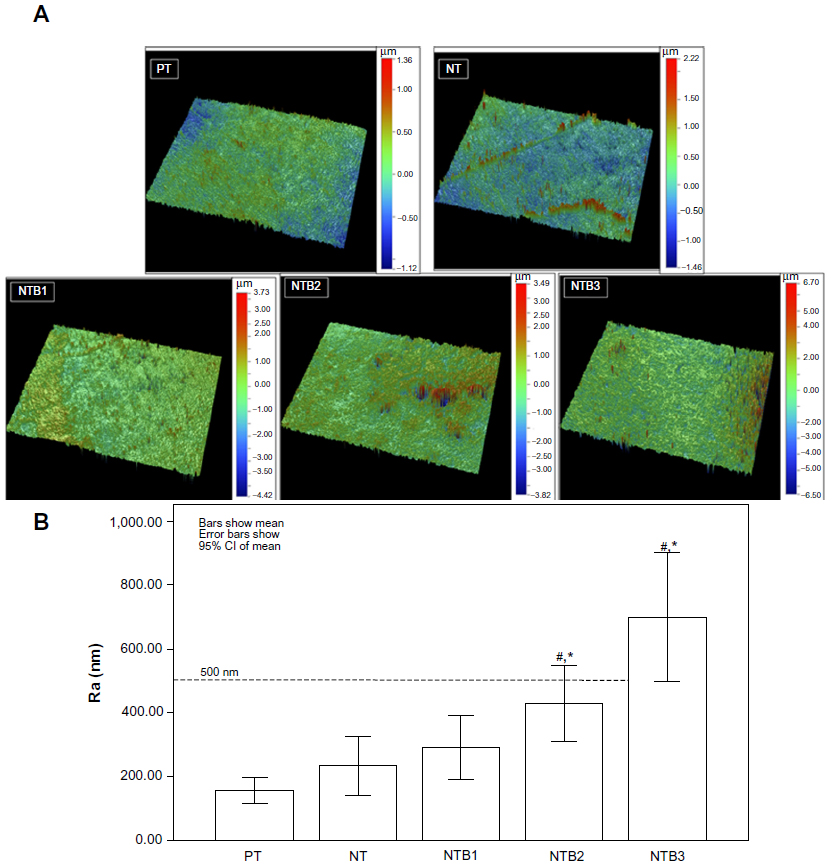 | Figure 2 (A) Three-dimensional contour of the samples (10.28×); (B) The surface roughness values for the samples. |
CAs and SFEs
The CAs of two different liquids on different surfaces, as well as the calculated SFEs composed of polar and dispersive components, are summarized. The CAs are summarized in Figure 3, and the calculated SFEs are summarized in Table 3. The images revealing the samples’ water CA are presented in Figure 3A. As displayed in Figure 3B, the average distilled water CA on the different surfaces was significantly different (P<0.05); however, the CAs for diiodomethane were not significantly different (P>0.05). The NT surface had average CAs with dH2O and diiodomethane of 34.6° and 34.7°, respectively, demonstrating their hydrophilicity. The average CA of distilled water on the PT, NT, and NTB surfaces decreases accordingly, and the differences were statistically significant (P<0.05); there was no significant difference in CA of distilled water between the NTB1, NTB2, and NTB3 (P>0.05). The average CA of diiodomethane on the PT, NT, and NTB surfaces increased successively, but the differences were not statistically significant (P>0.05). The SFEs presented in Table 3 were calculated in accordance with the CA data and the Owens formula. The SFE of the PT, NT, and NTB increased sequentially, while the SFE of the NTB1, NTB2, and NTB3 were very close.
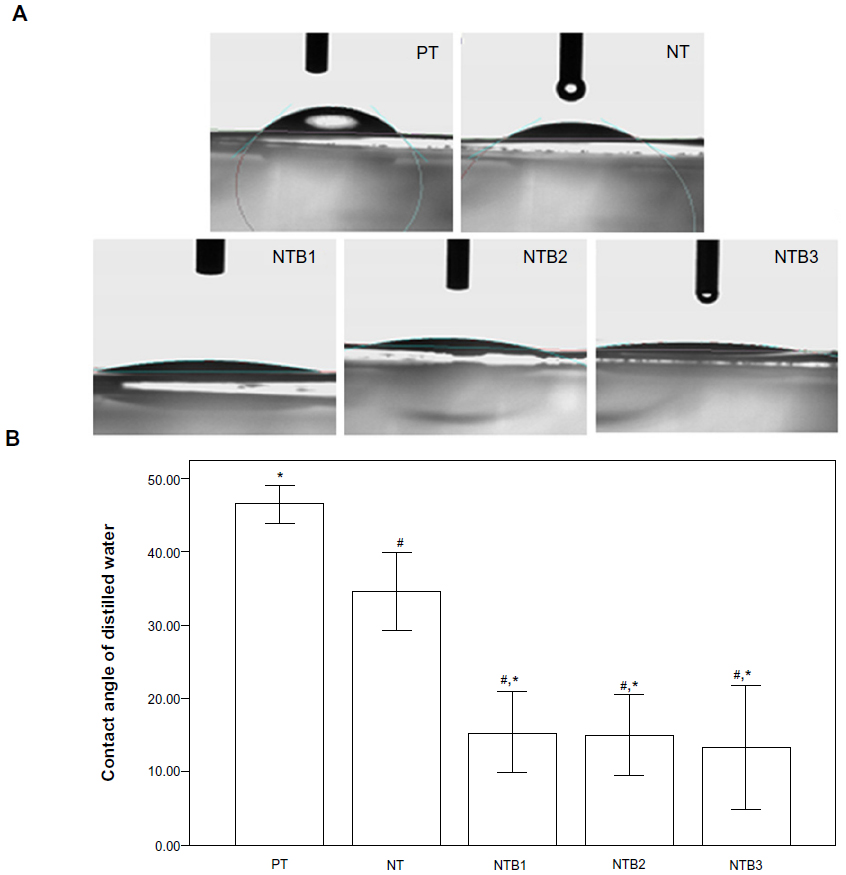 | Figure 3 (A) Image of the water contact angle on the sample surfaces. (B) Contact angles of probe liquids on the tested surfaces; data shown as means, and error bars represent 95% confidence intervals. |
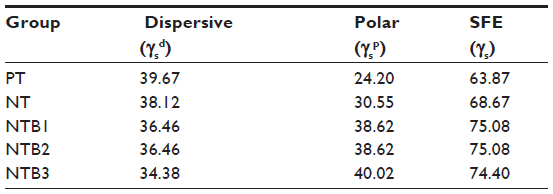 | Table 3 SFE (γs), polar (γsp), and dispersive (γsd) of the samples (mJ · m2) |
Cell morphology on Ti samples
Figure 4 indicates that the morphology of the HGFs changed over time after seeding onto the different surfaces. On the PT surface, most adherent cells exhibited a flat round shape 1 hour after seeding, revealed raised edges at 3 hours, and stretched toward the main cellular axis by 9 hours until they had completely spread out and were mostly spindle-like at 24 hours (Figure 4Aa–d). On the NT surfaces, most adherent cells displayed an oval shape and demonstrated raised edges on one side 1 hour after seeding before revealing obviously ellipsoid spherical shapes with many protruding pseudopodia and anchoring to the TNT surfaces at 3 hours; then extended to form irregular shapes by 9 hours, and they extended further and spread into mainly triangular and polygonal shapes at 24 hours (Figure 4Ae–h, Ba–d, Ca–d). On the NTB surfaces, the adherent cells revealed defined spherical shapes, many protruding pseudopodia and anchoring on the TNT surfaces 1 hour after seeding; they had extended toward the most polar direction with the thicker pseudopodia closely attached to the TNT surfaces by 3 hours (Figure 4Ai–l, Be–h, Ce–h). These cells extended further into triangular and polygonal shapes at 12 hours until they had completely spread and connected to each other at 24 hours.
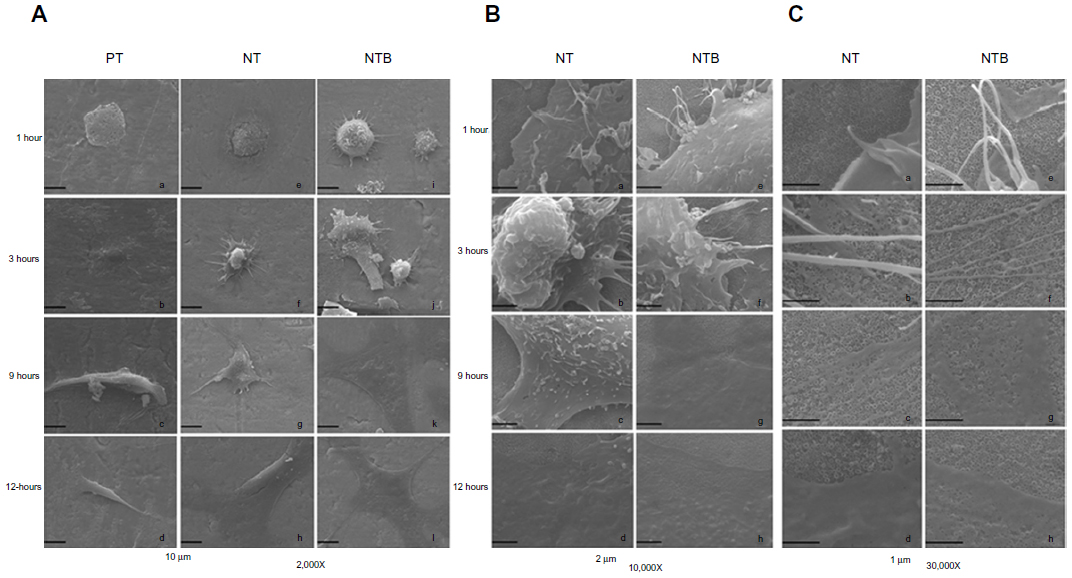 | Figure 4 Thermal field emission environmental SEM images of the HGF growth morphology after inoculation onto different titanium surfaces for 1 hour, 3 hours, 9 hours, and 24 hours. (A) 2,000× magnification, bar =10 μm; (a–d) PT; (e–h) NT; (i–l) NTB; (B) 10,000× magnification, bar =2 μm (a–d) NT; (e–h) NTB; (C) 30,000× magnification, bar =1 μm (a–d) NT; (e–h) NTB. |
Early cell adhesion
As illustrated in Figure 5A, the blue nuclei were counted directly on different fluorescently stained images at 200× magnification. Subsequently, the adhesion rates of the different groups were calculated to compare HGF attachment on the different surfaces at 1 hour and 3 hours, as presented in Figure 5B. Between 1 hour and 3 hours of incubation, the adhesion rate of the cells on the PT, NT, and NTB surfaces gradually increased (P<0.05). The adhesion rate of the cells on the PT or NTB surface significantly increased over time (P<0.05). However, there was no significant difference between the adhesion rates of the cells on the NT surface between 1 hour and 3 hours after seeding (P>0.05).
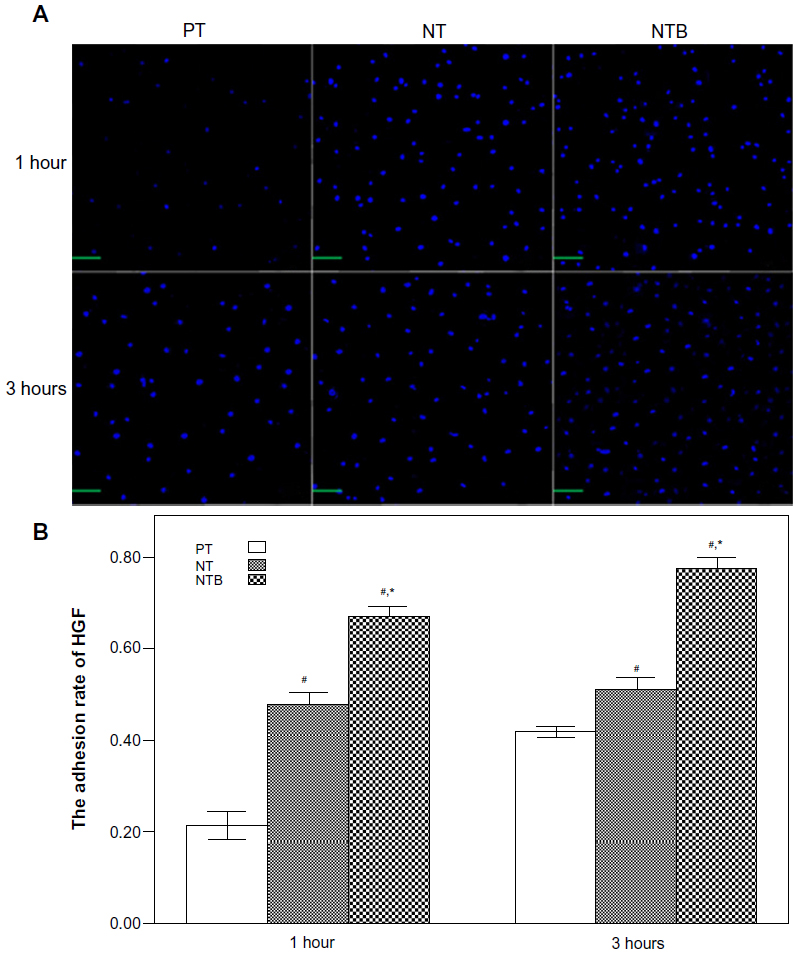 | Figure 5 (A) The stained nuclei of the HGFs adhered to the PT, NT, and NTB surfaces (200× magnification, bar =100 μm). (B) The early adhesion rate of the HGFs to the PT, NT, and NTB surfaces; data shown as means, and error bars represent 95% confidence intervals. |
Cell proliferation
Cell proliferation was evaluated with a MTS assay, as indicated in Figure 6A. There were no significant differences between the proliferative activities within the groups after 3, 4, or 7 days of incubation (P>0.05), while there was a significant difference at 14 days of incubation that was the most obvious on the NT surface (P<0.05). The respective proliferative activity of the HGFs on the PT, NT, or NTB surfaces increased over time, and significant differences were observed after 3, 4, 7, and 14 days (P<0.05).
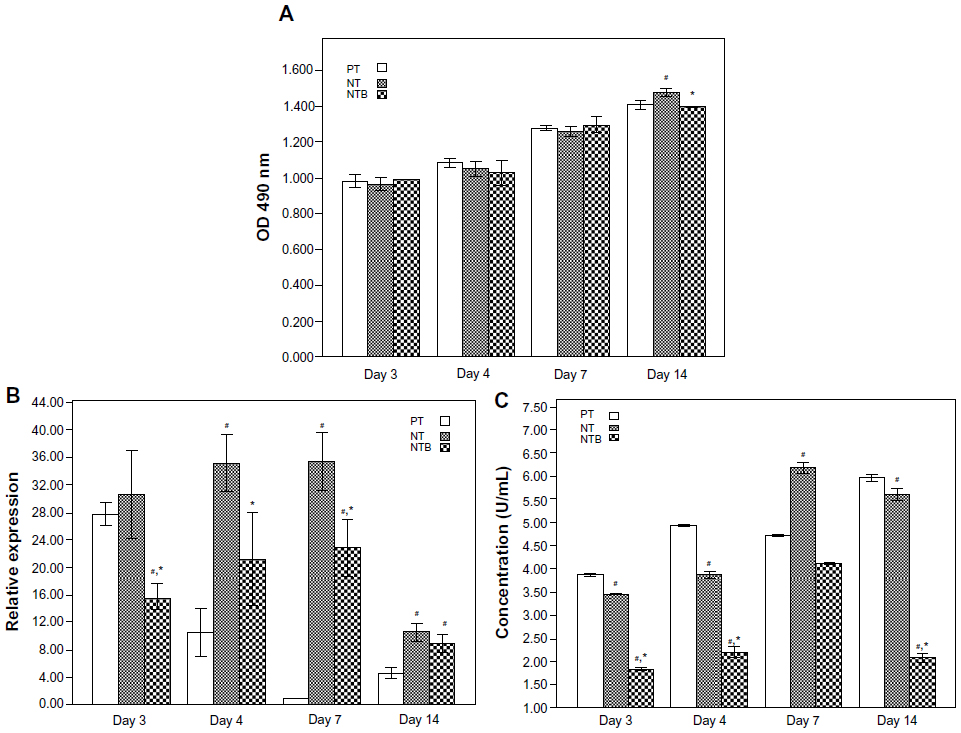 | Figure 6 (A) Proliferation of HGFs on PT, NT, and NTB surfaces (#P<0.05 versus PT, *P<0.05 NTB versus NT); (B) relative expression of the COL-1 gene mRNA in HGFs on PT, NT, and NTB surfaces (#P<0.05 versus PT, *P<0.05 NTB versus NT); (C) concentration of COL-1 secreted by HGFs on PT, NT, and NTB surfaces (#P<0.05 versus PT, *P<0.05 NTB versus NT). |
Gene expression of type I collagen (COL-1)
The mRNA expression level of the COL-1 gene was determined using relative quantification analysis. Two amplification curves and two melting curves were generated from the two different primers (COL-1 and 18S rRNA). The cycle threshold (Ct) values were obtained via amplification curve analysis. As presented in Figure 6B, there were significant differences in mRNA expression levels of COL-1 gene between the groups after 3, 4, 7, or 14 day incubations. The relative expression on the NT surface was higher than on the PT surface after 4, 7, and 14 days of inoculation (P<0.05); there was no significant difference 3 days after inoculation (P>0.05). The relative expression on the NTB surface was higher than on the PT surface only after 7 and 14 days after inoculation (P<0.05), but was lower than on the NT surface after 3, 4, and 7 days of inoculation (P<0.05). The relative expression levels of COL-1 were calculated after sampling HGFs grown in a single culture on tissue culture plastic as a reference, using equations 4–7:

Concentration of COL-1
COL-1 concentrations are summarized in Figure 6C. There was a significant difference between PT and NT after 3, 4, 7, and 14 days of incubation; the highest value was obtained for PT surface after 7 days of inoculation (P<0.05). The COL-1 concentration on the NTB surface was the lowest 3, 4, and 14 days after inoculation (P<0.05); there was no significant difference between the PT and the NTB 7 days after inoculation (P>0.05).
Discussion
Physical characteristics
In this study, TNTs were fabricated by anodizing Ti sheets and loaded them with BSA through a simplified drying method. The physical characteristics, such as morphology, chemical composition, Ra, CA, and SFE, of the Ti surfaces with TNTs or TNTs-BSA were assessed to provide experimental evidence for the surface modification at the transmucosal area of Ti implants.
The neatly arranged TNTs approximately 80–100 nm in diameter were prepared and had a strong adsorption capacity for BSA. The loading efficiency of 200, 400, and 600 μg BSA in TNTs approached 99%. XPS analyses revealed that the chemical substances on the TNT surfaces were TiO2, CaO, Ca(OH)2, and organic contaminants containing C, Si, -OH. The -OH is important as, generally, if the titanium displayed biological activity in the physiological environment, the surface layer should have numerous active-OH groups to form titanium salts (Ti[OH]4); these conditions were critical for the deposition of calcium and phosphate, in addition to protein adsorption and cell adhesion.37 Therefore, the biological activities of the TNT surfaces examined in this study might be related to the active -OH groups.
BSA contains 581 amino acid residues with 17 disulfide bonds and one free mercapto group formed by 35 cysteine acids. Therefore, the molecular structure of BSA mostly contained C, H, O, and N while also including S. Varying amounts of BSA were absorbed by the TNTs to form the NTB surfaces. The Ti, O, and Ca contents on the NTB surfaces were lower than those on the PT and NT surfaces; the C and N contents on the NTB surfaces were significantly increased as detected by XPS analysis, and S appeared on the NTB2 and NTB3 surfaces. It should be noted that S is not identified on the NTB1 surface. We think that is because there is quite a small amount of S in the BSA molecule, and 200 μg of BSA could not cover the entire section of TNTs. Therefore, different amounts of BSA were really adsorbed on NTB surfaces, and 400 μg of BSA could cover almost an entire 1 cm × 1 cm section of TNTs.
The results of the CAs revealed that the mean distilled CAs on the PT, NT, and NTB surfaces decreased accordingly, and these differences were significant, indicating that the hydrophilicity of the TNT surface was stronger than that of pure Ti; the hydrophilicity was further enhanced after BSA was added. The SFE on PT, NT, and NTB surfaces increased sequentially. The Ra gradually increased on Ti, NT, NTB1, and NTB2 surfaces, but all of them were less than 500 nm, indicating that the PT, NT, and NTB surfaces were smooth.
In conclusion, the biological activity of TNT surfaces might be related to the numerous active -OH groups present. Additionally, 400 μg BSA could completely cover the TNT surfaces, and the formed surface was as smooth as the unmodified TNT surface. Therefore, TNT surfaces loaded with 400 μg BSA were selected for cytological experiments on behalf of the NTB surface. Moreover, the surface hydrophilicity, SFE, and Ra values of the polished pure titanium, the TNTs, and the TNTs loaded with BSA increased sequentially.
Effects on the biological behavior of HGF
The interactions between materials and tissues are critical during the biological reactions of cells on material surfaces. We must initially study the biological response of gingival fibroblasts on TNTs to determine whether the transmucosal area modified with TNTs can generate a sealing effect with the soft tissue. Because cell responses to the material occur after protein adsorption, the protein adsorption layer must be involved in the interactions between the cells and the materials. Material surface properties significantly affect protein adsorption;38,39 however, protein adsorption may also alter surface properties, affecting the biological activity of the materials. Whether loading BSA affects the biological activity of TNTs and affects adhesion, the spread, proliferation, and secretion of gingival fibroblasts on TNTs surfaces must be studied. Through cytological assays involving HGFs on TNT surfaces, early adhesion, proliferation activity, COL-1 gene expression, and extracellular secretion of COL-1 were detected; these results may be used to explore the effects of TNT surfaces with or without BSA on the behavior of HGFs while providing experimental evidence that the surface of the transmucosal area on Ti implants had been modified.
After 1 hour and 3 hours of incubation, the HGF adhesion rates in PT, NT, and NTB gradually increased, revealing that the TNT surface improves early HGF adhesion rates; the surface of the BSA-loaded TNTs may provide a greater enhancement. Initially, the surface may be colonized by soft tissue cells that construct the matrix used to begin connective tissue synthesis, which is beneficial for one of three requirements for the transmucosal area that is facilitating the attachment of soft tissue. Therefore, a series of changes in HGF morphology occurs, ranging from attachment to the Ti sample surfaces to complete spreading; these changes were observed by SEM. The cell spreading on the PT surface primarily formed spindles or long triangular shapes, whereas cell spreading on the NT or NTB surface formed triangular and polygonal shapes more frequently. In our opinion, HGF spreading into spindles may lead to formation of fibers aligned in parallel, and HGF spreading into polygonal shapes may lead to the formation of interlaced fibers, which may adhere to the transmucosal area more strongly than parallel ones. Furthermore, cell spreading on the NTB surface was faster than on the NT surface. In addition, HGF adhesion rate on the PT, NT, and NTB surfaces gradually increased from 1 hour to 3 hours after inoculation, implying that a Ti surface functionalized with TNTs could increase the early adhesion rate of HGF and that adding BSA to the TNTs surface could further enhance this effect. Therefore, TNT surfaces promote early HGF adhesion and spreading behaviors that the BSA-loaded TNTs surface further promoted. HGF adhesion and spreading behaviors on the Ti surface are closely related to the surface properties. TNT surfaces contain numerous active-OH groups with biological activity that favor extracellular matrix protein binding, followed by early adhesion and cell spreading. The surface properties changed when BSA was added to the TNTs, while the hydrophilicity and SFE of the BSA-loaded TNTs significantly increased. Usually, on high-SFE surfaces, biological macromolecules are easily absorbed, increasing the attachment points available for the precursor cells and facilitating biofouling.40 Therefore, the effects of the BSA-loaded TNT surface that promote early adhesion and HGF spreading were also more robust. In short, on the polished titanium, TNTs, and BSA-loaded TNT surfaces, the hydrophilicity, SFE, and Ra gradually increased, respectively. Similarly, early adhesion and cell spreading behaviors of HGFs gradually increased, respectively, indicating that early adhesion and spreading behaviors of HGFs were positively correlated with surface characteristics, such as hydrophilicity, SFE, and roughness.
The cell proliferation assay indicated that TNT surfaces could promote late proliferation activity in HGF, while BSA-loaded TNTs inhibited it.
Collagen is the major component of extracellular matrices in gingival connective tissue, and COL-1 is a major component of collagen. Therefore, secreting collagen is a prinicpal characteristic function of gingival fibroblasts. The gene expression and extracellular secretion of COL-1 may reflect the functional status of gingival fibroblasts. From the COL-1 mRNA expression, we discovered that the TNT surfaces significantly promoted COL-1 gene expression, while the surface of the BSA-loaded TNTs inhibited the early expression of the COL-1 gene and slightly promoted its late expression. From COL-1 secretion, we ascertained that the TNT surfaces only promoted extracellular secretion of COL-1 7 days after cell inoculation, while the BSA-loaded TNTs inhibited this secretion; both the TNT and BSA-loaded TNT surfaces inhibited the secretion of COL-1 at 3, 4, and 14 days; the latter inhibition being more obvious. The extracellular secretion of COL-1 indicates that the COL-1 gene was expressed at the post-transcriptional level and was not the same as COL-1 gene expression levels. The experimental results reveal that the TNT surface with or without BSA promoted the increase of COL-1 gene expression, but the transcription of this gene was not fully realized, resulting in different degrees of decreases in the secretion of COL-1 by HGF at various times. Briefly, TNT surfaces greatly promote intracellular COL-1 gene expression and may promote extracellular secretion of COL-1 in some cases; BSA-loaded TNTs surfaces inhibited this early expression, but promoted late expression of the COL-1 gene while consistently inhibiting the extracellular secretion of COL-1.
According to Gristina’s theory of surface competition,41 tissue cells and oral bacteria may competitively attach to the implant’s surface, which has led us to make a series of speculations outlined in the following text. TNT surfaces promoted early HGF adhesion; the BSA-loaded TNT surfaces could further promote adhesion. Therefore, the gingival fibroblasts may adhere to this surface before the oral bacteria, aiding the formation of a closed loop of connective tissue around the implant. BSA-loaded TNT surfaces may generate stronger competition against the bacteria over the attachment sites and, together with the antibacterial properties of serum proteins,28,29 this effect may provide the surface with a more stable antibacterial effect. However, when forming a wide and tight-attached connective tissue closed loop, HGF proliferation and collagen quality were also very important. TNT surfaces greatly promote the late proliferation activity of the HGF while promoting the extracellular secretion of COL-1, which is beneficial for forming a tightly attached closed loop of connective tissue around the transmucosal area; unfortunately, the BSA-loaded TNT surfaces inhibited the late stage proliferation activity of the HGF and the secretion of the COL-1, making them unable to aid in the formation of a tightly attached closed loop of connective tissue around the transmucosal area. Therefore, TNT surfaces can promote the early adhesion of HGF and COL-1 secretion, which we speculate competitively inhibit plaque adhesion, which is beneficial for facilitating the formation of a closed loop of connective tissue around the transmucosal area. These features achieve the desired performance for a surface at the transmucosal area, suggesting that a smooth TNT-modified surface may become a viable option for use in the transmucosal area. It is worth noting that BSA-loaded TNT surfaces can promote the early adhesion of HGF, which we also speculate will inhibit plaque adhesion, but suppresses the late proliferation activity and COL-1 secretion by HGFs. Further studies are required to determine whether BSA-loaded TNTs surfaces actually affect connective tissue closed loop formation because BSA coating actions in vivo are very rapid.
Conclusion
In this study, we demonstrated that the early adhesion and spreading behaviors of HGFs were positively correlated with surface characteristics, such as hydrophilicity, SFE, and Ra. Additionally, TNT surfaces not only promote the early adhesion of HGFs but also promoted COL-1 secretion, while competitive inhibition of plaque adhesion is speculated; this system is expected to form a tightly attached closed loop of connective tissue around the transmucosal area. These features comply with the desired performance for a surface at the transmucosal area, suggesting that smooth TNT-modified surfaces may become a viable option for use in the transmucosal area. BSA-loaded TNT surfaces can promote the early adhesion of HGF, while, again, we speculate that plaque adhesion will be inhibited. Further studies are required to determine whether BSA-loaded TNT surfaces can actually affect the closed loop formation of connective tissue because the BSA coating activity has a very short duration in vivo, even though this surface may suppress the late proliferation activity and COL-1 secretion by HGF.
This study provides new ideas for modifying the surface of an implant’s transmucosal area; however, additional in-depth studies are still required to elucidate the exact mechanism of the soft tissue’s response to TNTs with or without coating and verify the antibacterial performances of TNTs with or without coating.
Acknowledgments
This work was supported by grants from the Natural Science Foundation of China (No 81170998) and the Natural Science Foundation of China for young scholars (No 81300908).
Disclosure
The authors report no conflicts of interest in this work.
References
Coelho PG, Marin C, Granato R, Bonfante EA, Lima CP, Suzuki M. Surface treatment at the cervical region and its effect on bone maintenance after immediate implantation: an experimental study in dogs. Oral Surg Oral Med Oral Pathol Oral Radiol Endod. 2010;110(2):182–187. | |
Coelho PG, Granjeiro JM, Romanos GE, et al. Basic research methods and current trends of dental implant surfaces. J Biomed Mater Res B Appl Biomater. 2009;88(2):579–596. | |
Daugaard H, Elmengaard B, Bechtold JE, Soballe K. Bone growth enhancement in vivo on press-fit titanium alloy implants with acid etched microtexture. J Biomed Mater Res A. 2008;87(2):434–440. | |
Elmengaard B, Bechtold JE, Søballe K. In vivo effects of RGD-coated titanium implants inserted in two bone-gap models. J Biomed Mater Res A. 2005;75(2):249–255. | |
Zainali K, Danscher G, Jakobsen T, et al. Effects of gold coating on experimental implant fixation. J Biomed Mater Res A. 2009;88(1):274–280. | |
Werner S, Huck O, Frisch B, et al. The effect of microstructured surfaces and laminin-derived peptide coatings on soft tissue interactions with titanium dental implants. Biomaterials. 2009;30(12):2291–2301. | |
Hoshi N, Negishi H, Okada S, Nonami T, Kimoto K. Response of human fibroblasts to implant surface coated with titanium dioxide photocatalytic films. J Prosthodont Res. 2010;54(4):185–191. | |
Fröjd V, Linderbäck P, Wennerberg A, Chávez de Paz L, Svensäter G, Davies JR. Effect of nanoporous TiO2 coating and anodized Ca2+ modification of titanium surfaces on early microbial biofilm formation. BMC Oral Health. 2011;11:8. | |
Franková J, Pivodová V, Růžička F, Chávez de Paz L, Svensäter G, Davies JR. Comparing biocompatibility of gingival fibroblasts and bacterial strains on a different modified titanium discs. J Biomed Mater Res A. 2013;101(10):2915–2924. | |
Botos S, Yousef H, Zweig B, Flinton R, Weiner S. The effects of laser microtexturing of the dental implant collar on crestal bone levels and peri-implant health. Int J Oral Maxillofac Implants. 2011;26(3):492–498. | |
Hermann JS, Jones AA, Bakaeen LG, Buser D, Schoolfield JD, Cochran DL. Influence of a machined collar on crestal bone changes around titanium implants: a histometric study in the canine mandible. J Periodontol. 2011;82(9):1329–1338. | |
Subramani K, Jung RE, Molenberg A, Hammerle CH. Biofilm on dental implants: a review of the literature. Int J Oral Maxillofac Implants. 2009;24(4):616–626. | |
Könönen M, Hormia M, Kivilahti J, Hautaniemi J, Thesleff I. Effect of surface processing on the attachment, orientation, and proliferation of human gingival fibroblasts on titanium. J Biomed Mater Res. 1992;26(10):1325–1341. | |
Adell R, Lekholm U, Rockler B, Brånemark PI. A 15-year study of osseointegrated implants in the treatment of the edentulous jaw. Int J Oral Surg. 1981;10(6):387–416. | |
King GN, Hermann JS, Schoolfield JD, Buser D, Cochran DL. Influence of the size of the microgap on crestal bone levels in non-submerged dental implants: a radiographic study in the canine mandible. J Periodontol. 2002;73(10):1111–1117. | |
Goswami M. Comparison of crestal bone loss along two implant crest module designs. MJAFI. 2009;65(4):319–322. | |
Coelho PG, Marin C, Granato R, Bonfante EA, Lima CP, Suzuki M. Surface treatment at the cervical region and its effect on bone maintenance after immediate implantation: an experimental study in dogs. Oral Surg Oral Med Oral Pathol Oral Radiol Endod. 2010;110(2):182–187. | |
Novaes AB, de Oliveira RR, Muglia VA, Papalexiou V, Taba M. The effects of interimplant distances on papilla formation and crestal resorption in implants with a morse cone connection and a platform switch: a histomorphometric study in dogs. J Periodontol. 2006;77(11):1839–1849. | |
Kim H, Murakami H, Chehroudi B, Textor M, Brunette DM. Effects of surface topography on the connective tissue attachment to subcutaneous implants. Int J Oral Maxillofac Implants. 2006;21(3):354–365. | |
Glauser R, Schüpbach P, Gottlow J, Hämmerle CH. Periimplant soft tissue barrier at experimental one-piece mini-implants with different surface topography in humans: A light-microscopic overview and histometric analysis. Clin Implant Dent Relat Res. 2005;7 Suppl 1:S44–S51. | |
Alomrani AN, Hermann JS, Jones AA, Buser D, Schoolfield J, Cochran DL. The effect of a machined collar on coronal hard tissue around titanium implants: a radiographic study in the canine mandible. Int J Oral Maxillofac Implants. 2005;20(5):677–686. | |
Macák JM, Tsuchiya H, Schmuki P. High-aspect-ratio TiO2 nanotubes by anodization of titanium. Angew Chem Int Ed Engl. 2005;44(14):2100–2102. | |
Oh S, Brammer KS, Li YS, et al. Stem cell fate dictated solely by altered nanotube dimension. Proc Natl Acad Sci U S A. 2009;106(7):2130–2135. | |
Das K, Bose S, Bandyopadhyay A. TiO2 nanotubes on Ti: Influence of nanoscale morphology on bone cell-materials interaction. J Biomed Mater Res A. 2009;90(1):225–237. | |
Brammer KS, Oh S, Cobb CJ, Bjursten LM, van der Heyde H, Jin S. Improved bone-forming functionality on diameter-controlled TiO(2) nanotube surface. Acta Biomater. 2009;5(8):3215–3223. | |
Popat KC, Eltgroth M, LaTempa TJ, Grimes CA, Desai TA. Titania nanotubes: a novel platform for drug-eluting coatings for medical implants? Small. 2007;3(11):1878–1881. | |
Popat KC, Eltgroth M, Latempa TJ, Grimes CA, Desai TA. Decreased Staphylococcus epidermis adhesion and increased osteoblast functionality on antibiotic-loaded titania nanotubes. Biomaterials. 2007;28(32):4880–4888. | |
An YH, Stuart GW, McDowell SJ, McDaniel SE, Kang Q, Friedman RJ. Prevention of bacterial adherence to implant surfaces with a crosslinked albumin coating in vitro. J Orthop Res. 1996;14(5):846–849. | |
Kinnari TJ, Peltonen LI, Kuusela P, Kivilahti J, Könönen M, Jero J. Bacterial adherence to titanium surface coated with human serum albumin. Otol Neurotol. 2005;26(3):380–384. | |
Chakraborty J, Mazaj M, Kapoor R, et al. Bone-like growth of hydroxyapatite in the biomimetic coating of Ti-6Al-4V alloy pretreated with protein at 25 degrees C. J Mater Res. 2009;24(6):2145–2153. | |
Bao HZ, Inho H, Hai LF, Wei B, Cui FZ, Lee IS. Histological and histomorphometrical study of connective tissue around calcium phosphate coated titanium dental implants in a canine model. Surface and Coatings Technology. 2007;201 (9–11):5696–5700. | |
Buser D, Weber HP, Donath K, Fiorellini JP, Paquette DW, Williams RC. Soft tissue reactions to non-submerged unloaded titanium implants in beagle dogs. J Periodontol. 1992;63(3):225–235. | |
Toth RW, Parr GR, Gardner LK. Soft tissue response to endosseous titanium oral implants. J Prosthet Dent. 1985;54(4):564–567. | |
Comut AA, Weber HP, Shortkroff S, Cui FZ, Spector M. Connective tissue orientation around dental implants in a canine model. Clin Oral Implants Res. 2001;12(5):433–440. | |
Huang L, Zhang S, Peng F, et al. Electrodeposition preparation of octahedral-Cu2O-loaded TiO2 nanotube arrays for visible light-driven photocatalysis. Scripta Mater. 2010;63(2):159–161. | |
Owens DK, Wendt RG. Estimation of the surface free energy of polymers. J Appl Polym Sci. 1969;13(8):1741–1747. | |
Kasemo B. Biocompatibility of titanium implants: surface science aspects. J Prosthet Dent. 1983;49(6):832–837. | |
Dee KC, Puleo DA, Bizios R. An Introduction to Tissue-Biomaterial Interactions. Hoboken: John Wiley and Sons Inc; 2002. | |
Chen H, Yuan L, Song W, Wu Z, Li D. Biocompatible polymer materials: Role of protein-surface interactions. Prog Polym Sci. 2008;33(11):1059–1087. | |
Zhao G, Schwartz Z, Wieland M, et al. High surface energy enhances cell response to titanium substrate microstructure. J Biomed Mater Res A. 2005;74(1):49–58. | |
Gristina AG. Biomaterial-centered infection: microbial adhesion versus tissue integration. Science. 1987;237(4822):1588–1595. |
 © 2014 The Author(s). This work is published and licensed by Dove Medical Press Limited. The full terms of this license are available at https://www.dovepress.com/terms.php and incorporate the Creative Commons Attribution - Non Commercial (unported, v3.0) License.
By accessing the work you hereby accept the Terms. Non-commercial uses of the work are permitted without any further permission from Dove Medical Press Limited, provided the work is properly attributed. For permission for commercial use of this work, please see paragraphs 4.2 and 5 of our Terms.
© 2014 The Author(s). This work is published and licensed by Dove Medical Press Limited. The full terms of this license are available at https://www.dovepress.com/terms.php and incorporate the Creative Commons Attribution - Non Commercial (unported, v3.0) License.
By accessing the work you hereby accept the Terms. Non-commercial uses of the work are permitted without any further permission from Dove Medical Press Limited, provided the work is properly attributed. For permission for commercial use of this work, please see paragraphs 4.2 and 5 of our Terms.