")
Back to Journals » International Journal of Nanomedicine » Volume 9 » Issue 1
Effects of magnetic cobalt ferrite nanoparticles on biological and artificial lipid membranes
Authors Drašler B, Drobne D, Novak S, Valant J, Boljte S, Otrin L, Rappolt M, Sartori B, Iglič A, Kralj-Iglič V , Šuštar V, Makovec D, Gyergyek S, Hočevar M, Godec M, Zupanc J
Received 16 November 2013
Accepted for publication 1 January 2014
Published 27 March 2014 Volume 2014:9(1) Pages 1559—1581
DOI https://doi.org/10.2147/IJN.S57671
Checked for plagiarism Yes
Review by Single anonymous peer review
Peer reviewer comments 3
Video abstract presented by Barbara Drašler and Jernej Zupanc.
Views: 4821
Barbara Drašler,1 Damjana Drobne,1–3 Sara Novak,1 Janez Valant,1 Sabina Boljte,1,4 Lado Otrin,1 Michael Rappolt,5,6 Barbara Sartori,5 Aleš Iglic,7 Veronika Kralj-Iglic,8 Vid Šuštar,9 Darko Makovec,3,10 Sašo Gyergyek,10 Matej Hocevar,11 Matjaž Godec,11 Jernej Zupanc1
1University of Ljubljana, Biotechnical Faculty, Department of Biology, Ljubljana, 2Centre of Excellence in Advanced Materials and Technologies for the Future, Ljubljana, 3Centre of Excellence in Nanoscience and Nanotechnology, Ljubljana, 4Institute of Microbial Sciences and Technologies, Ljubljana, Slovenia; 5Institute of Inorganic Chemistry, Graz University of Technology, Basovizza, Italy; 6School of Food Science and Nutrition, University of Leeds, Leeds, UK; 7Faculty of Electrical Engineering, University of Ljubljana, Ljubljana, 8Faculty of Health Sciences, Laboratory of Clinical Biophysics, University of Ljubljana, Ljubljana 9Laboratory of Clinical Biophysics, Chair of Orthopaedics, Faculty of Medicine, University of Ljubljana, Ljubljana, 10Institute Jožef Stefan, Ljubljana, 11Institute of Metals and Technology, Ljubljana, Slovenia
Background: The purpose of this work is to provide experimental evidence on the interactions of suspended nanoparticles with artificial or biological membranes and to assess the possibility of suspended nanoparticles interacting with the lipid component of biological membranes.
Methods: 1-Palmitoyl-2-oleoyl-sn-glycero-3-phosphocholine (POPC) lipid vesicles and human red blood cells were incubated in suspensions of magnetic bare cobalt ferrite (CoFe2O4) or citric acid (CA)-adsorbed CoFe2O4 nanoparticles dispersed in phosphate-buffered saline and glucose solution. The stability of POPC giant unilamellar vesicles after incubation in the tested nanoparticle suspensions was assessed by phase-contrast light microscopy and analyzed with computer-aided imaging. Structural changes in the POPC multilamellar vesicles were assessed by small angle X-ray scattering, and the shape transformation of red blood cells after incubation in tested suspensions of nanoparticles was observed using scanning electron microscopy and sedimentation, agglutination, and hemolysis assays.
Results: Artificial lipid membranes were disturbed more by CA-adsorbed CoFe2O4 nanoparticle suspensions than by bare CoFe2O4 nanoparticle suspensions. CA-adsorbed CoFe2O4-CA nanoparticles caused more significant shape transformation in red blood cells than bare CoFe2O4 nanoparticles.
Conclusion: Consistent with their smaller sized agglomerates, CA-adsorbed CoFe2O4 nanoparticles demonstrate more pronounced effects on artificial and biological membranes. Larger agglomerates of nanoparticles were confirmed to be reactive against lipid membranes and thus not acceptable for use with red blood cells. This finding is significant with respect to the efficient and safe application of nanoparticles as medicinal agents.
Keywords: CoFe2O4, nanoparticles, agglomerates, human red blood cells, lipid vesicles
Introduction
Knowledge of the interactions between magnetic nanoparticles (NPs) and plasma membranes is essential to the design of biomedical applications of NPs,1 such as magnetic resonance imaging, hyperthermic treatment of malignant cells, and site-specific drug delivery.2 As a consequence of their small size,3 mechanical hardness, and heat generation potential,4 cobalt ferrite (CoFe2O4) NPs have been one of the most extensively investigated magnetic NPs for medical purposes.5 With enhanced anisotropy and saturation magnetization, CoFe2O4 meets the criteria for a useful material in magnetic hyperthermia-induced cancer treatment based on an increase in temperature at the heat center of the NP upon interaction with an alternating magnetic field.6 A better understanding of the interactions between magnetic NPs and membranes can be achieved by assessment of their biocompatibility when used as potential diagnostic and therapeutic agents.7,8 When NPs are administered intravenously, they interact with both target and nontarget cells, resulting in systemic effects including blood coagulation and changes in membrane permeability.9 It has been proposed10 that one of the first contacts between NPs and cells occurs at the cell membrane, where the NPs interact physically with the lipid bilayer.11,12 Experimental, computational, and theoretical studies suggest that the NP-lipid interaction at the membrane can compromise the structure and function of both artificial and biological membranes.1,12–16 NPs and their agglomerates can be adsorbed onto the membrane and cause its structural reorganization,13–16 leading to changes in membrane curvature,17–19 particle internalization,20 and pore and hole formation.21,22
The interactions between lipid bilayers and solid surfaces are complex and can involve van der Waals, electrostatic, hydration, hydrophobic, or protrusion forces.23,24 In the case of NPs, their interactions with membranes have been found to be largely controlled by the shape and size of the NPs and their surface chemistry.13,14,25–27 When suspended in biological fluids, NPs form agglomerates of different sizes that may exert biological effects different from those caused by single particles.18,28,29 Moreover, NPs can be modified by their adsorption into biomolecules, which leads to their adhesion to the cell membrane.30 Despite many experimental and theoretical studies, it is still not fully understood how various characteristics of NPs and membranes define their interactions.
Experimental studies on interactions between NPs and lipid membranes are generally based on artificial lipid membranes, including compounds like 1-palmitoyl-2-oleoyl-sn-glycero-3-phosphocholine (POPC), which are zwitterionic lipids with dipolar but electrically neutral head groups.31 In studies of the effects of chemical and physical factors on biological membranes, human red blood cells (RBCs), ie, erythrocytes, have been frequently used as biologically relevant experimental models.32,33 It is known that adsorption of NPs onto the surface of RBCs can change cell morphology and erythrocyte sedimentation rate, agglutination of RBCs, and hemolysis.1,18,27,34–39 An interesting question is whether mechanisms revealed by experimental studies of artificial membranes or computer simulations of interactions between NPs and artificial lipid membranes can also explain the interactions of NPs with biological membranes.
We hypothesized that the effect of magnetic CoFe2O4 NPs on artificial lipid membranes manifests itself in RBCs as cell shape transformation. The effect depends on the degree of agglomeration of NPs in suspension.29 We approached this question by studying the response of RBCs and artificial lipid vesicles when incubated with suspensions of two types of magnetic NPs, ie, bare CoFe2O4 NPs and citric acid (CA)-adsorbed CoFe2O4 NPs. The latter were coated with CA to make them negatively charged and to prevent aggregation.40 To simulate biological and in vitro conditions, the NPs were dispersed in two different solutions, ie, a glucose solution and phosphate-buffered saline (PBS-citrate buffer). Measurements showed that either of these types of medium could significantly alter the characteristics of NP suspensions and cause formation of agglomerates which, along with NPs, have the potential to react with artificial cell membranes as well as with natural cell membranes. The results obtained with artificial lipid vesicles were validated in experiments with RBCs. The potential of NPs and/or their agglomerates to interact with lipid membranes and the possible mechanisms of interaction are discussed.
Materials and methods
Chemicals
POPC and cholesterol were obtained from Avanti Polar Lipids, Inc. (Alabaster, AL, USA). Stock solutions (1 mg/mL) of both POPC and cholesterol were prepared by dissolving the lipid in a mixture of CHCl3 and MeOH (2:1, v/v). Sucrose, glucose, paraformaldehyde, CHCl3, and MeOH were purchased from Sigma-Aldrich (Steinheim, Germany), NaCl, NaH2PO4 · 2H2O, Na2HPO4 · 2H2O, and Triton X-100 surfactant (OmniPur®) from Merck KGaA (Darmstadt, Germany), and KCl and KH2PO4 from Kemika (Zagreb, Croatia). Phosphate-buffered saline (PBS-citrate buffer; 137 mM NaCl, 2.7 mM KCl, 7.8 mM Na2HPO4 · 2H2O, 1.5 mM KH2PO4, pH 7.4) was prepared using ultrapure distilled H2O and filtered before use through 0.22 μm pore filters. Modified Karnovsky fixative was prepared from 2.5% glutaraldehyde, 0.4% paraformaldehyde, and 1 M Na-phosphate buffer (NaH2PO4 · 2H2O and Na2HPO4 · 2H2O). Glutaraldehyde, osmium tetroxide (OsO4), and hexamethyldisilazane were purchased from SPI Supplies (West Chester, PA, USA).
Preparation and characterization of NPs
CoFe2O4 NPs were synthesized by coprecipitation from aqueous solutions of Co(II) and Fe(III) ions as described in detail by Gyergyek et al.41 Briefly, an aqueous solution of Co(II) and Fe(III) sulphates (Co2+ 0.108 mol/L and Fe3+ 0.201 mol/L) was heated to 80°C, and NaOH aqueous solution (3.5 mol/L) was added rapidly in a single aliquot with vigorous stirring. After aging for 2 hours at 80°C, the suspension was allowed to cool to room temperature. The precipitated NPs were isolated using a permanent magnet and the unreacted ions were washed several times with distilled deionized water. The suspension of bare CoFe2O4 NPs was prepared by dispersing washed NPs in pure distilled deionized water. To obtain the CoFe2O4 NPs with modified surfaces, CA was adsorbed onto the synthesized CoFe2O4 NPs using a process described previously.42 The washed CoFe2O4 NPs were dispersed in pure distilled deionized water in a round-bottom flask and an aqueous solution of CA (0.6 g/mL) was added. The pH value of the suspension was adjusted to 5.2 by addition of NH4OH aqueous solution. The suspension was heated to 80°C, allowed to stand for 1.5 hours, and then left to cool to room temperature. The CA-adsorbed CoFe2O4 NPs were flocculated by addition of acetone and separated with a permanent magnet. Excess CA was removed with acetone. The suspension of CA-adsorbed CoFe2O4 NPs was prepared by dispersing washed NPs in pure distilled deionized water. The adsorbed CA provides a strong negative zeta potential, which electrostatically prevents agglomeration of the NPs in the aqueous suspension. The suspension was obtained by separation of CA-adsorbed CoFe2O4 NPs using a combination of centrifugation and an external magnetic field. After centrifugation, approximately 50 mL of the supernatant in a vial (25 mm diameter, 60 mm high) was placed onto the Nd-Fe-B permanent magnet (50 mm × 30 mm × 10 mm). The magnetic field at the surface of the magnet, measured by a Gaussmeter, was approximately 0.5 T. Because bare CoFe2O4 NPs sedimented rapidly in both suspensions (0.3 M glucose solution or PBS-citrate buffer), the suspensions were thoroughly vortexed before incubation with giant unilamellar vesicles (GUVs), multilamellar vesicles (MLVs), or RBCs. Both the precipitated material and the nonsedimented fraction of the material were used in the experiments.
The phase purity of the NPs was checked using X-ray powder diffraction (D5000, Siemens AG, Karlsruhe, Germany). The average crystal size was estimated from broadening of X-ray powder diffraction reflections based on the Scherrer method.43 The whole-powder pattern fitting procedure was employed whereby crystal size was fitted using the crystallographic software package (Topas™). The contribution of instrumental broadening of the diffraction lines was described by convolution of individual broadening functions derived from the instrument’s parameters.44
Transmission electron microscopy (TEM) images were obtained using a JEOL 2100 (JEOL Ltd, Tokyo, Japan), operated at 200 kV. The specimens for TEM were prepared by drying the suspension of NPs in water (pH ~7) at room temperature on a transparent carbon foil supported on a copper grid. The particle size expressed as an equivalent diameter was estimated to be >300 NPs from visual measurement of the TEM images. The area of the NPs was estimated from TEM images using a DigitalMicrograph™ (Gatan Inc., Software, Pleasanton, CA , USA).
Dynamic light scattering measurements of the hydrodynamic size of the particles were performed in suspensions of different concentrations using an Analysette 12 DynaSizer (Fritsch GmbH, Idar-Oberstein, Germany). The zeta potentials of the bare and CA-adsorbed CoFe2O4 NPs suspended in either a 0.3 M aqueous solution of glucose or in PBS-citrate buffer were measured with a ZetaPALS (Brookhaven Instruments Corp, Holtsville, NY, USA). The osmolarity of all the tested NP suspensions, the same concentration of NP suspensions as used in the experiments (0.1 mg/mL or 1 mg/mL in 0.3 M glucose solution or in PBS-citrate buffer, respectively), was assessed using a Semi-Micro Osmometer K-7400 (Knauer, Berlin, Germany). Room-temperature magnetization curves for the NPs and suspensions were measured with a vibrating sample magnetometer (7307 VSM, Lake Shore Cryotronics, Westerville, OH, USA).
Artificial lipid membranes
Phase contrast microscopy and GUVs
GUVs were prepared using a modified electroformation method45 from stock solutions in CHCl3:MeOH of POPC (1 mg/mL) and cholesterol (1 mg/mL) in a ratio of 4:1 (v/v), as described previously.46 The lipid mixture solution (40 μL) was spread over two platinum electrodes and the solvent was allowed to evaporate in vacuo for 2 hours. The coated electrodes were then placed 4 mm apart in an electroformation chamber containing 2 mL of 0.3 M sucrose solution. An alternating electric field of magnitude 5 V/mm and a frequency of 10 Hz were applied to the electrodes for 2 hours. The magnitude and frequency of the alternating electric field was then gradually reduced at intervals of 15 minutes, first to 2.5 V/mm and 5 Hz, then to 2.5 V/mm and 2.5 Hz, and finally to 1 V/mm and 1 Hz. All the vesicles in the experiment were taken from the same electroformation chamber. GUVs, prepared in 0.3 M sucrose solution, were incubated in separate vials with a 0.3 M glucose solution containing bare CoFe2O4 NPs or CA-adsorbed CoFe2O4 NPs at a concentration of 0.1 mg/mL or in 0.3 M glucose solution for the control samples. The vials were inverted five times to ensure equal density of vesicles throughout the volume. Each sample (70 μL) was transferred into a separate observation chamber (CoverWell™ perfusion chambers PC4L-0.5, Grace Bio-Labs Sigma-Aldrich, Steinheim, Germany). Chambers with samples were mounted on an inverted phase contrast light microscope (Eclipse TE2000-S, Nikon Inc., Tokyo, Japan). After 3, 30, and 60 minutes of incubation, the populations of GUVs in each chamber were recorded at two predefined places; two video tracks in each chamber together were referred to as one sample. Using image processing algorithms, the video sequences were transformed into large images (mosaics), which each contained all the vesicles within the sample.46 The quantity of GUVs in each sample was compared among differently exposed populations of GUVs. The Wilcoxon rank-sum test was used to assess the statistical significance of the differences in vesicle quantities between the populations in the control and those exposed to NPs.
Small angle X-ray scattering and MLVs
MLVs of POPC were prepared by dispersing weighed amounts of lipid powder in either 0.3 M glucose solution or in 0.3 M glucose solution containing 0.1 mg/mL of bare CoFe2O4 NPs or CA-adsorbed CoFe2O4 NPs. The final concentration of MLVs was 10% by weight. The dispersions were kept at room temperature for 1 hour in a sealed vial after which each dispersion was vortexed for 10 minutes. Samples were subjected to ten freeze and thaw cycles. The lipid dispersion was shock-frozen in liquid nitrogen, and then thawed for 5 minutes, reaching a final temperature of 60°C. After each cycle, the dispersion was vigorously vortexed for 1–2 minutes.
Small angle X-ray scattering experiments were performed with a small and wide angle X-ray scattering camera and Kratky collimation (SWAXS, Hecus X-ray Systems GmbH, Graz, Austria)47 mounted on a sealed-tube generator (PW 1729, Philips, Eindhoven, the Netherlands) operating at 2 kW. Cu-Kα radiation (λ=0.154 nm) was used suppressing the Cu-Kβ radiation with a nickel filter. A linear one-dimensional position-sensitive detector (PSD 50-M, Hecus X-ray Systems GmbH, Graz, Austria) covered the q-range of interest (q=4π sinθ/λ, where λ is the wavelength and 2θ is the scattering angle) from 0.2 to 6 per nm. Silver behenate, CH3-(CH2)20-COOAg, with a d-spacing value of 5.84 nm, was used as a standard to calibrate the angular scale of the measured intensity.48 The MLV dispersions were transferred to a 1.5 mm capillary and measured at room temperature. The exposure time was set to 30 minutes. The backgrounds from water and the capillary were subtracted.
For analysis of the small angle diffraction pattern, the first order Bragg peaks were fitted with Lorentzian distributions using Origin 5.0 software (OriginLab, Northampton, MA, USA). The full width at half-maximum, Δqexp, was used to estimate the average number N of positionally correlated bilayers in the MLVs. The measured Δqexp was corrected for the instrumental beam width, Δq0, according to the relationship Δq ≈ Δqexp − Δq0 where Δq0 =0.086/nm. Finally, N was determined using Scherrer’s equation:

where λ is the X-ray wavelength and qc is the center of the first order diffraction peak.49
Biological membranes of RBCs
This study involved human subjects (as the source of RBCs) and was approved by the National Medical Ethics Committee of Slovenia (117/02/10). Human blood was collected by medial cubital vein puncture using a 21-gauge needle (length 70 mm, inner radius 0.4 mm, Microlance®, Becton Dickinson, Franklin Lakes, NJ, USA) and stored in four 2.7 mL vacutubes containing 270 μL trisodium citrate (0.109 mol/L) as an anticoagulant. Blood was centrifuged for 10 minutes in a Centric 400R centrifuge (Domel doo, Železniki, Slovenia) at 300 g and 37°C to separate RBCs from platelet-rich plasma. PBS-citrate buffer was used as the experimental medium in all experiments with RBCs in order to minimize possible coagulation and spontaneous deformation of RBCs during the experimental procedures. RBCs were repeatedly washed with PBS-citrate buffer then centrifuged at 1,550 g and 37°C for 10 minutes. After the final centrifugation, the excess supernatant was removed and the cells were kept at room temperature for a maximum of 60 minutes.
Morphological classification of RBCs and energy dispersive X-ray spectroscopy
A classification model consisting of the types of shape for two RBCs, ie, discocytes and nondiscoid-shaped erythrocytes, was selected for morphological evaluation.50 Washed RBCs were incubated for 60 minutes at 37°C in PBS-citrate buffer containing bare CoFe2O4 NPs or CA-adsorbed CoFe2O4 NPs both with a final concentration of 1 mg/mL, and control samples were incubated with the same volume of PBS-citrate buffer (50 μL of NP suspension or PBS-citrate buffer added to 150 μL of washed RBCs). The final concentration of NPs was selected on the basis of preliminary experiments when changes in morphology of human RBCs were evident in the exposed samples while controls were not affected. In this experiment, RBCs were isolated and their density proved to be higher than in the blood circulation. As a consequence, the concentration of particles needed to be higher (eg, 1 mg/mL) in order to create more relevant biological conditions. Five replicates of each group were exposed to the test media (control, bare CoFe2O4 NPs, or CA-adsorbed CoFe2O4 NPs). RBCs were fixed for 2 hours at room temperature using a modified Karnovsky fixative. Post-fixation of samples was undertaken with 1% OsO4. Samples were dehydrated and dried with hexamethyldisilazane. Syringes were used to apply samples onto membrane filters (Isopore Membrane Filters, polycarbonate, filter type 2.00 μm TSTP; Merck KGaA, Darmstadt, Germany). Filters with fixed, dried RBCs were attached to aluminum holders with silver paint, sputtered with 30 nm gold-palladium (Precision Etching Coating System Gatan 682), and examined with a field emission scanning electron microscope (SEM, JSM-6500F, JEOL Ltd). The experiments were carried out three times following the same protocol.
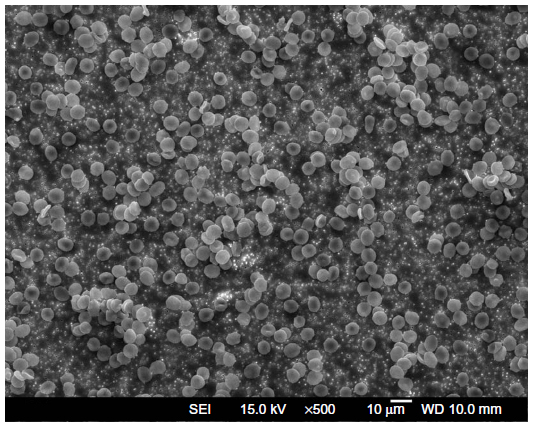
RBCs were classified as discoid-shaped (Figure 1, black arrow) or nondiscoid-shaped (Figure 1, white arrows). The latter includes uniconcave to globular-shaped stomatocytic RBCs and echinocytic RBCs with many (>10) spicules evenly distributed over the cell. Five samples of each test group were attached to the SEM holders. SEM images were recorded on randomly chosen regions of the samples. ImageJ with the Cell Counter plug-in and custom software written in Java (Sun Microsystems, Santa Clara, CA, USA) were used for manual classification of RBCs from SEM images taken at 500× magnification. Statistical analysis was performed using Origin 8.0 software (OriginLab) and the Wilcoxon rank-sum test was used to determine the P-values.
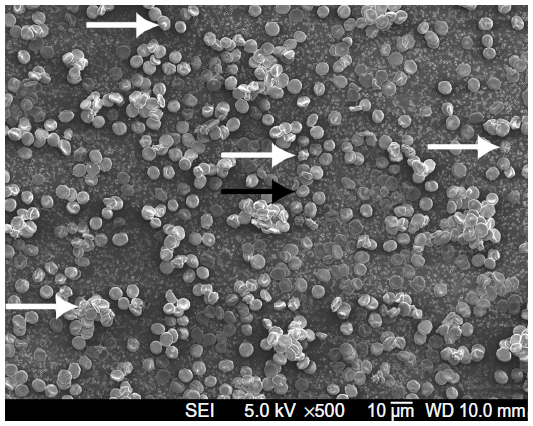 | Figure 1 Scanning electron microscopy image of a randomly chosen region on the scanning electron microscopy holder. Discoid-shaped red blood cells are classified as type 1 (black arrow) and nondiscoid-shaped erythrocytes as type 2 (white arrows). |
Energy dispersive X-ray spectroscopy (Inca x-Sight LN2 detector with Inca Energy 450 software, Oxford Instruments, Abingdon, UK) was used to analyze the chemical composition of possible clusters of NP agglomerates and other anomalies on the RBC surfaces.
Assessment of sedimentation and agglutination
To obtain a 5% hematocrit, 200 μL of washed RBC suspension was diluted with PBS-citrate buffer (pH 7.4) to a volume of 4 mL. This diluted suspension of RBCs was then transferred into separate vials (150 μL each). RBCs were incubated for 60 minutes at room temperature27,36 with suspensions of PBS-citrate buffer containing bare CoFe2O4 NPs or CA-adsorbed CoFe2O4 NPs, with final NP concentrations of 0.1 mg/mL and 0.2 mg/mL. Control samples were incubated in PBS-citrate buffer. After incubation, photographs of the vials were recorded using a D90 DSLR with a 35 mm Nikkor Lens (Nikon Inc.). To determine the erythrocyte sedimentation rate, the pixel distance between the menisci of the suspensions and the top edge of the sediments was measured using the extended measurement feature in Adobe Photoshop CS3. Agglutination was assessed by observing the suspension with light microscopy.
Hemolysis assay
Hemolysis assays were carried out using both bare CoFe2O4 NPs and CA-adsorbed CoFe2O4-CA NPs. Possible interference of NPs with standardized in vitro tests based on spectrophotometric detection of free plasma hemoglobin has been discussed in detail by Dobrovolskaia et al.51 The behavior of NPs in suspension differs from that of conventional pharmaceuticals, so interpretation of the results is complicated and outcomes have to be evaluated critically in order to avoid false-positive or false-negative results.51 Two separate assays were used. The first employs detection of free hemoglobin, released from hemolyzed RBCs, as described in the work of Zhao et al.27 The second is based on the decrease in breakage-based optical density of RBCs, where possible interference of NPs with optical density measurements is subtracted.51
The first method was performed as follows. Washed RBCs were diluted 1,000× (cell concentration was ~5 × 10⁶ cells/mL) and incubated with suspensions of bare CoFe2O4 NPs or CA-adsorbed CoFe2O4 NPs in the concentration range of 0.0375, 0.075, 0.15, 0.3, and 0.6 mg/mL for one hour at 4°C. Triton X-100 (final concentration 2%) was used as the positive control for a known hemolytic agent,51 and PBS-citrate buffer as a negative control. Following incubation, the mixture was centrifuged at 1,600 rpm for 15 minutes (Eppendorf centrifuge 5415 D, Eppendorf, Hamburg, Germany) and the absorbance of the supernatant was measured spectrophotometrically at 550 nm (Microplate Spectrophotometer, MRX, Dynex Technologies Inc., Chantilly, VA, USA). The absorbance value accounts for the amount of hemoglobin release from RBCs induced by bare CoFe2O4 NPs or CA-adsorbed CoFe2O4 NPs. The percent hemolysis of RBCs was calculated using the following equation:27

This method does not include the subtraction of signal from NPs, but NPs are removed by centrifugation. However, in our case (1,600 g, 15 minutes), particles were not entirely removed and a brownish color persisted. Consequently, the data were not interpreted further.
In the second approach, the absorbance values of 1,000× diluted washed RBCs (ARBCs) and NP suspensions (ANPs) at NP concentrations of 0.0094, 0.0187, 0.0375, 0.075, 0.15, 0.3, and 0.6 mg/mL (Microplate Spectrophotometer, MRX) were first measured separately at 550 nm prior to addition to the suspension of RBCs. Here we tested two additional suspensions with lower concentrations. Triton X-100 (2%) was used as a positive control and PBS-citrate buffer as a negative control. After one hour of incubation at 4°C, the absorbance values of RBCs with added NPs were measured. Optical density values for NPs alone were deducted directly from the optical density values of the mixture measured after incubation (AMIX) in order to determine the decrease in optical density of RBCs after incubation with the NP suspensions (ARBCs).51 The differences in optical density values were compared with the optical density changes caused by Triton X-100. The standard deviation for the positive controls was <2% after one hour of incubation (ATriton) using the following equation:51

Results
Characteristics of NP suspensions
X-ray diffractograms for the bare CoFe2O4 NPs and the CA-adsorbed CoFe2O4 NPs consisted only of broad reflections characteristic of cubic spinel structure. The average crystal size was determined from the diffraction peak broadening to be 14 nm and 15 nm for the bare CoFe2O4 NPs and CA-adsorbed CoFe2O4 NPs, respectively (Figure S1, Supplementary material).
TEM analysis showed the primary bare CoFe2O4 NPs to have a relatively broad size distribution, from 5 nm to >15 nm, and to form large agglomerates (Figure S2A). The particle size expressed as an equivalent diameter was estimated to be 12.1±3.3 nm from TEM images of the CoFe2O4 NPs. High-resolution imaging revealed that the NPs were crystalline, without any amorphous layer at their surfaces. The bare CoFe2O4 NPs were always present in the form of agglomerates. When the stable suspension of CA-adsorbed CoFe2O4 NPs was dried on the TEM specimen support, the NPs deposited in groups of individual NPs and the small agglomerates of the NPs were found to lie mainly in a single layer (Figure S2B). This suggests that the CA-adsorbed CoFe2O4 NPs were not strongly agglomerated in the original suspension, but agglomeration of NPs took place during drying.
The zeta potential of both types of CoFe2O4 NP (bare and CA-adsorbed) suspended in water was measured across the complete pH range and the zeta potentials of the tested NP suspensions were measured at the pH used in the experiment. Figure 2 shows the zeta potential of the bare CoFe2O4 NPs and the CA-adsorbed CoFe2O4-CA NPs dispersed in water as a function of the pH of the suspension. Suspension of the bare CoFe2O4 NPs in water showed an isoelectric point at pH ~6.5 and a negative zeta potential of approximately −10 mV at pH 7.0. The zeta potential of the bare CoFe2O4 NPs remained almost unchanged in 0.3 M glucose solution at pH 7.0. In contrast, bare CoFe2O4 NPs showed a much higher zeta potential (−30 mV) when dispersed in PBS-citrate buffer at pH 7.4. This high zeta potential measured in the PBS-citrate buffer was probably a consequence of citrate adsorption from the PBS-citrate buffer onto the bare NPs. The adsorption of citrate creates a highly negatively charged NP surface and a shift in the isoelectric point to lower pH values. The carboxylic groups of the tricarboxylic CA complex maintain cations at the NP surface.52 The CA-adsorbed CoFe2O4 NPs dispersed in water had an isoelectric point at pH ~3 and a strong negative zeta potential at neutral pH (−38 mV). The zeta potential of CA-adsorbed CoFe2O4 NPs in 0.3 M glucose solution was −18 mV at pH 7.0 and −15 mV in PBS-citrate buffer at pH 7.4. The bare CoFe2O4 NPs agglomerated strongly and sedimented quickly in both glucose solution and PBS-citrate buffer and consequently, dynamic light scattering measurement of the particle size in the suspensions that sedimented more slowly was unreliable. Such measurements showed the presence of large (>300 nm) agglomerates of bare CoFe2O4 NPs in both types of medium, ie, in 0.3 M glucose solution and in PBS-citrate buffer, but this value represents the smallest agglomerates present, since the larger agglomerates precipitated from the suspension prior to measurement. In contrast, the suspensions of CA-adsorbed CoFe2O4 NPs were fairly stable. Figure 3 shows a number-weighted distribution of hydrodynamic particle sizes in CA-adsorbed CoFe2O4 NPs suspended in PBS-citrate buffer or 0.3 M glucose solution. The hydrodynamic size of the CA-adsorbed CoFe2O4 NPs in the PBS-citrate buffer suspension was 15–25 nm and corresponded well to the size of the primary NPs measured from TEM images (Figure S2B) but some small agglomerates were also present in the glucose solution. The CA-adsorbed CoFe2O4 NPs also formed agglomerates, but were smaller than those formed by bare CoFe2O4 NPs, with a number-weighted size distribution starting above 170 nm and a maximum around 250 nm. A small number of agglomerates larger than 1 μm were also present (Figure 3).
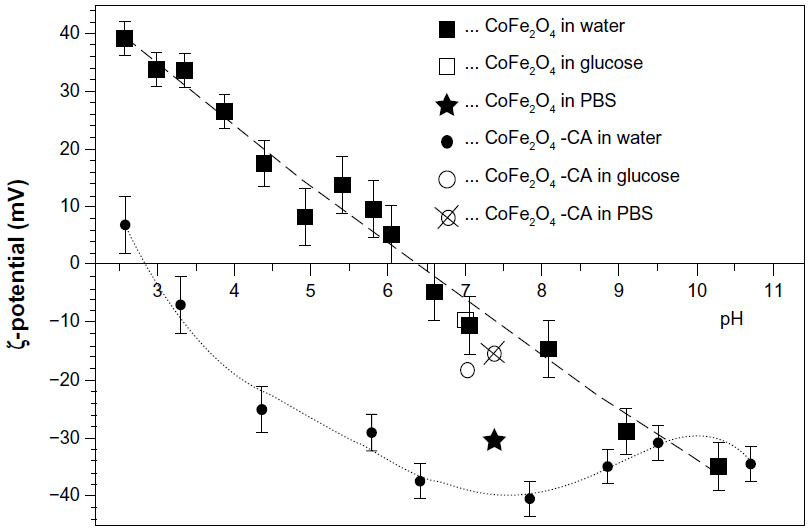 | Figure 2 Zeta potential of bare CoFe2O4 NPs and CA-adsorbed CoFe2O4 NPs (CoFe2O4-CA) dispersed in water as a function of the pH of the suspension. Values for the zeta potential of the NPs dispersed in water are shown across the complete pH range. The symbol ■ stands for bare CoFe2O4 and the symbol ● for CA-adsorbed CoFe2O4. The zeta potential values measured in 0.3 M glucose solution at pH 7.0 are shown with the symbol □ for bare CoFe2O4 and ○ for CA-adsorbed CoFe2O4 suspension. The zeta potential values for suspensions in PBS-citrate buffer are indicated by the symbol ⋆ (bare CoFe2O4) and the crossed circle stands for CA-adsorbed CoFe2O4 NPs. |
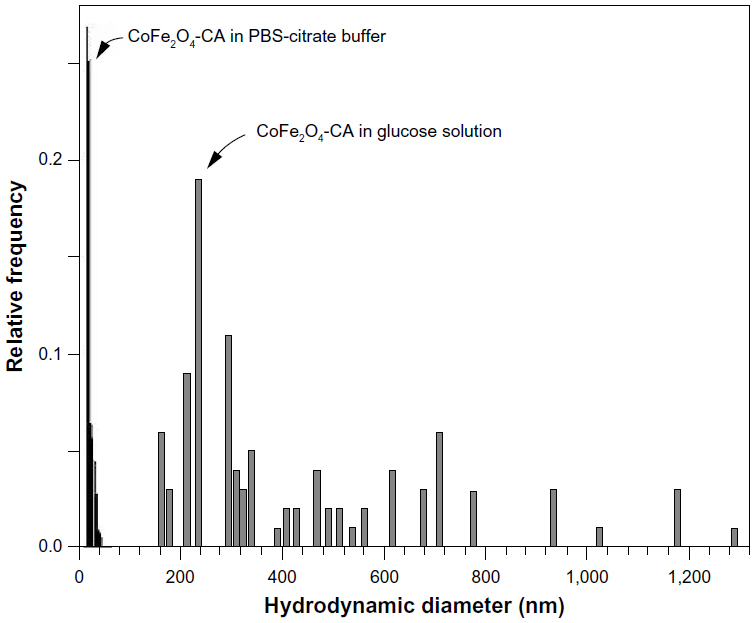 | Figure 3 Number-weighted distribution of hydrodynamic particle size in the suspension containing 5 mg/mL of the CA-adsorbed CoFe2O4 NPs suspended in PBS-citrate buffer (black pattern; left) and in 0.3 M glucose solution (gray pattern; right) measured using dynamic light scattering. |
Room temperature magnetization curves for bare dry CoFe2O4 NPs and CA-adsorbed CoFe2O4 NPs displayed typical ferromagnetic behavior (included in Figure S1 and Table S1).
Osmolarity of tested media
The osmolarity of the individual solutions and suspensions of NPs was measured with the aim of documenting alterations in osmolarity due to addition of NPs. The data show that osmolarity was slightly changed after addition of NPs, but this change was not consistent with the effects (Table S2). Therefore, we did not consider the effects of NPs to be a result of altered osmolarity.
Artificial lipid membranes
GUVs after incubation in NP suspensions
We exposed multiple samples of GUVs to bare CoFe2O4 and CA-adsorbed CoFe2O4 NP suspensions. In each exposed and control population, the vesicles were equally sampled after 3, 30, and 60 minutes, and the vesicles in the collected samples were counted. The vesicle quantities in samples incubated with the CA-adsorbed CoFe2O4 NP suspension were significantly (α=0.05 Wilcoxon rank-sum test) lower after 30 and 60 minutes of incubation than those in controls and bare CoFe2O4 NP suspensions, and the differences between the control and bare CoFe2O4 NP suspensions were not statistically significant (Table S3).
The generally increased vesicle quantity in the samples over time (Table S4), which was seen in all samples in this experiment (Figure 4), is due to the buoyancy in the suspension. The vesicles were heavier than their surrounding medium of iso-osmolar glucose solution, causing the vesicles to collect at the bottom of the chamber, where they were recorded in the focal plane.
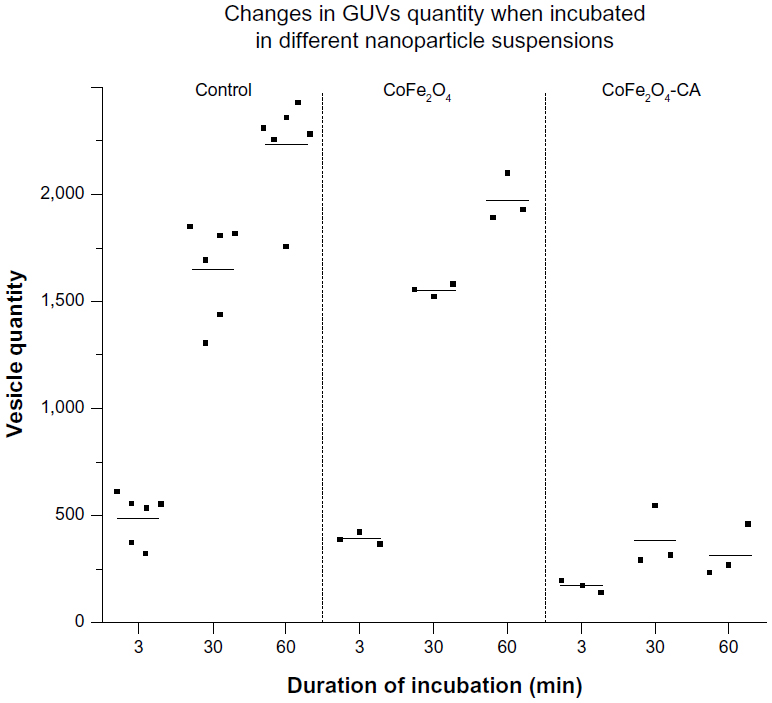 | Figure 4 Quantity of GUVs incubated in chambers with suspensions of bare CoFe2O4 NPs (0.1 mg/mL), CA-adsorbed CoFe2O4 NPs (0.1 mg/mL), and in 0.3 M glucose solution (control). Each dot corresponds to a number of vesicles obtained in one sample of vesicles, ie, one replicate of each tested group. One sample of a population consists of all vesicles captured in two individual video tracks at different places in a chamber. On the basis of preliminary calculations, two such video tracks capture approximately 3% of the whole population of vesicles in the chamber. The mean values of vesicle levels in each tested group are marked with bars. It is estimated that, in total, 40,000 vesicles were counted in the experiment. |
Incubation of GUVs in the supernatant of CA-adsorbed CoFe2O4 NPs, obtained after a combination of ultracentrifugation and exposure to an external magnetic field, had a negligible effect on the bursting of GUVs (Figure S4, Table S5). Consequently, the influence of CA or dissolved Co or Fe ions derived from CA-adsorbed CoFe2O4 NPs and possibly present in the supernatant, may be negligible and it does not contribute to the bursting of GUVs.
MLVs after incubation in NP suspensions
The small angle X-ray scattering pattern of POPC MLVs, with background subtracted in 0.3 M glucose solution or the presence of bare CoFe2O4 NPs, or CA-adsorbed CoFe2O4 NPs in 0.3 M glucose (both with a concentration of 0.1 mg/mL) are presented in Figure 5. MLVs were observed in the control group and in the MLVs treated with bare CoFe2O4 NPs (Figure 5A), whereas the small angle X-ray scattering pattern (Figure 5C) showed unilamellar vesicles appearing after incubation in CA-adsorbed CoFe2O4 NPs. When bare CoFe2O4 NPs were added to the MLVs, the vesicles were only slightly destabilized displaying a lower long range order (Figure 5B). The average number N of positionally correlated bilayers decreased from ~6 to 5, and at the same time the lattice repeat distance increased slightly to 0.17 nm (Table 1). When MLVs were treated with CA-adsorbed CoFe2O4 NPs, a different picture emerged. Only a very weak first order diffraction peak, corresponding to a d-spacing of 7.91 nm, was positioned at wave vector value qc=0.794/nm and the central peak width analysis demonstrated that few (N< 2), if any, bilayers were spatially correlated.
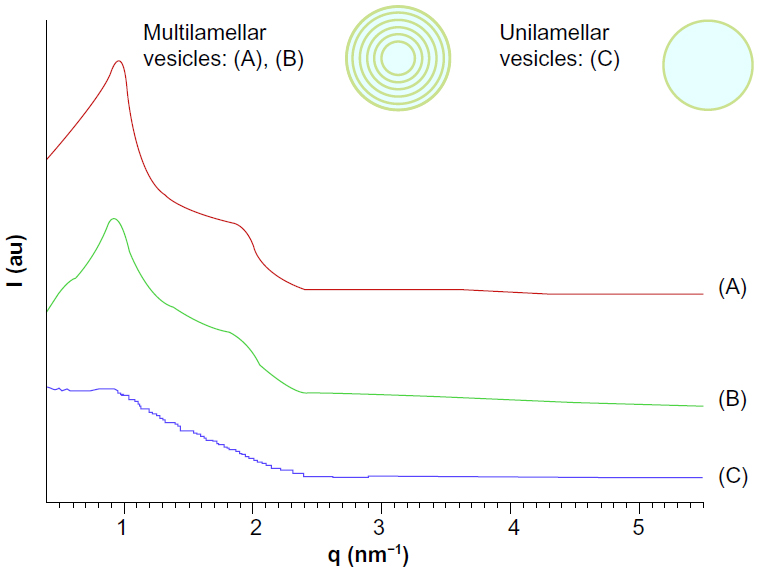 | Figure 5 Background-subtracted small angle X-ray scattering pattern of POPC multilamellar vesicles in 0.3 M glucose as the control (A), exposed to 0.1 mg/mL bare CoFe2O4 NPs (B), and to 0.1 mg/mL CA-adsorbed CoFe2O4 NPs (C). |
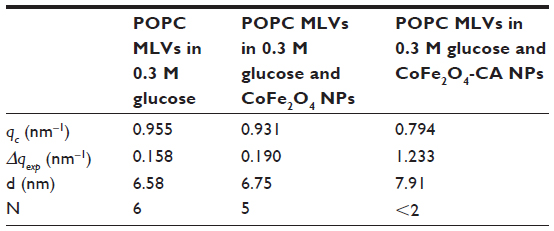 | Table 1 Structural parameters of POPC MLVs with and without bare CoFe2O4 NPs or CA-adsorbed CoFe2O4 NPs |
Biological RBC membranes
Morphological alterations of RBCs after incubation in NP suspension: adsorption of particles onto surface of RBCs
Shape transformation of RBCs compared with a control group was observed with SEM after their incubation in bare CoFe2O4 NPs and CA-adsorbed CoFe2O4 NPs, as shown in Figure 6 (and Figures S5–S7). A Wilcoxon rank-sum test (α=0.05) of the portion of nondiscocytes showed significant (P=0.04) differences between the control and samples treated with CA-adsorbed CoFe2O4 NPs, but no significant (P=0.13) differences between the control and RBCs treated with bare CoFe2O4 NPs.
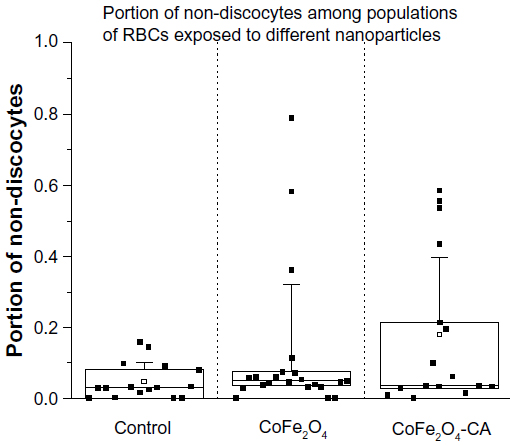 | Figure 6 Percentage of nondiscocyte RBCs after incubation in PBS-citrate buffer (control), bare CoFe2O4 NPs (1 mg/mL), and CA-adsorbed CoFe2O4 NPs (1 mg/mL). Five holders per treatment were inspected. Each dot presents an analyzed location on the scanning electron microscopy holder. On each holder, three locations were analyzed at magnification 500×. In the control group, a total of 3,390 RBCs were compared, 2,737 in the bare CoFe2O4 NP group, and 5,520 in the CA-adsorbed CoFe2O4 NP group. In this plot, the proportion of nondiscocytes at every location is shown. The small square in the center of the box plot represents the mean value, the central line is the median value, and the lower and upper lines of the box represent the 25th and 75th percentiles. The whiskers are set at two standard deviations from the mean value. |
Energy dispersive X-ray spectroscopy analysis, performed in regions where deposits of material were observed on the surface of the RBCs, confirmed the presence of both Co and Fe, indicating the presence of CoFe2O4 adsorbed on the surface of the RBCs after incubation in bare CoFe2O4 and CA-adsorbed CoFe2O4 NPs (Tables S6 and S8, Figures S8 and S9). RBCs incubated with both bare and CA-adsorbed CoFe2O4 NPs were not densely covered by adsorbed material (Figures S8 and S9).
Sedimentation and agglutination of RBCs
Compared with controls, the erythrocyte sedimentation rate was lower in the suspensions with bare CoFe2O4 NPs or CA-adsorbed CoFe2O4 NPs added (Figure S10) in comparison with controls (RBCs with PBS-citrate buffer added), but the differences in erythrocyte sedimentation rate between the incubated samples of bare CoFe2O4 NPs and CA-adsorbed CoFe2O4 NPs were not significant. The measured distance corresponded to a fixed time of 60 minutes and the results are given as distance (mm) per hour. Agglutination of RBCs was not detected in either of the suspensions (Figure S10).
Hemolysis of RBC
Analysis of free hemoglobin released from RBCs after incubation in a suspension of bare CoFe2O4 NPs in the PBS-citrate buffer showed that the bare NPs had a surprisingly high hemolytic potential; all values exceeded those of the positive control (2% Triton X-100). Calculations of hemolytic activity indicate hemolysis of over 200% (Figure S11). We explain this as a false-positive result resulting from strong agglomeration of bare NPs that collect at the bottom of the wells and disturbance of the incoming optical path in the spectrophotometric analysis.
Results for incubation of RBCs in CA-adsorbed CoFe2O4 NPs with a lower degree of agglomeration show that CA-adsorbed CoFe2O4 NPs did not appear to collect on the bottom of the wells. The absorbance values for NPs alone (ie, with no blood control) were subtracted according to Dobrovolskaia et al.51 The results indicate that hemolysis increased with increasing concentrations of CA-adsorbed CoFe2O4 NPs (Figure S12). According to the criterion in the ASTM E2524-08 standard, >5% hemolysis indicates that the test material causes damage to RBCs;53 this criterion was significantly exceeded only at the highest concentration of CA-adsorbed CoFe2O4 NPs (0.6 mg/mL, Figure S12).
The hemolytic effect of CA-adsorbed CoFe2O4 NPs was observed indirectly in the sedimentation and agglutination assays as a red-colored supernatant after incubation in suspensions of both bare CoFe2O4 and CA-adsorbed CoFe2O4 NPs (Figure S10) as well as on SEM imaging, which showed ghost cells resulting from breakage of RBCs.
Discussion
We have produced experimental evidence showing that smaller agglomerates of CA-adsorbed CoFe2O4 NPs in a suspension interact more extensively with artificial protein-free lipid membranes than do larger agglomerates of bare CoFe2O4 NPs. Incubation of GUVs in a suspension of CA-adsorbed CoFe2O4 NPs led to a significant degree of vesicle bursting, while incubation of MLVs in the same suspension caused unbinding of the lipid bilayers. Incubation of GUVs in a suspension of bare CoFe2O4 NPs does not cause bursting of GUVs and produces only a slight enhancement of stacking disorder in the MLVs. This distinguishes their behavior from that of CA-adsorbed CoFe2O4 NPs. Incubation of RBCs in suspensions of bare CoFe2O4 NPs and CA-adsorbed CoFe2O4 NPs resulted in shape transformation of RBCs and altered membrane integrity. CA-adsorbed CoFe2O4 NPs were more effective than bare CoFe2O4 NPs in altering the morphology of RBCs, and the slight hemolysis observed after incubation of RBCs in a suspension of CA-adsorbed CoFe2O4 NPs indicates the potential of NPs to affect the integrity of biological membranes.
The suspensions of bare CoFe2O4 and CA-adsorbed CoFe2O4 NPs in 0.3 M glucose solution and in PBS-citrate buffer differ significantly in NP size and in the size distribution of the agglomerates, with larger agglomerates in both types of tested medium formed in the suspensions of bare CoFe2O4 NPs. The different effects of bare CoFe2O4 NPs and CA-adsorbed CoFe2O4 NPs could be traced to the different surface charge on the NPs, to the resulting different size of agglomerates formed in the suspensions (Figure 3), and to the different magnetic behavior of suspensions of bare CoFe2O4 NPs and CA-adsorbed CoFe2O4 NPs (Table S1, Figure S3).
Consistent with the published data, we note that attachment of NPs from the suspension to the membranes may be followed by any of three possible events. First, alteration of global membrane curvature may result in bursting of lipid vesicles.24,46 This can be caused by changed chemical or physical conditions in the medium,54 attachment or intercalation of different molecules from medium, ie, proteins, with membranes,15,55,56 intercalation of colloid particles and NPs,14,15,57 or engulfment of wrapped particles.20,24,58,59 Second, a local change in membrane curvature followed by indentation of NPs and their agglomerates into the membrane could result in NP-membrane encapsulation, or internalization.13,20,24,60 Published reports20,24,58 indicate that membrane wrapping and encapsulation are consequences of interplay between the mean bending modulus of the bilayer and the adhesion energy per unit area. The large aggregates could not be encapsulated due to geometric restriction dictated by the large relative volume and spherical shape of GUVs.20 Third, changes in local membrane curvature followed by wrapping of NPs and their agglomerates may lead to lipid depletion from the bilayer, and thus altered membrane integrity and/or formation of pores or holes.16,22,53–56,61–64
In the case of GUVs, we propose that the most likely mechanism causing GUVs to burst is adhesion of CA-adsorbed CoFe2O4 NPs and smaller NP agglomerates onto membranes, resulting in alteration of the global membrane curvature and, finally, bursting. The POPC lipids used in our study have an externally situated lipid polar head (the trimethylammonium group) that is positively charged and faces the aqueous glucose solution.31,61 It was expected that negatively charged bare CoFe2O4 NPs or CA-adsorbed CoFe2O4 NPs and their agglomerates suspended in glucose solution may interact with the positively charged head group of POPC.24 Also, in our previous study46 using C60 NPs, altered global membrane curvature was observed to be the cause of vesicle bursting after incubation in NP suspensions. Laurencin et al25 demonstrated that the surface properties of NPs control the interaction between two oppositely charged species (GUVs and functionalized maghemite NPs), which is not ruled by global attraction of opposite charges as expected. Contrary to our observations, they reported an absence of interactions between anionic NPs and GUVs with neutral, negative, or positive charges.25 These differences could be attributed to, first of all, the different surface coatings. Laurencin et al used maghemite NPs functionalized with carboxylic acids, whereas in our study CA was not covalently bond but adsorbed to the particle surface, and, second, to the different core of magnetic NPs (ie, maghemite being used by Laurencin et al and CoFe2O4 being used in our study). Third, the difference in effect could also be explained by the use of different types of dispersion medium with particles (MOPS/NaOH buffer versus 0.3 M glucose solution) that contribute significantly to the secondary characteristics of NP suspensions, eg, formation of agglomerates in the suspension. Finally, the size and size distribution of the particles differed significantly between the two studies.
In the case of MLVs, during the process of subsequent freezing and thawing cycles to which MLVs were subjected during the experimental procedure, the presence of CA-adsorbed CoFe2O4 NPs prevented reorganization of bilayers back into MLVs. Similar membrane-unbinding effects have been observed for POPC MLVs exposed to negatively charged molecules such as losartan, an angiotensin II receptor antagonist used for regulation of high blood pressure.65 Just as in the case of the CA-adsorbed CoFe2O4 NPs used in our study, partitioning of losartan into the membranes, as reported by Hodzic et al,65 confers a negative charge to the lipid bilayers, leading to formation of unilamellar vesicles. In the case of bare CoFe2O4 NPs, repulsive forces between the lipid bilayers were smaller due to the smaller surface charge on the bare CoFe2O4 NPs when compared with the CA-adsorbed CoFe2O4-CA NPs, and resulted only in a decreased number of lamellae MLVs, not in the unbinding effect causing unilamellar vesicles. The bare CoFe2O4 NPs and their agglomerates only sterically disturbed the binding of the POPC bilayers forming MLVs after the freezing and thawing cycles, but did not lead to a build-up of electrostatic repulsive forces. This was confirmed by the slight increases in d-spacing and the Bragg-peak width (Table 1). This phenomenon of disturbance of the POPC MLV membrane has also been observed after incubation of the membrane in a suspension of uncharged, hydrophobic C60 NPs, following the same experimental procedure.46
Work with RBCs as a model of biological membranes confirmed the results obtained with artificial vesicles. Incubation of RBCs with CA-adsorbed CoFe2O4 NPs resulted in shape transformation of RBCs and altered membrane integrity. There could be a number of explanations for the change in shape of the RBCs on exposure to these NPs, outlined as follows.
First, according to the bilayer couple concept proposed by Sheetz and Singer,66 any factor that leads to expansion of the outer or inner leaflet of the membrane relative to its counterpart, leads to a tendency to form either convex structures or cavities. This in turn leads to echinocytic spicules or stomatocytosis, respectively.32 The alterations in the shape of RBCs could thus be related to a changed average membrane curvature resulting from adsorption of NPs to the lipid component of the membrane or to membrane-bound proteins. In RBCs, membrane-bound band 3 proteins are known to be directly responsible for the shape of cells.67 The explanation for morphological alteration of RBCs following NP exposure includes distraction of lipids away from the RBC membrane. Phospholipids missing from the outer membrane bilayer of RBCs can cause expansion of the inner leaflet relative to the outer leaflet, resulting in membrane shape transformations.50,67 Our observation of changed erythrocyte shape is partly consistent with the findings of Han et al,35 ie, that the surface charge on NPs is the dominant factor influencing their hemocompatibility, but the findings of our study suggest that the sizes of NPs and their agglomerates also play an important role. In addition, Asharani et al34 reported that the low degree of surface deposition of NPs on the membrane of RBCs can be accompanied by significant alterations in membrane topography. In this connection, we observed NP agglomerates on the surface of RBCs (Figures S8 and S9, Tables S7 and Tables S8).
Second, the alterations in RBC morphology could also be explained by encapsulation of particles and subsequent membrane permeabilization. Proximity of smaller agglomerates of CA-adsorbed CoFe2O4 NPs may induce alteration in the angle of the head groups with respect to the hydrophobic lipid tails in the RBC membranes, and this could lead to encapsulation of the particle.20 Soler et al68 reported that a citrate coating on maghemite NPs induced higher NP internalization and this was related to the ability of the NP surface coating to bind efficiently onto the cell membrane. We did not observe particle internalization, but did find particle attachment on the membrane surface (possibly later internalized). Soler et al68 also observed a larger hydrodynamic diameter and the lowest cell internalization coefficient. Membrane-particle encapsulation with CoFe2O4 NPs has also been observed in in vitro cell culture studies.69 Further, Marmorato et al7 reported no significant influence of CoFe2O4 nanomaterials at low concentrations on cell shape and morphology, but with increasing NP concentration their data suggested possible interference of CoFe2O4 nanomaterial with lipid metabolism.
Furthermore, encapsulation of particles may also cause formation of holes or pores in RBCs, leading to hemolysis. The fact that CA-adsorbed CoFe2O4 NPs caused slight hemolysis at the highest concentration (0.6 mg/mL, Figure S12) indicates that the membrane failed to remain intact upon exposure to the suspension. Different investigators have reported on the hemolytic activity of surface-coated magnetic NPs39 or NPs with other core compositions.29,53 Our observations are in line with the model system proposed by Thomassen et al18 which implies that adhesion of NP aggregates to the RBC membrane locally induces enhanced curvature and overall smaller adhesion energy, resulting in lower hemolytic activity of larger agglomerates in comparison with monodispersed particles having a similar hydrodynamic radius.18 As in our study, Zook et al29 also reported higher hemolytic cytotoxic potential of smaller agglomerates of citrate-coated silver NPs when compared with larger agglomerates. Zhao et al27 reported hemolytic activity of mesoporous silica NPs. Larger NPs had more hemolytic activity than smaller NPs, but they explained that in addition to particle size, surface area also influences the hemolytic potential of NPs.27 Mai et al39 reported that magnetic NPs with anionic core-shells show an absence of interactions with RBCs. The discrepancy in these results can be a consequence of many factors, such as particle core composition, the size of the primary particles, the size distribution of agglomerates, and the difference in dispersion medium affecting the size of agglomerates.53 Mai et al39 used MOPS and sucrose, while we used PBS-citrate buffer. Further, the surface coating of the anionic particles used in their study was rich in COOH groups, while we used adsorbed, not covalently bound, CA. However, like Choi et al,53 we cannot conclude that CA adsorbed on the NPs is the only factor responsible for the possible differences in hemolysis due to significant differences in particle sizes, indicating that the smaller size of agglomerates of CoFe2O4 NPs is probably the main factor causing the hemolytic potential of CA-adsorbed CoFe2O4 NPs observed in our study. To determine the hemolytic properties of NPs, hemolysis hemolysis potential of particles must be carefully related to physicochemical characteristics of particles and potential particle dissolution.53
According to Dobrovolskaia et al,51 interpretation of the results of hemolytic activity of NPs is difficult because of possible false-positive or false-negative results. One reason for that is a problem with removal of NPs by centrifugation and subsequent interference of the remaining NPs with spectrophotometric measurement in assays of NPs. This has been pointed out already by Dobrovolskaia et al51 as a problem for citrated gold NPs, nanoemulsions, fullerene derivatives, and doxorubicin-loaded NPs. The limitations of hemolysis assays are also mentioned by Choi et al,53 who emphasized the understanding of physicochemical characteristics of particles when interpreting the results. On the basis of our observations and reports in the literature,51,53 we suggest careful interpretation of results obtained by in vitro spectroscopic hemolysis assays, eg, visual detection of hemolysis by light or electron microscopy or simultaneous use of other techniques, also enabling observation of hemolysis, especially if larger agglomerates of NPs are present in the suspensions.
In the current study, the agglomerates of bare CoFe2O4 NPs in PBS-citrate buffer are much larger and their concentration and surface area are therefore lower, as in the case of CA-adsorbed CoFe2O4 NPs, where the agglomerates are smaller and their active surface area and concentrations are higher. Consequently, higher biological reactivity of CA-adsorbed CoFe2O4 NPs was expected, and this was confirmed experimentally. On the basis of zeta potential measurements, it was expected that biological reactivity would be correlated with higher zeta potential values, but higher (more negative) zeta potential values were obtained for bare NPs, and this is presumably a consequence of citrate adsorption from the PBS-citrate buffer onto the bare NPs. Thus, the zeta potential values, viewed in isolation, could not be an indicator of higher biological potency of a suspension of NPs.
Our experimental data on artificial membranes were confirmed by work with RBCs as model biological membranes and suggest that NPs could also interact with lipids in biological membranes. Consequently, biologically inert and therefore safe NPs should be invisible to not only proteins, but also to the lipids in membranes.
Conclusion
Suspended CA-adsorbed CoFe2O4 NPs are more likely to disturb artificial lipid membranes and biological membranes when compared with a suspension of bare CoFe2O4 NPs. We observed, in accordance with data reported in the literature, that NPs or their agglomerates suspended in PBS-citrate buffer induce echinocyte shape transformation of RBCs and this is followed at higher exposure concentrations by hemolysis, suggesting membrane pore formation. Careful interpretation of the hemolytic potential of NPs is required (at least when spectrophotometric methods are employed) due to possible interference of NPs and their agglomerates. The interaction between NPs in the suspension and in lipid membranes is a result of the interplay between membrane curvature, size, active surface area, concentration of NPs, and the suspension medium, all of which contribute to formation of NP agglomerates. We have confirmed experimentally that larger aggregates of NPs are also biologically potent, and that suspended NPs have a potential to interact directly with the lipid components of biological membranes. This has to be considered as a prerequisite for successful application and safety of NPs as potential medical agents.
Acknowledgments
The paper is part of the PhD work of Barbara Drašler, working under the supervision of Professor Damjana Drobne. This investigation was supported by the Ministry of Education, Science, Culture and Sport of Republic of Slovenia under an “Innovative scheme of co-funding doctoral studies promoting co-operation with the economy and solving of contemporary social challenges” grant (No 160-21). This research has also received funding from the European Community’s Seventh Framework Programme (FP7/2007–2013) under Grant Agreement Number 263147-NanoValid, from the Slovenian Research Agency under Grant Agreement J1-4109. The authors acknowledge the use of equipment in the Center of Excellence on Nanoscience and Nanotechnology – Nanocenter (CENN Nanocenter). The authors gratefully acknowledge Professor Bill Milne for revision of the paper for English language. We would like to thank Roman Štukelj for assistance with experiments on red blood cells and we are grateful to Tea Romih for her assistance with preparation of the manuscript.
Disclosure
The authors report no conflicts of interest in this work.
References
de Planque MRR, Aghdaei S, Roose T, Morgan H. Electrophysiological characterization of membrane disruption by nanoparticles. ACS Nano. 2011;5(5):3599–3606. | |
Thanh NTK, Green LAW. Functionalisation of nanoparticles for biomedical applications. Nano Today. 2010;5(3):213–230. | |
Grigorova M, Blythe HJ, Blaskov V, et al. Magnetic properties and Mossbauer spectra of nanosized CoFe(2)O(4) powders. J Magn Magn Mater. 1998;183(1–2):163–172. | |
Kita E, Oda T, Kayano T, et al. Ferromagnetic nanoparticles for magnetic hyperthermia and thermoablation therapy. J Phys D Appl Phys. 2010;43(47):474011. | |
Baldi G, Bonacchi D, Innocenti C, Lorenzi G, Sangregorio C. Cobalt ferrite nanoparticles: the control of the particle size and surface state and their effects on magnetic properties. J Magn Magn Mater. 2007;311(1):10–16. | |
Verde EL, Landi GT, Gomes JA, Sousa MH, Bakuzis AF. Magnetic hyperthermia investigation of cobalt ferrite nanoparticles: comparison between experiment, linear response theory, and dynamic hysteresis simulations. J Appl Phys. 2012;111(12). | |
Marmorato P, Ceccone G, Gianoncelli A, et al. Cellular distribution and degradation of cobalt ferrite nanoparticles in Balb/3T3 mouse fibroblasts. Toxicol Lett. 2011;207(2):128–136. | |
Wang EC, Wang AZ. Nanoparticles and their applications in cell and molecular biology. Integr Biol (Camb). 2013;6(1):9–26. | |
De Jong WH, Borm PJ. Drug delivery and nanoparticles: applications and hazards. Int J Nanomedicine. 2008;3(2):133–149. | |
Verma A, Stellacci F. Effect of surface properties on nanoparticle-cell interactions. Small. 2010;6(1):12–21. | |
Leroueil PR, Hong S, Mecke A, Baker JR Jr, Orr BG, Banaszak Holl MM. Nanoparticle interaction with biological membranes: does nanotechnology present a janus face? Acc Chem Res. 2007;40(5):335–342. | |
Dawson KA, Salvati A, Lynch I. Nanoparticles reconstruct lipids. Nat Nanotechnol. 2009;4(2):84–85. | |
da Rocha EL, Caramori GF, Rambo CR. Nanoparticle translocation through a lipid bilayer tuned by surface chemistry. Phys Chem Chem Phys. 2013;15(7):2282–2290. | |
Wang B, Zhang LF, Bae SC, Granick S. Nanoparticle-induced surface reconstruction of phospholipid membranes. Proc Natl Acad Sci U S A. 2008;105(47):18171–18175. | |
Yu Y, Granick S. Pearling of lipid vesicles induced by nanoparticles. J Am Chem Soc. 2009;131(40):14158–14159. | |
Chen R, Choudhary P, Schurr RN, Bhattacharya P, Brown JM, Ke PC. Interaction of lipid vesicle with silver nanoparticle-serum albumin protein corona. Appl Phys Lett. 2012;100(1):13703–137034. | |
Roiter Y, Ornatska M, Rammohan AR, Balakrishnan J, Heine DR, Minko S. Interaction of nanoparticles with lipid membrane. Nano Lett. 2008;8(3):941–944. | |
Thomassen LC, Rabolli V, Masschaele K, et al. Model system to study the influence of aggregation on the hemolytic potential of silica nanoparticles. Chem Res Toxicol. 2011;24(11):1869–1875. | |
Westerhausen C, Strobl FG, Herrmann R, et al. Chemical and mechanical impact of silica nanoparticles on the phase transition behavior of phospholipid membranes in theory and experiment. Biophys J. 2012;102(5):1032–1038. | |
Fosnaric M, Iglic A, Kroll DM, May S. Monte Carlo simulations of complex formation between a mixed fluid vesicle and a charged colloid. J Chem Phys. 2009;131(10):105103. | |
Hong SP, Leroueil PR, Janus EK, et al. Interaction of polycationic polymers with supported lipid bilayers and cells: nanoscale hole formation and enhanced membrane permeability. Bioconjug Chem. 2006;17(3):728–734. | |
Leroueil PR, Berry SA, Duthie K, et al. Wide varieties of cationic nanoparticles induce defects in supported lipid bilayers. Nano Lett. 2008;8(2):420–424. | |
Anderson TH, Min YJ, Weirich KL, Zeng HB, Fygenson D, Israelachvili JN. Formation of supported bilayers on silica substrates. Langmuir. 2009;25(12):6997–7005. | |
Michel R, Gradzielski M. Experimental aspects of colloidal interactions in mixed systems of liposome and inorganic nanoparticle and their applications. Int J Mol Sci. 2012;13(9):11610–11642. | |
Laurencin M, Georgelin T, Malezieux B, Siaugue JM, Menager C. Interactions between giant unilamellar vesicles and charged core-shell magnetic nanoparticles. Langmuir. 2010;26(20):16025–16030. | |
Schulz M, Olubummo A, Binder WH. Beyond the lipid-bilayer: interaction of polymers and nanoparticles with membranes. Soft Matter. 2012;8(18):4849–4864. | |
Zhao Y, Sun X, Zhang G, Trewyn BG, Slowing II, Lin VS. Interaction of mesoporous silica nanoparticles with human red blood cell membranes: size and surface effects. ACS Nano. 2011;5(2):1366–1375. | |
Albanese A, Chan WC. Effect of gold nanoparticle aggregation on cell uptake and toxicity. ACS Nano. 2011;5(7):5478–5489. | |
Zook JM, MacCuspie RI, Locascio LE, Halter MD, Elliott JT. Stable nanoparticle aggregates/agglomerates of different sizes and the effect of their size on hemolytic cytotoxicity. Nanotoxicology. 2011;5(4):517–530. | |
Mahon E, Salvati A, Bombelli FB, Lynch I, Dawson KA. Designing the nanoparticle-biomolecule interface for “targeting and therapeutic delivery”. J Control Release. 2012;161(2):164–174. | |
Velikonja A, Perutkova S, Gongadze E, et al. Monovalent ions and water dipoles in contact with dipolar zwitterionic lipid headgroups – theory and MD simulations. Int J Mol Sci. 2013;14(2):2846–2861. | |
Iglic A. A possible mechanism determining the stability of spiculated red blood cells. J Biomech. 1997;30(1):35–40. | |
Hagerstrand H, Danieluk M, Bobrowska-Hagerstrand M, et al. Influence of band 3 protein absence and skeletal structures on amphiphile- and Ca2+-induced shape alterations in erythrocytes: a study with lamprey (Lampetra fluviatilis), trout (Onchorhynchus mykiss) and human erythrocytes. Biochim Biophys Acta. 2000;1466(1–2):125–138. | |
Asharani PV, Sethu S, Vadukumpully S, et al. Investigations on the structural damage in human erythrocytes exposed to silver, gold, and platinum nanoparticles. Adv Funct Mater. 2010;20(8):1233–1242. | |
Han Y, Wang X, Dai H, Li S. Nanosize and surface charge effects of hydroxyapatite nanoparticles on red blood cell suspensions. ACS Appl Mater Interfaces. 2012;4(9):4616–4622. | |
Li SQ, Zhu RR, Zhu H, et al. Nanotoxicity of TiO(2) nanoparticles to erythrocyte in vitro. Food Chem Toxicol. 2008;46(12):3626–3631. | |
Šimundić M, Drašler B, Šuštar V, et al. Effect of engineered TiO2 and ZnO nanoparticles on erythrocytes, platelet-rich plasma and giant unilamelar phospholipid vesicles. BMC Vet Res. 2013;9:7. | |
Pavan C, Tomatis M, Ghiazza M, et al. In search of the chemical basis of the hemolytic potential of silicas. Chem Res Toxicol. 2013;26(8):1188–1198. | |
Mai TD, d’Orlyé F, Ménager C, Varenne A, Siaugue JM. Red blood cells decorated with functionalized core-shell magnetic nanoparticles: elucidation of the adsorption mechanism. Chem Commun (Camb). 2013;49(47):5393–5395. | |
Campelj S, Makovec D, Drofenik M. Preparation and properties of water-based magnetic fluids. J Phys Condens Matter. 2008;20(20):204101. | |
Gyergyek S, Drofenik M, Makovec D. Oleic-acid-coated CoFe2O4 nanoparticles synthesized by co-precipitation and hydrothermal synthesis. Mater Chem Phys. 2012;133(1):515–522. | |
Campelj S, Makovec D, Bele M, Drofenik M, Jamnik J. Synthesis of magnetic nanoparticles functionalized with thin layer of silica. Mater Technol. 2007;41(2):103–107. | |
Cullity BD, Stock SR. Elements of X-ray Diffraction. 3rd ed. Reading MA, USA: Addison-Wesley Publishing Company, Inc; 1987. | |
Cheary RW, Coelho A. A fundamental parameters approach to x-ray line-profile fitting. J Appl Crystallogr. 1992;25:109–121. | |
Angelova MI, Dimitrov DS. Liposome electroformation. Faraday Discuss. 1986;81:303–311. | |
Zupanc J, Drobne D, Drasler B, et al. Experimental evidence for the interaction of C-60 fullerene with lipid vesicle membranes. Carbon. 2012;50(3):1170–1178. | |
Laggner P, Mio H. SWAX – a dual-detector camera for simultaneous small-angle and wide-angle x-ray-diffraction in polymer and liquid-crystal research. Nucl Instrum Methods Phys Res A. 1992;323(1–2):86–90. | |
Huang TC, Toraya H, Blanton TN, Wu Y. X-ray-powder diffraction analysis of silver behenate, a possible low-angle diffraction standard. J Appl Crystallogr. 1993;26:180–184. | |
Klug HP, Alexander LE. X-ray Diffraction Procedures: For Polycrystalline and Amorphous Materials. 2nd ed. New York, NY, USA: John Wiley and Sons, Inc.; 1974. | |
Rudenko SV. Erythrocyte morphological states, phases, transitions and trajectories. Biochim Biophys Acta. 2010;1798(9):1767–1778. | |
Dobrovoiskaia MA, Clogston JD, Neun BW, Hall JB, Patri AK, McNeil SE. Method for analysis of nanoparticle hemolytic properties in vitro. Nano Lett. 2008;8(8):2180–2187. | |
Hidber PC, Graule TJ, Gauckler LJ. Citric acid – a dispersant for aqueous alumina suspensions. J Am Ceram Soc. 1996;79(7):1857–1867. | |
Choi J, Reipa V, Hitchins VM, Goering PL, Malinauskas RA. Physicochemical characterization and in vitro hemolysis evaluation of silver nanoparticles. Toxicol Sci. 2011;123(1):133–143. | |
Lipowsky R, Sackmann E. Structure and Dynamics of Membranes. 1st ed. Elsevier Science: North Holland; 1995. | |
Iglic A, Slivnika T, Kralj-Iglic V. Elastic properties of biological membranes influenced by attached proteins. J Biomech. 2007;40(11):2492–2500. | |
Kabaso D, Gongadze E, Elter P, et al. Attachment of rod-like (BAR) proteins and membrane shape. Mini Rev Med Chem. 2011;11(4):272–282. | |
Dobereiner HG, Evans E, Kraus M, Seifert U, Wortis M. Mapping vesicle shapes into the phase diagram: a comparison of experiment and theory. Phys Rev E Stat Phys Plasmas Fluids Relat Interdiscip Topics. 1997;55(4):4458–4474. | |
Ruiz-Herrero T, Velasco E, Hagan MF. Mechanisms of budding of nanoscale particles through lipid bilayers. J Phys Chem B. 2012;116(32):9595–9603. | |
Alexeev A, Uspal WE, Balazs AC. Harnessing Janus nanoparticles to create controllable pores in membranes. ACS Nano. 2008;2(6):1117–1122. | |
Zhang S, Nelson A, Beales PA. Freezing or wrapping: the role of particle size in the mechanism of nanoparticle-biomembrane interaction. Langmuir. 2012;28(35):12831–12837. | |
Jing B, Zhu Y. Disruption of supported lipid bilayers by semihydrophobic nanoparticles. J Am Chem Soc. 2011;133(28):10983–10989. | |
Ginzburg VV, Balijepalli S. Modeling the thermodynamics of the interaction of nanoparticles with cell membranes. Nano Lett. 2007;7(12):3716–3722. | |
Mecke A, Majoros IJ, Patri AK, Baker JR Jr, Holl MM, Orr BG. Lipid bilayer disruption by polycationic polymers: the roles of size and chemical functional group. Langmuir. 2005;21(23):10348–10354. | |
Chen J, Hessler JA, Putchakayala K, et al. Cationic nanoparticles induce nanoscale disruption in living cell plasma membranes. J Phys Chem B. 2009;113(32):11179–11185. | |
Hodzic A, Zoumpoulakis P, Pabst G, Mavromoustakos T, Rappolt M. Losartan’s affinity to fluid bilayers modulates lipid-cholesterol interactions. Phys Chem Chem Phys. 2012;14(14):4780–4788. | |
Sheetz MP, Singer SJ. Biological-membranes as bilayer couples – molecular mechanism of drug-erythrocyte interactions. Proc Natl Acad Sci U S A. 1974;71(11):4457–4461. | |
Betz T, Bakowsky U, Müller MR, Lehr CM, Bernhardt I. Conformational change of membrane proteins leads to shape changes of red blood cells. Bioelectrochemistry. 2007;70(1):122–126. | |
Soler MA, Báo SN, Alcântara GB, et al. Interaction of erythrocytes with magnetic nanoparticles. J Nanosci Nanotechnol. 2007;7(3):1069–1071. | |
Bregar VB, Lojk J, Suštar V, Veranicč P, Pavlin M. Visualization of internalization of functionalized cobalt ferrite nanoparticles and their intracellular fate. Int J Nanomedicine. 2013;8:919–931. |
Supplementary material
Disruption of lipid membranes by citric acid-adsorbed cobalt ferrite nanoparticles
Both samples exhibit lower saturation magnetization than bulk cobalt ferrite (CoFe2O4, 80 emu/g)1 due to their small size.2 Saturation magnetization for bare CoFe2O4 nanoparticles (NPs) is slightly lower than for citric acid (CA)-adsorbed CoFe2O4 NPs. During adsorption of CA, the NPs are magnetically separated from aqueous medium several times. The magnetic force acting on the individual nanoparticle is proportional to its magnetization and volume. For small nanoparticles, the magnetic force is much smaller, resulting in a slight decrease in the amount of very small nanoparticles, which decreases the saturation magnetization of the sample. This is probably the reason for the observed increase in saturation magnetization of CA-adsorbed CoFe2O4 NPs.
When bare CoFe2O4 NPs and CA-adsorbed CoFe2O4 NPs were dispersed in aqueous suspension, the magnetic behavior changed dramatically. Both suspensions displayed typical superparamagnetic behavior, showing zero coercivity and remanence (Figure S3). When suspended in liquid medium, the NPs are subjected to rotational motion in addition to Brownian movement. Rotation of the individual NPs in the case of CA-adsorbed CoFe2O4 NPs and rotation of the agglomerates in the case of bare CoFe2O4 NPs is the reason for randomization of the magnetic moments in the absence of an external magnetic field, and consequently for the superparamagnetic behavior. It is noteworthy that individual NPs and agglomerates are still in the ferromagnetic state and only their suspensions show superparamagnetic behavior because of moment relaxation with the rotational motion. Careful examination of the magnetization curves of the suspensions of the bare CoFe2O4 NPs and the CA-adsorbed CoFe2O4 NPs at room temperature show qualitatively different behavior in an external magnetic field. The curve for the suspension of the bare CoFe2O4 NPs is slightly opened and reminiscent of the hysteresis loop of antiferromagnetic material, whereas the curve for the suspension of CA-adsorbed CoFe2O4 NPs is closed and identical to the curve of a Langevin function.2 The reason probably lies in somewhat different magnetization and demagnetization within the agglomerates.
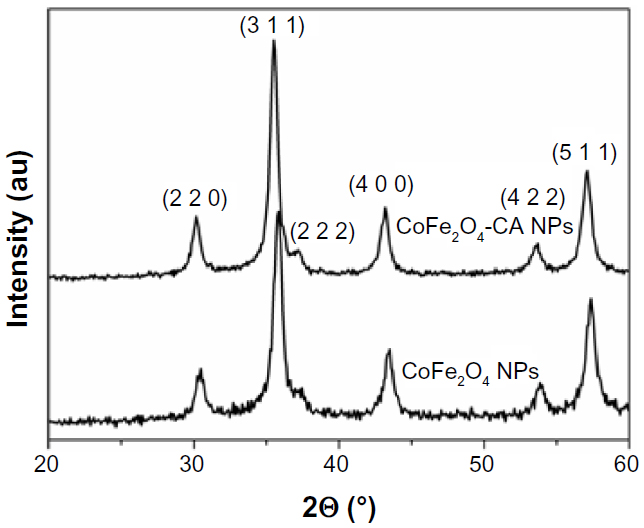 | Figure S1 X-ray diffractograms of bare CoFe2O4 NPs and CA-adsorbed CoFe2O4 NPs. |
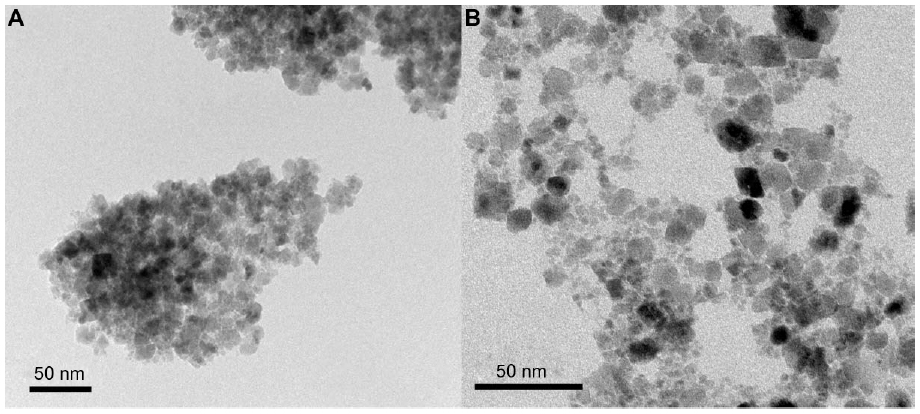 | Figure S2 Transmission electron microscopic image of bare CoFe2O4 NPs (A) and CA-adsorbed CoFe2O4 NPs (B) suspended in water at pH 7. |
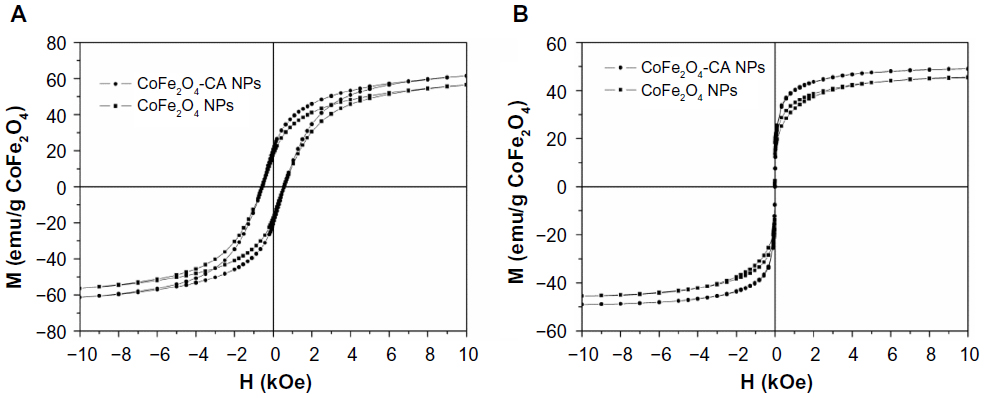 | Figure S3 Room-temperature magnetization curves for (A) dry powders of bare CoFe2O4 NPs and CA-adsorbed CoFe2O4 NPs and (B) suspensions of bare CoFe2O4 NPs and CA-adsorbed CoFe2O4 NPs. Magnetization values are normalized per gram of CoFe2O4. The amount of CoFe2O4 was measured by thermogravimetry. |
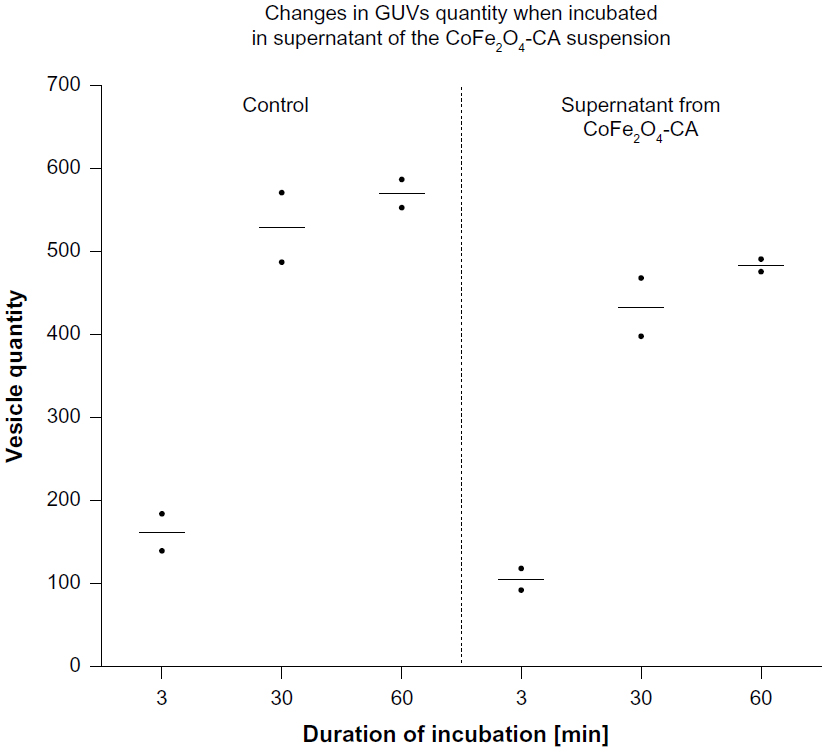 | Figure S4 Quantities of vesicles after incubation with supernatant of CoFe2O4-CA nanoparticles. Each dot represents number of vesicles per replicate. The mean values for vesicle quantity in each tested group are marked with bars. Each dot corresponds to a number of vesicles obtained in one sample of vesicles, ie, one replicate per each tested group. One sample of a population consists of all vesicles captured in two individual video tracks at different places in a chamber. Exact quantities are presented in Table S5. |
 | Figure S5 Scanning electron microscopic image of red blood cells after one hour of incubation in PBS-citrate buffer (control group). A majority of the red blood cells in the control group (more than 80% of total red blood cells) were nondiscocytes (not affected). |
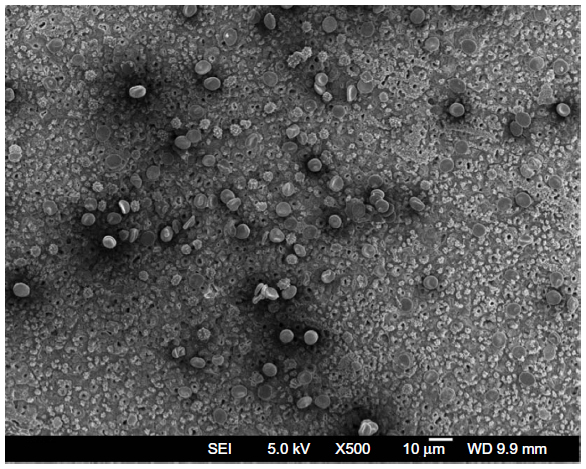
 | Figure S6 Scanning electron microscopic image of red blood cells after one hour of incubation in a suspension of CoFe2O4-CA NPs (1 mg/mL), where the morphology of red blood cells was altered in comparison with control group. This is a consequence of incubation with suspension of CoFe2O4-CA NPs, suspended in PBS-citrate buffer with a final concentration of NPs 1 mg/mL. |
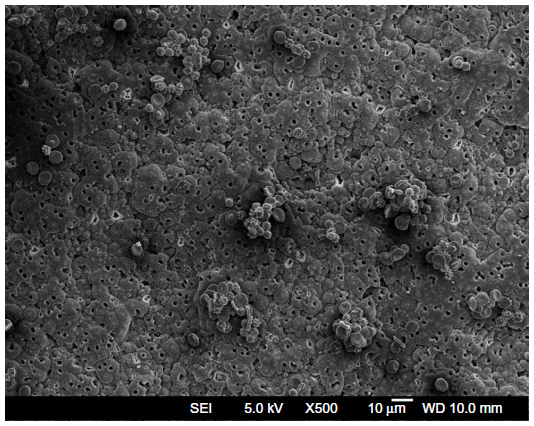
 | Figure S7 Scanning electron microscopic image of red blood cells after one hour of incubation in a suspension of bare CoFe2O4 NPs (1 mg/mL), where the morphology of red blood cells was altered in comparison with the control group (Figure S5), but to a lower extent than in incubation with suspension of CoFe2O4-CA NPs (Figure S6). |
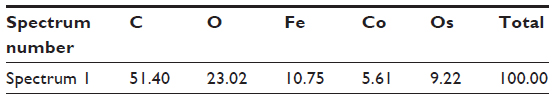
| Figure S8 Particle with Co and Fe detected in the sample of red blood cells incubated with bare CoFe2O4 NPs. Scanning electron microscopic image indicates the position where the EDS was performed (A) and EDS spectrum of the elements detected on the selected region on the surface of red blood cells (B). The origin of Os on the EDS spectrum is from the preparation process (post-fixation with osmium tetroxide), and the higher amount of C is due to the carbon disks on which the samples were mounted for scanning electron microscopy. |
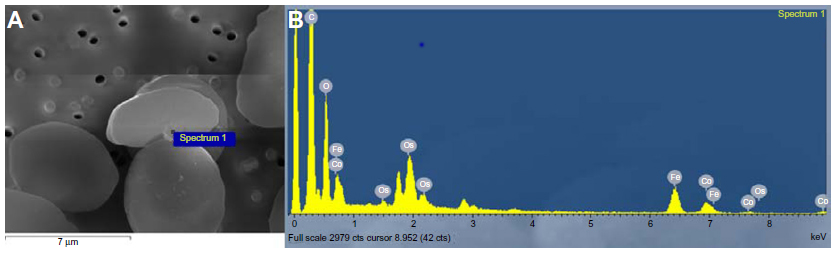 | Figure S9 Particle with Co and Fe detected in the sample of red blood cells incubated with CA-adsorbed CoFe2O4 NPs. Scanning electron microscopic image indicating the position where the EDS spectrum was performed (A) and the EDS spectrum of the elements detected on the selected region on the surface of the red blood cells. (B) The origin of Os on the EDS spectrum is from the preparation process (post-fixation with OsO4), and the higher amount of C is due to the carbon disks on which the samples are mounted for scanning electron microscopy. |
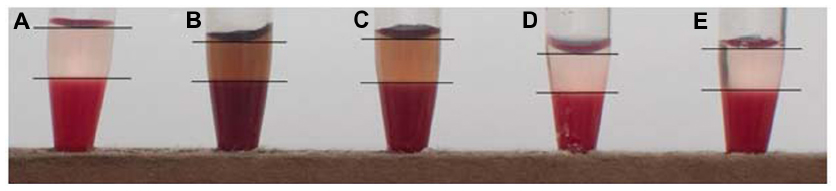 | Figure S10 Red blood cell sedimentation after incubation in bare CoFe2O4 NPs and CA-adsorbed CoFe2O4 NPs. Red blood cells + PBS-citrate buffer (4.7 mm/hour, Figure S10A), red blood cells + CA-adsorbed CoFe2O4 NPs 0.2 mg/mL (3.5 mm/hour, Figure S10B), red blood cells + CA-adsorbed CoFe2O4 NPs 0.1 mg/mL (3.9 mm/hour, Figure S10C), red blood cells + bare CoFe2O4 NPs 0.2 mg/mL (3.3 mm/hour, Figure S10D) and red blood cells + bare CoFe2O4 NPs 0.1 mg/mL (3.7 mm/hour, Figure S10E). All the suspensions with added NPs (Figure S10B–E) show a lower erythrocyte sedimentation rate compared with control (Figure S10A). Red coloration of the supernatant suspension resulting from hemolysis was observed, implying that the integrity of the red blood cell membrane could be compromised after incubation in all tested nanoparticle suspensions. |
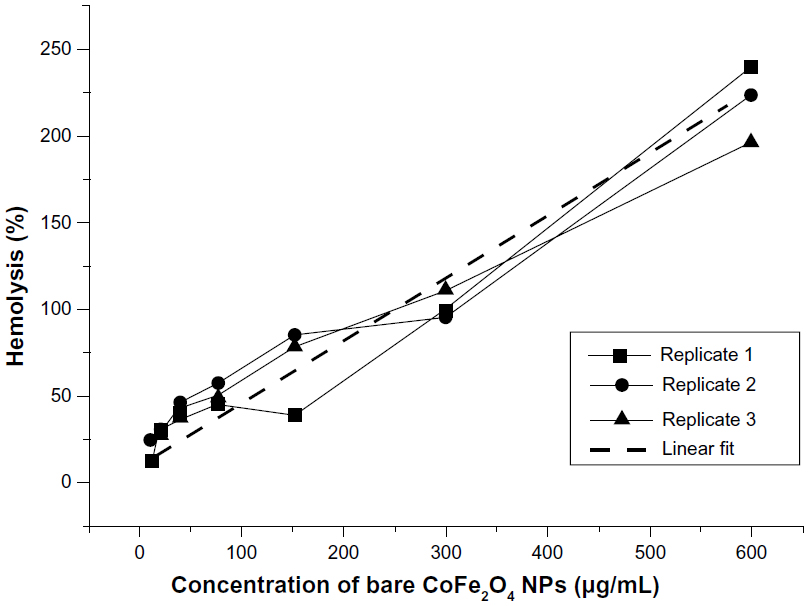 | Figure S11 Hemolysis of red blood cells after incubation in suspensions of bare CoFe2O4 NPs at a range of concentrations for one hour. We explain the values above 100% as a false-positive result due to strong agglomeration of the bare CoFe2O4 NPs that collected at the bottom of wells and disturbed the incoming optical path and are therefore interpreted as a false-positive result. |
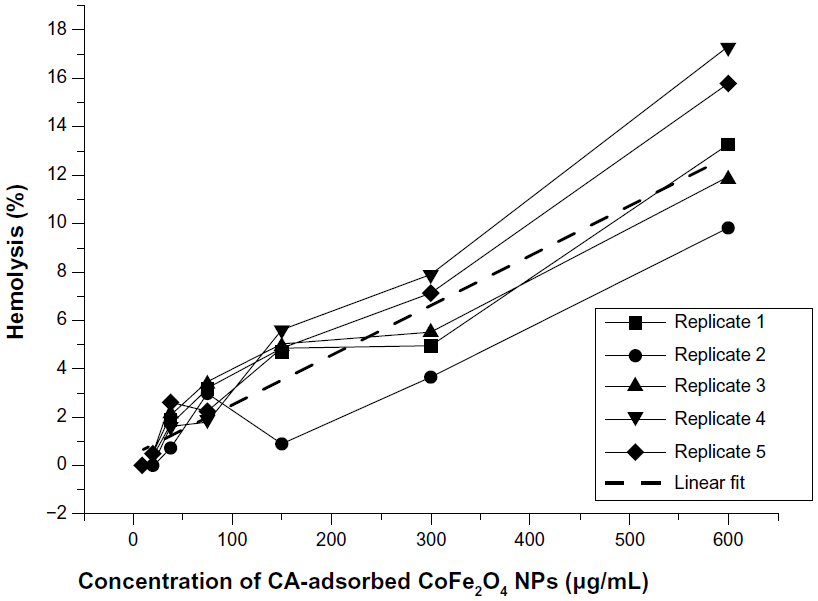 | Figure S12 Hemolysis of red blood cells after incubation in suspensions of CA-adsorbed CoFe2O4 NPs at a range of concentrations (five parallels). The criterion for hemolysis (>5%), indicating that the test material causes damage to red blood cells, was significantly exceeded only at the highest concentration of CA-adsorbed CoFe2O4 NPs (0.6 mg/mL). |
 | Table S1 Magnetic properties of bare CoFe2O4 NPs and CA-adsorbed CoFe2O4 NPs (powder samples) |
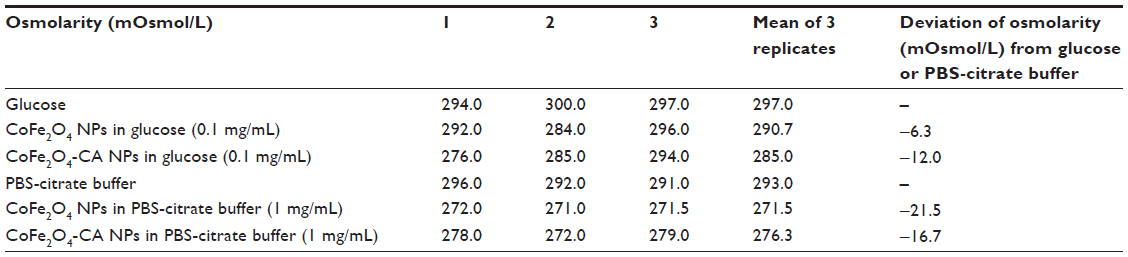 | Table S2 Osmolarity values for nanoparticle suspensions in 0.3 M glucose solution or in PBS-citrate buffer |
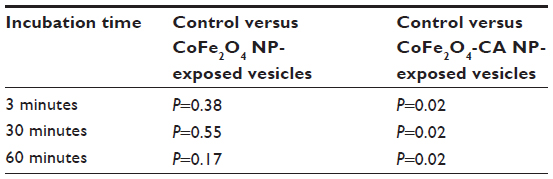 | Table S3 P-values for the Wilcoxon rank-sum test between vesicle quantities in the control population versus populations exposed to bare CoFe2O4 NPs and CA-adsorbed CoFe2O4 NP |
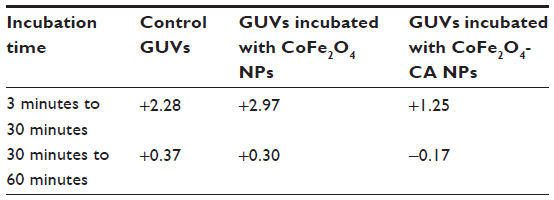 | Table S4 Factor of increase in mean vesicle quantities for different times of sample recording in each of the three populations |
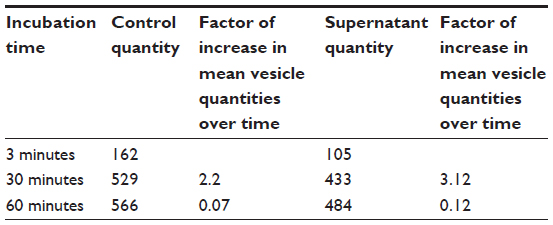 | Table S5 Mean vesicle quantities after incubation with supernatant of CA-adsorbed CoFe2O4 NPs compared with the control vesicles |
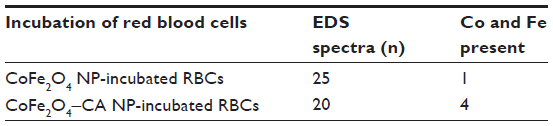 | Table S6 Results of the EDS analysis of selected clusters on the surface of RBCs incubated in bare CoFe2O4 and CA-adsorbed CoFe2O4 NPs |
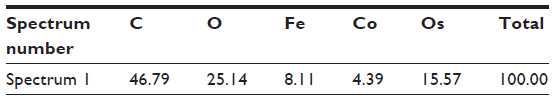 | Table S7 Results of EDS analyses performed on the surface of red blood cells, incubated in the suspension of bare CoFe2O4 NPs in PBS-citrate buffer, for the area indicated in Figure S8A |
 | Table S8 Results of EDS analysis performed on the surface of red blood cells incubated in a suspension of CA-adsorbed CoFe2O4 nanoparticles, for the area indicated in Figure S9A |
References
Smit J, Wijn HPJ. Ferrites. Eindhoven, the Netherlands: Philips’ Technical Library; 1959. | |
Kodama RH. Magnetic nanoparticles. J Magn Magn Mater. 1999;200:359–372. |
 © 2014 The Author(s). This work is published and licensed by Dove Medical Press Limited. The full terms of this license are available at https://www.dovepress.com/terms.php and incorporate the Creative Commons Attribution - Non Commercial (unported, v3.0) License.
By accessing the work you hereby accept the Terms. Non-commercial uses of the work are permitted without any further permission from Dove Medical Press Limited, provided the work is properly attributed. For permission for commercial use of this work, please see paragraphs 4.2 and 5 of our Terms.
© 2014 The Author(s). This work is published and licensed by Dove Medical Press Limited. The full terms of this license are available at https://www.dovepress.com/terms.php and incorporate the Creative Commons Attribution - Non Commercial (unported, v3.0) License.
By accessing the work you hereby accept the Terms. Non-commercial uses of the work are permitted without any further permission from Dove Medical Press Limited, provided the work is properly attributed. For permission for commercial use of this work, please see paragraphs 4.2 and 5 of our Terms.