")
Back to Journals » International Journal of Nephrology and Renovascular Disease » Volume 8
Effects of lanthanum carbonate versus calcium carbonate on vascular stiffness and bone mineral metabolism in hemodialysis patients with type 2 diabetes mellitus: a randomized controlled trial
Authors Wada K, Wada Y, Uchida H , Tsuruoka S
Received 19 June 2015
Accepted for publication 25 July 2015
Published 26 August 2015 Volume 2015:8 Pages 111—118
DOI https://doi.org/10.2147/IJNRD.S90791
Checked for plagiarism Yes
Review by Single anonymous peer review
Peer reviewer comments 3
Editor who approved publication: Professor Pravin Singhal
Kentaro Wada,1 Yuko Wada,2 Haruhito Adam Uchida,3 Shuichi Tsuruoka4
1Division of Nephrology and Dialysis, Department of Internal Medicine, Nippon Kokan Fukuyama Hospital, Hiroshima, 2Department of Internal Medicine, Central Hospital, Hiroshima, 3Department of Chronic Kidney Disease and Cardiovascular Disease, Okayama University Graduate School of Medicine, Dentistry and Pharmaceutical Sciences, Okayama, 4Division of Nephrology, Department of Internal Medicine, Graduate School of Medicine, Nippon Medical School, Tokyo, Japan
Background: Vascular calcification contributes to cardiovascular disease in hemodialysis (HD) patients with diabetes. The randomized controlled trial reported here compared the effects of lanthanum carbonate (LC) and calcium carbonate (CC) on vascular stiffness assessed using brachial-ankle pulse wave velocity (ba-PWV), intima-media thickness (IMT), bone mineral density (BMD), and serum markers of chronic kidney disease – mineral and bone disorder in such patients.
Methods: Ba-PWV, IMT, BMD, and the biomarkers osteocalcin (OC) and bone alkaline phosphatase (BAP) were examined in 43 type 2 diabetes HD patients treated with LC (n=21) or CC (n=22) for 2 years.
Results: Forty-one patients completed the study (19, LC; 22, CC). The mean ba-PWV significantly increased only in the CC group (median: 2,280.5 to 2,402.5 cm/s, P<0.05), after 24-month treatment; it remained unchanged in the LC group (median: 1,830.5 to 2,018.3 cm/s). However, the difference between the groups did not reach statistical significance. Changes in IMT and BMD were not different between the two groups. Changes in serum phosphorus, corrected calcium, and intact parathyroid hormone levels were similar between the groups. The incidence of fracture was 0% (0/19) in the LC group, and 13.6% (3/22) in the CC group (P=0.2478). The OC/BAP ratio increased significantly in the LC group (median: 0.83 to 2.47), compared with in the CC group (median: 0.77 to 1.40) (P=0.036).
Conclusion: From this study, in Japanese type 2 diabetes HD patients, we conclude that 2-year treatment with LC might have slowed the progression of ba-PWV; however, it did not cause a difference in ba-PWV, IMT, BMD, or fracture, compared with CC. Further, LC increased the OC/BAP ratio to a greater extent than CC.
Keywords: hemodialysis, diabetes, randomized controlled trial, lanthanum carbonate, vascular stiffness
Background
Vascular calcification is a contributor to cardiovascular disease (CVD), and patients under hemodialysis (HD) have a much higher odds ratio of 6.22 for any event.1 CVD is a leading cause of mortality among HD patients.2 Pulse wave velocity (PWV) and intima-media thickness (IMT) are typical, noninvasively measured parameters used to screen HD patients at high risk for CVD. High brachial-ankle (ba)-PWV has been demonstrated to predict the presence of CVD, comparable to the aortic PWV, in the general population. High ba-PWV is an independent determinant of carotid atherosclerosis and diastolic left ventricular dysfunction in HD patients.3 Ba-PWV or IMT data suggest that a patient requiring HD has a vascular age that is 20 years older than their chronological age.4 Further, the risk of cardiovascular events is high in patients with high ba-PWV or IMT.4 In end-stage renal disease, ba-PWV and IMT values are as high as those in chronic maintenance HD patients.5 Therefore, preventing atherosclerosis becomes important, even in the early stages of renal failure, and includes the management of calcium (Ca) and phosphorus (P) levels.
Ca and P metabolism abnormalities induce vascular calcification and may be risk factors for cardiovascular events in HD patients. In particular, hyperphosphatemia is reported to be closely associated with vascular calcification in HD patients.6 Further, compared with nondiabetic HD patients, those with diabetes mellitus (DM) are at high risk of developing vascular calcification, because of persistent hyperglycemia.7 Improving and maintaining appropriate P levels in HD patients also impacts patient mortality; prognosis can be improved by preventing the development of vascular calcification.7 Correcting mineral metabolism abnormalities is the only means of achieving this goal. The basic treatment involves hyperphosphatemia correction. Conventionally, calcium-based P binders (mainly calcium carbonate [CC]) are used to treat hyperphosphatemia in chronic kidney disease (CKD) patients. However, since these agents contain Ca, the Ca load in the intestine increases. Thus, ironically, CC may aggravate vascular calcification and hypercalcemia.7 This drawback can be overcome by administering sevelamer hydrochloride or lanthanum carbonate (LC) instead of CC.8
We previously reported that, compared with CC (primary outcome), LC administration, for up to 12 months, to HD patients with nonsevere aortic calcifications could better suppress the development of aortic calcifications, as determined using abdominal computed tomography scans.9 In the study reported here, we examined ba-PWV, IMT, bone mineral density (BMD), and serum markers of CKD-mineral and bone disorder (MBD) during LC or CC treatment over 24 months. The study aimed to compare the effects of LC and CC on these parameters.
Methods
Subjects
Between September 1 and November 30, 2010, 43 patients who met the study’s inclusion criteria were recruited from the Nippon Kokan Fukuyama Hospital Dialysis Center. The patient inclusion criteria were >20 years of age; type 2 DM (diagnosed according to the Japan Diabetes Society guidelines) with optimized, stable glycemic control for at least 3 months; HD treatment for at least 6 months; and a dialysis period of less than 5 years. The exclusion criteria included any significant gastrointestinal disorders, high risk of bleeding, elevated serum transaminase levels (>3 times the normal upper limits for aspartate aminotransferase or alanine aminotransferase), hypocalcemia (adjusted serum Ca level <7.5 mg/dL), severe cardiovascular complications, poorly controlled DM or hypertension, and contraindications for LC or CC therapy. Patients deemed inappropriate for this study were excluded by the investigators, including those receiving extended duration or nighttime HD, scheduled for parathyroidectomy, having undergone renal transplant within 6 months of enrollment, or having a life expectancy of <3 months.
Written informed consent was obtained from all subjects. The study protocol was approved by the institutional ethics committee of the Nippon Kokan Fukuyama Hospital (Institutional Review Board approval number, 2010-01) and was conducted in compliance with the Declaration of Helsinki and the Committee on Human Research (University Hospital Medication Information Network Clinical Trial Registry ID 000004633; for 1 year). The study spanned 2 years, although computed tomography scans were conducted only at baseline and at the 1-year follow-up. For a study period of 13–24 months, written informed consent to extend the study was reobtained from all subjects, and continuation of the study protocol was approved by the institutional ethics committee of the hospital (IRB approval number 2011-01).
Study protocol
Patients were randomized at a ratio of approximately 1:1 to receive either LC (chewable 250 and 500 mg tablets of Fosrenol® [Bayer, Osaka, Japan]) or CC (500 mg tablets of Caltan® [Merkhoei-Fuso, Tokyo, Japan]), three times daily orally, with meals, for 24 months. During screening, patients were classified according to age, sex, glycated hemoglobin (HbA1c) levels (according to the National Glycohemoglobin Standardization Program), and aortic calcification area index (ACI).9 For randomized group allocation, dynamic allocation, using ACI and HbA1c as regulators, was carried out using Microsoft® Access 2010 (Microsoft Corporation, Redmond, WA, USA). After screening, subjects underwent a 2-week washout, in which all P binders were withheld. Because of the size, appearance, and taste of the tablets, the study was open label, and participants, investigators, and treating physicians were not blinded to the medication. However, outcome assessors were blinded to treatment allocation and patient demographics.
Subjects initially received either LC or CC, with dose titrations every 2 weeks for the first 6 weeks to achieve normalization of serum P (target: 4.5–5.5 mg/dL) and corrected Ca levels (8.5–10.5 mg/dL). During the study, vitamin D analogs (calcitriol) were administered per usual care and optimal management of CKD-MBD. None of the subjects received cinacalcet or aluminum- and magnesium-based P binders. Target levels for serum markers of CKD-MBD were those recommended by the Japanese Society for Dialysis Therapy.
HD was performed using hollow-fiber dialyzers, such as cellulose triacetate and polysulfone, three times/week (4 hours/day). The same types of dialysis membranes and dialysate composition (Ca, 2.5 mEq/L) were used during the 2-year study. Safety was evaluated using adverse events and laboratory assessments. The target level of single-pool Kt/V was >1.4. Blood access in all the patients was via arteriovenous fistula in forearm (right or left).
For estimation of treatment adherence, the self-reported adherence score and the visual analog score were used to evaluate the subjects’ compliant behaviors in the last 4 weeks.
Geriatric Nutritional Risk Index score was calculated using a previously described formula.10
Laboratory methods
Serum samples were collected at baseline, prior to HD, from all patients at the start of the randomized controlled trial after the 2-week washout phase. Subsequently, samples were collected 2, 4, and 6 weeks after the start of medication, and, thereafter, monthly blood tests were conducted according to the hospital protocol. We compared the levels of hemoglobin (Hb), fasting plasma glucose, HbA1c, P, corrected Ca, magnesium (Mg), intact parathyroid hormone (int-PTH), albumin, total cholesterol, high-density lipoprotein cholesterol, triglycerides, C-reactive protein (CRP), osteocalcin (OC), and bone alkaline phosphatase (BAP), at the various time points. Blood was analyzed using a JCA-BM6050™ auto-analyzer (JEOL, Tokyo, Japan). The total serum Ca level was adjusted according to albumin level as follows: corrected Ca = Ca + 0.8 × (4.4 – albumin) g/dL. Int-PTH levels were measured using an immunometric assay (ARCHITECT i1000SR Immunoassay Analyzer; Abbott Laboratories, Abbott Park, IL, USA), as were OC levels (Mitsubishi Yuka BGP IRMA kit; LSI Medience Corporation, Tokyo, Japan) and BAP levels (Access Ostase®; Beckman Coulter, Brea, CA, USA).
Ba-PWV/IMT/BMD
To optimize reproducibility, all examinations were performed by the same technician using the same equipment under blinded conditions.
Ba-PWV
As described previously,11 ba-PWV was measured before the midweek dialysis cycle with the patient in the supine position, after resting for 10 minutes, using a PWV/ABI™ (Omron Colin, Tokyo, Japan). The assessment was conducted at baseline and after 12 and 24 months of treatment. This parameter was measured in both legs of each participant and expressed as a mean.
IMT
The IMT (maximum intima-media thickness [IMT-max] common carotid [IMT-Cmax], IMT-max bifurcation [IMT-Bmax], and IMT-max internal carotid [IMT-Imax]) was measured at baseline and after 12 and 24 months of treatment, using an Aplio™ ultrasound system (Toshiba Corporation, Tokyo, Japan).
BMD
The lumbar spine BMD value (dual-energy X-ray absorptiometry) was determined at baseline and after 12 and 24 months of treatment, using a Discovery W QDR Series™ (Hologic Inc, Bedford, MA, USA).
Radiography
Lateral X-ray films of the thoracic and lumbar spines were captured at baseline and after 24 months of treatment. The anterior, central, and posterior heights of each of the 13 vertebral bodies from Th4 to L4 were measured. A vertebral fracture was diagnosed when at least one of the three height measurements along the length of the same vertebra had decreased by >20% compared with the height of the nearest uncompressed vertebral body.12 None of the participants had histories of serious falls or accidents.
Statistical analysis
Since this study was a pilot study, expected outcomes could not be predicted from previous results regarding changes in ba-PWV, IMT, BMD, and serum markers related to CKD-MBD following LC administration to HD patients with DM.
Fisher’s exact test was used for categorical parameters and an unpaired t-test or Mann–Whitney rank-sum test for variable parameters. Bonferroni’s t-test was used for posthoc verification after repeated-measures analysis of variance (ANOVA) or Friedman’s repeated-measures ANOVA on ranks for continuous parameters. Two-way repeated-measures ANOVA was used for comparisons between the LC and CC groups. For verification of ba-PWV, IMT, BMD, and serum markers related to CKD-MBD (OC, BAP, OC/BAP ratio), Wilcoxon’s signed-rank test and the Mann–Whitney rank-sum test were used. For risk of fractures, Pearson’s chi-squared test with Yate’s continuity correction was used. All results are expressed as mean ± standard deviation or median (interquartile range); a P-value <0.05 was considered statistically significant. All statistical analyses were performed using SigmaStat® for Windows (v 3.5; Systat Software, San Jose, CA, USA).
Results
Patient characteristics and outcomes
The baseline characteristics of the study patients are summarized in Table 1. Forty-three patients (who completed the treatment regimens) were involved in this study, 21 in the LC group and 22 in the CC group. At the 24-month follow-up, 41 patients remained in the trial (LC, n=19; CC, n=22); the two LC-arm patients died of sepsis within 1 year of starting the study. Hypercalcemia or cardiovascular events were not observed throughout the study. However, eight patients were hospitalized for bacterial pneumonia (LC, n= 2; CC, n= 2) or bacterial colitis (CC, n= 1) during the 24-month treatment period, and three patients experienced fractures between 13 and 24 months of treatment (all in the CC arm; lumbar vertebral body, two; and left femoral neck, one). None of the patients discontinued the study medications because of adverse treatment effects or parathyroidectomy.
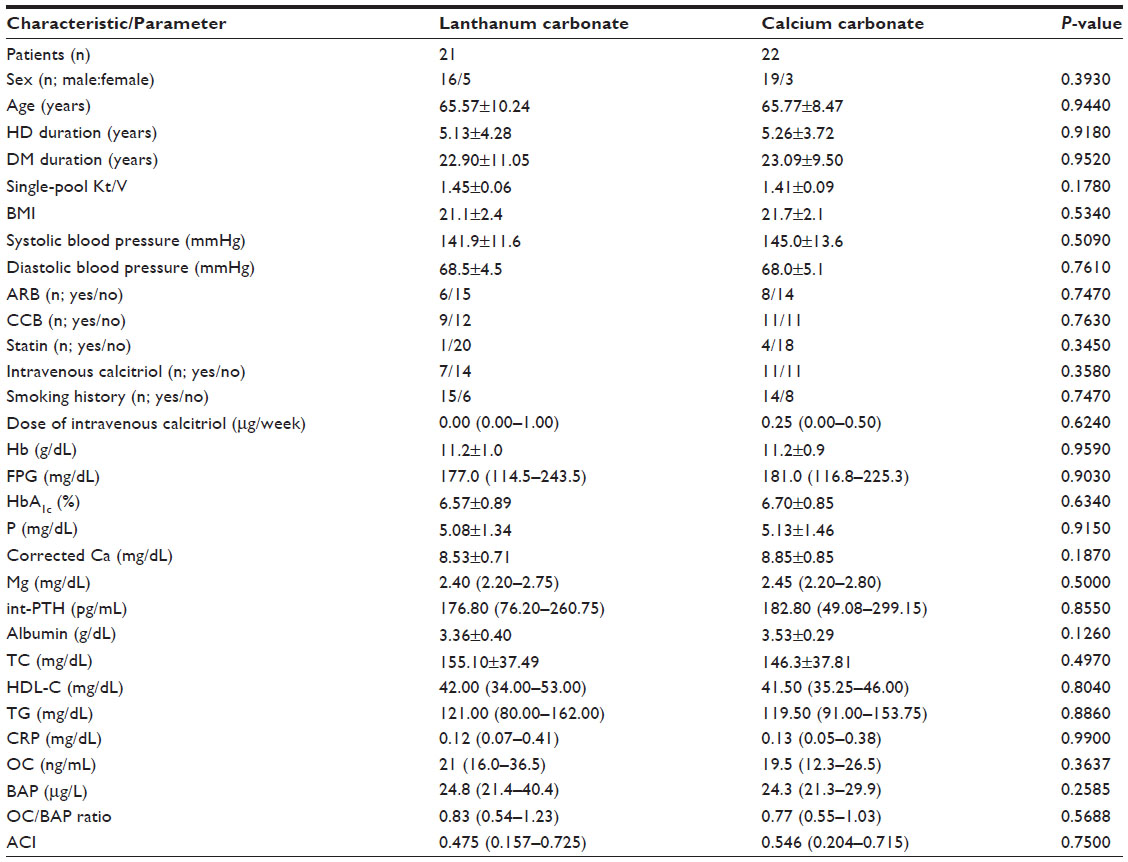 | Table 1 Patient characteristics and laboratory parameters |
Significant between-group differences were not observed with respect to age; sex; duration of HD; duration of DM; single-pool Kt/V; body mass index; systolic blood pressure; diastolic blood pressure; concomitant drug usage; calcitriol dose; smoking history; levels of Hb, fasting plasma glucose, HbA1c, P, corrected Ca, Mg, int-PTH, albumin, total cholesterol, high-density lipoprotein cholesterol, triglycerides, CRP, OC, or BAP; or ba-PWV, IMT (IMT-Cmax, IMT-Bmax, and IMT-Imax), or BMD. The plaque score, determined from the IMT and T-scores, was greater than or equal to −1.5 standard deviation for all patients. All subjects remained free of drugs known to influence bone and Ca metabolism, including coumarin anticoagulants, bisphosphonate, thiazolidinedione, vitamin K, dipeptidyl peptidase-4 inhibitor, and glucagon-like peptide-1 analog (except vitamin D). The incidence of antiplatelet medications (aspirin) at baseline was 52% (11/21) in the LC group and 55% (12/22) in the CC group, whereas it was 58% (11/19) in the LC group and 59% (13/22) in the CC group 2 years later.
In both groups, two patients were included who lower hemiparesis (known to influence fracture) complicated with cerebral infarction (developed before starting the study).
LC administration commenced at 750 mg/d, and the mean dose at the end of the study was 2,060±280 mg/d. CC administration commenced at 1,500 mg/d, and the average dose at the end of the study was 2,640±530 mg/d. For the LC and CC groups, the dosages of activated vitamin D at the start of the study were 0.00 (0.00–1.00) μg/week and 0.25 (0.00–0.50) μg/week, respectively, and at the end of the study they were 0.00 (0.00–1.00) μg/week and 0.27 (0.00–0.50) μg/week, respectively. No significant differences were observed between the groups in relation to the prescribed calcitriol dosage (data not shown).
Calculated estimation of treatment adherence did not differ significantly between groups at baseline (LC, 87.6%±16.5% vs CC, 82.3%±22.5%); however, after 2 years, it was significantly higher in the LC group than in the CC group (LC, 91.8%±8.8% vs CC, 70.3±19.6%; P<0.01).
The Geriatric Nutritional Risk Index score did not differ significantly between the groups at baseline (LC, 90.7±6.9 vs CC, 91.6±4.3); however, 2 years later, it was significantly lower in the CC group than in the LC group (LC, 90.6±6.6 vs CC, 89.3±4.3; P<0.01).
Changes in biochemical markers during the study period
The key biochemical end points studied in all patients are summarized in Table 2. Glycemic control was stable in all patients. Between-group difference was not statistically significant concerning serum P or corrected Ca levels. Int-PTH levels increased in both groups (the increase was significant only in the CC group; P<0.05) at the 24-month follow-up; however, no significant difference was found between groups. Although OC and BAP levels differed between the baseline and 24-month follow-up measures, in both patient groups, a significant difference between the groups was not observed. Further, the OC/BAP ratio significantly increased in the LC group relative to the CC group (P=0.036). Additionally, no significant differences were found in other biochemical markers between groups.
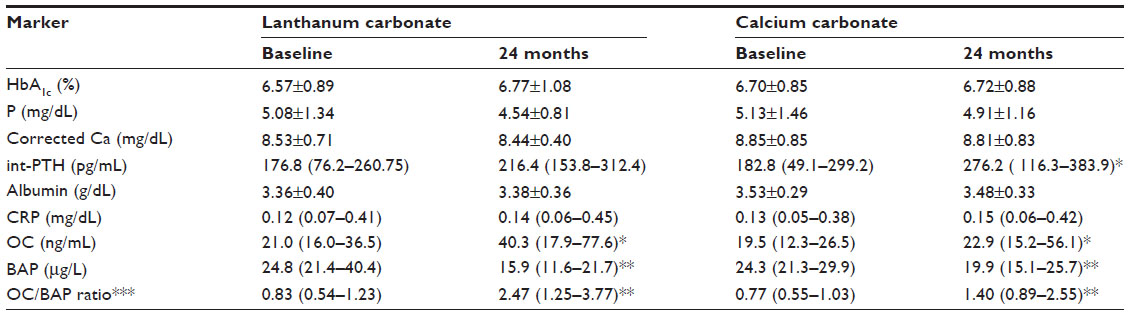 | Table 2 Changes in biochemical markers during the study period |
Ba-PWV
The mean ba-PWV significantly increased only in the CC group (median: 2,280.5 to 2,402.5 cm/s, P<0.05), after the treatment for 24-month treatment; it remained unchanged in the LC group (median: 1,830.5 to 2,018.3 cm/s). However, the difference between the groups did not reach statistical significance (Table 3). Analysis of the ba-PWV changes (Δ%ba-PWV) did not show any significant differences between the groups.
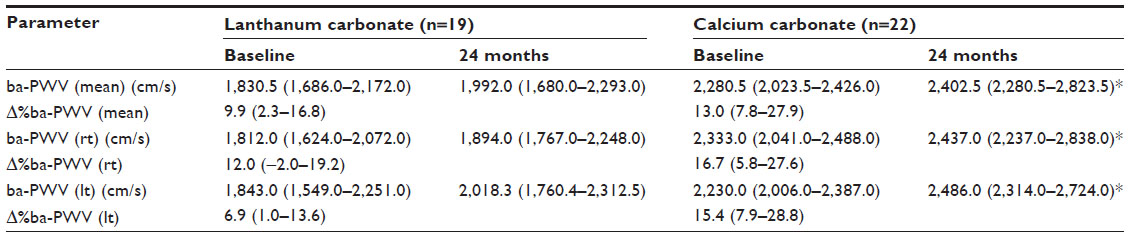 | Table 3 Changes in brachial-ankle pulse wave velocity (ba-PWV) (mean, right [rt], and left [lt]) during the study period |
IMT (IMT-Cmax, IMT-Bmax, and IMT-Imax)
The mean values of IMT subtypes (IMT-Cmax, -Bmax, and -Imax) significantly increased (both groups), except left IMT-Cmax, Bmax, and Imax (LC group), and right IMT-Imax (CC group) (Table 4). The left side Δ%IMT-Bmax was significantly lower in the LC group (P<0.001). However, ANOVA analyses of the two groups did not reach statistical significance for any subtype.
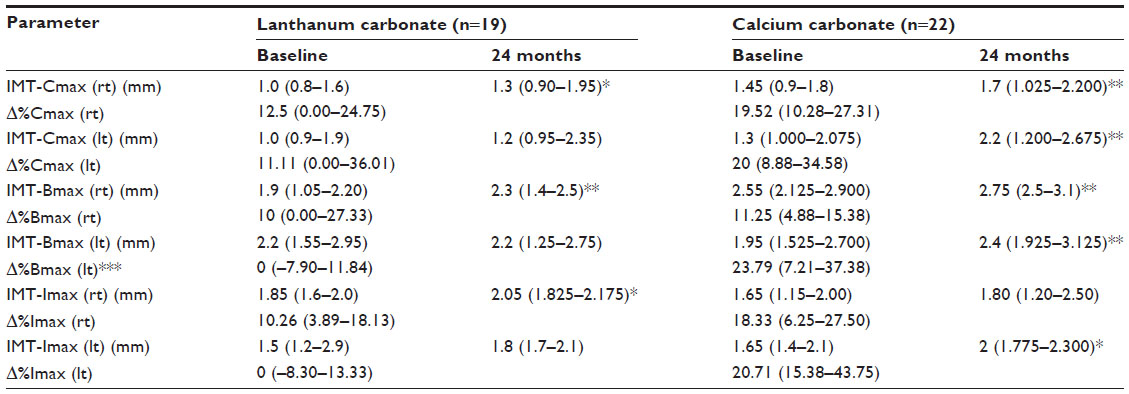 | Table 4 Changes in IMT-Cmax, Bmax, and Imax (left [lt] and right [rt]) during the study period |
BMD
The lumbar spine BMDs and Δ%BMDs did not show significant between-group differences throughout the study period (Table 5). Further, they did not differ significantly between the baseline and 24-month follow-up measurements.
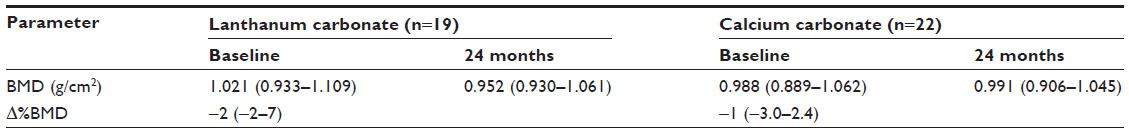 | Table 5 Change in bone-mass density (BMD) during the study period |
Radiography
Three patients (3/22, 13.6%, all male) in the CC group sustained fractures (two types of vertebral fracture) between 13 and 24 months of treatment; no patient in the LC group sustained a fracture. However, Pearson’s chi-squared test with Yate’s continuity correction of the two groups did not reach statistical significance (P=0.2478).
Discussion
Increases in ba-PWV and IMT levels have been shown to be independent risk factors of cardiovascular death13 in chronic HD patients. Therefore, these parameters have considerable clinical significance. In the study reported here, HD patients with type 2 DM were randomly assigned to a CC or LC treatment group; the effects of both drugs on ba-PWV and IMT were investigated over 2 years. The main findings of this study were that: 1) 2-year treatment with LC seemed to be slowing progression of ba-PWV, but did not show a difference in ba-PWV, IMT, BMD, or fracture, compared with CC; and 2) LC increased the OC/BAP ratio in HD patients with type 2 DM to a greater extent than CC.
Matsumoto et al14 reported that in hypertensive non-dialysis patients, ba-PWV was positively correlated with IMT. However, little is known about the correlation between ba-PWV and IMT in HD patients. Seifert et al15 reported that changes in ba-PWV appeared earlier than those in IMT, although their study was limited to patients with early stage CKD. Moreover, they found that a 1-year LC treatment had no effect on ba-PWV or IMT increases, compared with the placebo. Therefore, we extended the present study to 2 years. Since several of our patients required medication changes, we were unable to extend the study further.
The Δ%IMT seemed to be lower in the LC group than in the CC group, although the between-group difference was not statistically significant (except for the left Δ% IMT-Bmax). Unfortunately, we were unable to clearly detect the differential effects of LC and CC on the development of arterial stiffness in this 2-year study. However, LC seemed to be slowing the progression of ba-PWV. Although blood pressure is one of the most important contributing factors to PWV, we did not find a significant difference in blood pressure between LC and CC in this study (data not shown). The ba-PWV increased only in the CC group, and it remained unchanged in the LC group. The mean ba-PWV increased only in the CC group, after the treatment for 24-month treatment, and it remained unchanged in the LC group. Therefore, we assumed that LC might be slowing the progression of PWV (vascular stiffness).
Further, LC not only has phosphorus-lowering effects, but also facilitates slowing the progression of atherosclerosis or calcification. The present study showed that LC could be slowing an increase in ba-PWV to a greater extent than did CC. Thus, long-term administration of LC may reduce the risk of CVD in type 2 DM, HD patients.
We also found that LC increased the OC/BAP ratio to a greater extent than CC. Previous in vitro studies have shown that chronic hyperglycemia decreases OC expression and cellular Ca uptake, and increases BAP activity and expression.16 OC is also influenced by the concentration and administration of vitamin D receptor activator.17 Moreover, a low OC/BAP ratio increases the risk of vertebral fractures and poor glycemic control in Japanese type 2 DM patients.18 The present study showed that serum OC increased and BAP decreased significantly in both the LC and CC groups, after 2 years of treatment, compared with baseline values (no significant differences were found between groups). Three possible reasons for these findings are as follows: first, the patients all had stable glycemic control throughout the study; second, switching from CC to LC may have increased serum OC levels;19 and third, the reduction of BAP might also have affected the elevation of the OC/BAP ratio, especially in LC group, since the OC/BAP ratio remained higher in the LC group than in the CC group throughout the study. The result that the levels of BAP dropped more in LC group might indicate that the LC group is at risk for adynamic bone disease.
Hypoalbuminemia or inflammation might not affect bone mineral metabolism because serum albumin and CRP level was stable and did not change throughout the study period in both groups, and significant differences were not observed between groups.
Limitations
Our study has some limitations. First, the number of patients was small, and our sample included only eleven patients with baseline int-PTH levels lower than the value recommended in the Japanese Society for Dialysis Therapy or Kidney Disease Outcomes Quality Initiative guidelines (<60 pg/mL) (seven in the CC group, four in the LC group). The association of the baseline int-PTH level with LC treatment for progression of calcification needs to be investigated. Second, disease condition may have been rather severe in our patients (since the hospital is a tertiary center for evaluation and treatment of CKD and DM). Therefore, these patients may not have been representative of Japanese dialysis patients. Third, this study included patients with high baseline ba-PWV levels, and the implications of this are unknown. Fourth, serum P level seemed to be higher in the CC group than in the LC group after 2 years, and serum P level might affect the progression of vascular calcification (although the between-group difference was not statistically significant). Fifth, the lack of calculated estimation of treatment adherence with CC could also affect the outcome. Sixth, misclassification bias may have occurred and influenced changes in biochemical markers during the study period. Finally, there was the possibility of contamination and co-intervention, since treatment was not blinded.
Conclusion
In this study, we found that in Japanese type 2 DM HD patients, 1) 2-year treatment with LC might slow the progression of ba-PWV (vascular stiffness), but there was no difference in ba-PWV, IMT, BMD, or fracture, compared with CC; and 2) LC increased the OC/BAP ratio to a greater extent than CC.
Disclosure
Kentaro Wada, Yuko Wada, and Shuichi Tsuruoka have no competing interests. Haruhito A Uchida belongs to the Department of Chronic Kidney Disease and Cardiovascular Disease which is endowed by Chugai Pharmaceutical Co., Ltd, MSD, Boehringer Ingelheim, and Kawanishi Holdings. The authors have no other conflicts of interest in this work.
References
Rennenberg RJ, Kessels AG, Schurgers LJ, van Engelshoven JM, de Leeuw PW, Kroon AA. Vascular calcifications as a marker of increased cardiovascular risk: a meta-analysis. Vasc Health Risk Manag. 2009;5(1):185–197. | |
Covic A, Kothawala P, Bernal M, Robbins S, Chalian A, Goldsmith D. Systematic review of the evidence underlying the association between mineral metabolism disturbances and risk of all-cause mortality, cardiovascular mortality and cardiovascular events in chronic kidney disease. Nephrol Dial Transplant. 2009;24(5):1506–1523. | |
Fujiu A, Ogawa T, Matsuda N, Ando Y, Nitta K. Aortic arch calcification and arterial stiffness are independent factors for diastolic left ventricular dysfunction in chronic hemodialysis patients. Circ J. 2008;72(11):1768–1772. | |
Morimoto S, Yurugi T, Aota Y, et al. Prognostic significance of ankle-brachial index, brachial-ankle pulse wave velocity, flow-mediated dilation, and nitroglycerin-mediated dilation in end-stage renal disease. Am J Nephrol. 2009;30(1):55–63. | |
Shinohara K, Shoji T, Tsujimoto Y, et al. Arterial stiffness in predialysis patients with uremia. Kidney Int. 2004;65(3):936–943. | |
Shioi A, Taniwaki H, Jono S, et al. Mönckeberg’s medial sclerosis and inorganic phosphate in uremia. Am J Kidney Dis. 2001;38(4 Suppl 1):S47–S49. | |
Ishimura E, Okuno S, Taniwaki H, et al. Different risk factors for vascular calcification in end-stage renal disease between diabetics and nondiabetics: the respective importance of glycemic and phosphate control. Kidney Blood Press Res. 2008;31(1):10–15. | |
Jamal SA, Vandermeer B, Raggi P, et al. Effect of calcium-based versus non-calcium-based phosphate binders on mortality in patients with chronic kidney disease: an updated systematic review and meta-analysis. Lancet. 2013;382(9900):1268–1277. | |
Wada K, Wada Y. Evaluation of aortic calcification with lanthanum carbonate vs calcium-based phosphate binders in maintenance hemodialysis patients with type 2 diabetes mellitus: an open-label randomized controlled trial. Ther Apher Dial. 2014;18(4):353–360. | |
Yamada K, Furuya R, Takita T, et al. Simplified nutritional screening tools for patients on maintenance hemodialysis. Am J Clin Nutr. 2008; 87(1):106–113. | |
Kato A, Takita T, Furuhashi M, Kumagai H, Hishida A. A small reduction in the ankle-brachial index is associated with increased mortality in patients on chronic hemodialysis. Nephron Clin Pract. 2010;114:C29–C37. | |
Genant HK, Jergas M, Palermo L, et al. Comparison of semiquantitative visual and quantitative morphometric assessment of prevalent and incident vertebral fractures in osteoporosis. The Study of Osteoporotic Fractures Research Group. J Bone Miner Res. 1996;11(7):984–996. | |
Kato A, Takita T, Furuhashi M, Maruyama Y, Miyajima H, Kumagai H. Brachial-ankle pulse wave velocity and the cardio-ankle vascular index as a predictor of cardiovascular outcomes in patients on regular hemodialysis. Ther Apher Dial. 2012;16(3):232–241. | |
Matsumoto C, Tomiyama H, Yamada J, Yoshida M, Shiina K, Yamashita A. Brachial-ankle pulse wave velocity as a marker of subclinical organ damage in middle-aged patients with hypertension. J Cardiol. 2008;51(3):163–170. | |
Seifert ME, de las Fuentes L, Rothstein M, et al. Effects of phosphate binder therapy on vascular stiffness in early-stage chronic kidney disease. Am J Nephrol. 2013;38(2):158–167. | |
Botolin S, McCabe LR. Chronic hyperglycemia modulates osteoblast gene expression through osmotic and non-osmotic pathways. J Cell Biochem. 2006;99(2):411–424. | |
Cianciolo G, La Manna G, Della Bella E, et al. Effect of vitamin D receptor activator therapy on vitamin D receptor and osteocalcin expression in circulating endothelial progenitor cells of hemodialysis patients. Blood Purif. 2013;35(1–3):187–195. | |
Kanazawa I, Yamaguchi T, Yamamoto M, Yamauchi M, Yano S, Sugimoto T. Serum osteocalcin/bone-specific alkaline phosphatase ratio is a predictor for the presence of vertebral fractures in men with type 2 diabetes. Calcif Tissue Int. 2009;85(3):228–234. | |
Manabe R, Fukami K, Ando R, et al. Effects of switching from calcium carbonate to lanthanum carbonate on bone mineral metabolism in hemodialysis patients. Ther Apher Dial. 2013;17 Suppl 1:35–40. |
 © 2015 The Author(s). This work is published and licensed by Dove Medical Press Limited. The full terms of this license are available at https://www.dovepress.com/terms.php and incorporate the Creative Commons Attribution - Non Commercial (unported, v3.0) License.
By accessing the work you hereby accept the Terms. Non-commercial uses of the work are permitted without any further permission from Dove Medical Press Limited, provided the work is properly attributed. For permission for commercial use of this work, please see paragraphs 4.2 and 5 of our Terms.
© 2015 The Author(s). This work is published and licensed by Dove Medical Press Limited. The full terms of this license are available at https://www.dovepress.com/terms.php and incorporate the Creative Commons Attribution - Non Commercial (unported, v3.0) License.
By accessing the work you hereby accept the Terms. Non-commercial uses of the work are permitted without any further permission from Dove Medical Press Limited, provided the work is properly attributed. For permission for commercial use of this work, please see paragraphs 4.2 and 5 of our Terms.