")
Back to Journals » Vascular Health and Risk Management » Volume 10
Effects of extended-release niacin/laropiprant, simvastatin, and the combination on correlations between apolipoprotein B, LDL cholesterol, and non-HDL cholesterol in patients with dyslipidemia
Authors Farnier M, Chen E, Johnson-Levonas AO, McCrary Sisk C, Mitchel YB
Received 4 December 2013
Accepted for publication 12 February 2014
Published 7 May 2014 Volume 2014:10 Pages 279—290
DOI https://doi.org/10.2147/VHRM.S58694
Checked for plagiarism Yes
Review by Single anonymous peer review
Peer reviewer comments 3
Michel Farnier,1 Erluo Chen,2 Amy O Johnson-Levonas,2 Christine McCrary Sisk,2 Yale B Mitchel2
1Point Médical, Dijon, France; 2Merck and Co, Inc., Whitehouse Station, NJ, USA
Background: Statins modify correlations between apolipoprotein B (apoB) and low-density lipoprotein cholesterol (LDL-C) and apoB and non-high-density lipoprotein cholesterol (non-HDL-C); however, it is not known whether niacin-based therapies have similar effects.
Objective: To evaluate the effects of extended-release niacin (ERN)/laropiprant (LRPT), simvastatin (SIMVA), and ERN/LRPT + SIMVA (pooled ERN/LRPT + SIMVA) on apoB:LDL-C and apoB:non-HDL-C correlations in dyslipidemic patients.
Methods: This post-hoc analysis of a 12-week study evaluated the apoB:LDL-C and apoB:non-HDL-C correlations in dyslipidemic patients randomized equally to double-blind ERN/LRPT 1 g/20 mg, SIMVA 10, 20, or 40 mg, or ERN/LRPT 1 g/20 mg + SIMVA (10, 20, or 40 mg) once daily for 4 weeks. At week 5, doses were doubled in all groups except SIMVA 40 mg (unchanged) and ERN/LRPT 1 g/20 mg + SIMVA 40 mg (switched to ERN/LRPT 2 g/40 mg + SIMVA 40 mg). Simple linear regression analyses were used to calculate LDL-C and non-HDL-C levels corresponding to known apoB baseline values (ie, in untreated patients) and following treatment.
Results: The apoB:LDL-C and apoB:non-HDL-C correlations were higher and the predicted LDL-C and non-HDL-C levels for a known apoB value were considerably lower following treatment with ERN/LRPT, SIMVA and ERN/LRPT + SIMVA compared with untreated patients at baseline.
Conclusion: Greater dissociation of apoB, LDL-C, and non-HDL-C targets occur following treatment with ERN/LRPT, SIMVA, and ERN/LRPT + SIMVA in patients with dyslipidemia. The achievement of more aggressive LDL-C and non-HDL-C goals in patients receiving lipid-modifying therapy may further reduce coronary risk by normalizing apoB-containing atherogenic lipoproteins.
Keywords: apoB, LDL-C, non-HDL-C
Introduction
Low-density lipoprotein cholesterol (LDL-C) is the primary treatment target in patients with primary hypercholesterolemia.1,2 Non-high-density lipoprotein cholesterol (non-HDL-C) and apolipoprotein B (apoB) are secondary treatment targets in patients with high triglycerides (TGs) and/or type 2 diabetes mellitus.1,3–6 Prior clinical study results indicate that apoB and non-HDL-C levels may be better predictors of future coronary risk than LDL-C, especially in high-risk patient populations, such as those with type 2 diabetes.7–12
Statins are the primary recommended treatment modality for dyslipidemia, as they provide excellent LDL-C-lowering effects; however, many patients fail to attain their LDL-C, non-HDL-C, and apoB goals with statin monotherapy and require combination therapy with other lipid/lipoprotein-modifying agents to reach increasingly aggressive targets.13
Niacin (nicotinic acid) is a broad-spectrum, lipid-regulating agent that increases HDL-C levels and reduces LDL-C, apoB, non-HDL-C, and TG levels. Prior clinical studies have shown that niacin monotherapy reduces myocardial infarction at 5 years and cardiovascular mortality at 15 years, and slows progression/induces regression of atherosclerotic plaque in patients with cardiovascular disease when used in combination with other lipid-modifying therapies (statins, bile acid resins, or both).1,14–17
The combination of statins and niacin produce complementary effects on plasma lipid/lipoprotein profiles; however, two large coronary outcomes trials demonstrated that extended-release niacin (ERN) offered no benefits beyond statin therapy alone in reducing cardiovascular events in patients with established cardiovascular disease.18,19 Despite these negative results, niacin remains a treatment option and may play a role in the treatment of certain disease states in specific patient groups (eg, statin intolerant patients). Thus, additional research is needed to determine why the apparent complementary lipid-modifying effects of niacin plus statin combination therapy did not produce beneficial effects on cardiovascular events in these studies.
Several studies have evaluated the effects of statin therapy on the correlations between apoB:LDL-C and apoB:non-HDL-C;20–26 however, the effect of niacin on these correlations has not been investigated to date. The current post-hoc analysis of a previously published study27 compared the effects of a combination tablet containing ERN/laropiprant (LRPT), simvastatin (SIMVA), and coadministration of ERN/LRPT with SIMVA on the correlations between apoB:LDL-C and apoB:non-HDL-C in patients with dyslipidemia. Given the known influence of TG levels on LDL particle composition, the relationships between these parameters were examined in subgroups of patients with low and high TG values at baseline and following treatment.
Methods
Study design
This was a post-hoc analysis of an international, multicenter, double-blind, randomized, active-controlled, parallel-group, factorial study conducted in patients with primary hypercholesterolemia or mixed hyperlipidemia.27 Complete details regarding study design and patient entry criteria are published elsewhere (Protocol 022, ClinicalTrials.gov: NCT00269217).27 In brief, eligible patients included men and women aged 18–85 years with primary hypercholesterolemia or mixed hyperlipidemia and TG levels ≤3.95 mmol/L prior to randomization. Additionally, patients were required to meet one of the following two NCEP (National Cholesterol Education Program) Adult Treatment Program III categories for coronary heart disease risk: 1) LDL-C levels ≥3.36 and ≤4.91 mmol/L (for patients with 0–1 risk factors) or 2) ≥3.36 and ≤4.14 mmol/L (for patients with multiple risk factors). The study protocol was approved by the institutional review boards at every study center, and informed consent was obtained from each subject before the initiation of any study procedures. The study was conducted in accordance with the principles of Good Clinical Practice.
After a 6–8-week drug-washout and a 4-week placebo run-in phase, patients (n=1,398) were randomized equally to the following seven treatments, received once-daily with an evening meal for 4 weeks: ERN/LRPT 1 g/20 mg, SIMVA (10, 20, or 40 mg), or ERN/LRPT 1 g/20 mg + SIMVA (10, 20 or 40 mg). At week 5, doses were doubled in all groups except SIMVA 40 mg (unchanged) and ERN/LRPT 1 g/20 mg + SIMVA 40 mg (switched to ERN/LRPT 2 g/40 mg + SIMVA 40 mg) for the remaining 8 weeks.
Clinical laboratory measurements
All analyses were conducted on fasting blood samples at a Center for Disease Control-certified laboratory. Total cholesterol and TGs were measured by enzymatic methods. LDL-C was calculated by use of Friedewald’s equation.28 Non-HDL-C was calculated by subtracting HDL-C from total cholesterol values. ApoB was measured in whole plasma by radioimmunoassay and nephelometry.
Statistical methods
The post-hoc analysis was performed on the subset of patients who had a baseline and week 4 or later value for all three variables of interest (ie, apoB, LDL-C, and non-HDL-C). All analyses were performed in a modified version of the intent-to-treat population (n=1,245 in the full analysis set population for week 12 analysis). Additional analyses were performed in patient subgroups defined by TG values <2.26 mmol/L (normal or borderline–high TG) and ≥2.26 mmol/L (hypertriglyceridemic).
Least squares (LS) mean percentage changes from baseline in LDL-C, non-HDL-C, and apoB were compared between treatment groups using an analysis of covariance (ANCOVA) model, with terms for treatment, country, sex, and corresponding baseline lipid value as covariates. The within- and between-group differences in LS mean percentage changes from baseline with 95% confidence interval (CI) and P-values were estimated from the ANCOVA model.
Simple linear regression models with apoB as a response variable were fitted on the overall population, with paired baseline and post-baseline values for apoB and LDL-C or apoB and non-HDL-C to study the linear relationships at baseline and study end. The predicted values of LDL-C and non-HDL-C for a known apoB value of 0.8 or 0.9 g/L were calculated from the simple linear regression model. Pearson correlation coefficients between apoB:LDL-C and apoB:non-HDL-C were computed to determine the strength and direction of these linear correlations.
An analysis was conducted to determine the degree of concordance between apoB:LDL-C and apoB:non-HDL-C. The data were divided into quintiles of apoB, LDL-C, and non-HDL-C, and each patient was categorized into a quintile for each parameter. A patient who was categorized into the same quintile for the two parameters under comparison was considered concordant, whereas a patient who was categorized into different quintiles for these two parameters was considered discordant. Perfect overlap was indicated by 20% on each of the diagonal cells and 0% of the diagonals in the quintile tables (data not shown). The weighted kappa statistic was used to quantify the overall degree of concordance between the parameters. The concordance analyses were applied to the whole population and the TG subgroups (<2.26 and ≥2.26 mmol/L) prior to treatment and at endpoint.
Results
Demographics
Of the 1,398 randomized patients, a subset of 1,233 (88%) patients had apoB, LDL-C, and non-HDL-C measurements taken at baseline and weeks 5–12 post-randomization. At baseline, the patient demographics and lipid/lipoprotein characteristics were generally well balanced across the ERN/LRPT, pooled SIMVA, and pooled ERN/LRPT + SIMVA groups for the overall population and within each of the patient subgroups defined by baseline TG (<2.26 and ≥2.26 mmol/L; Table 1). In general, patients with baseline TG ≥2.26 mmol/L had higher mean baseline body mass index values and a higher stratified coronary heart disease risk at baseline compared with those in the TG <2.26 mmol/L subgroup. Patients in the TG ≥2.26 mmol/L subgroup also demonstrated lipid/lipoprotein abnormalities typical of mixed dyslipidemia, including high apoB and low HDL-C with comparable LDL-C levels relative to the TG <2.26 mmol/L subgroup. Similar trends in demographic differences between the low and high TG subgroups were observed within the individual treatment groups (ie, SIMVA 20 mg, SIMVA 40 mg, ERN/LRPT + SIMVA 20 mg, and ERN/LRPT + SIMVA 40 mg broken down by dose; data not shown).
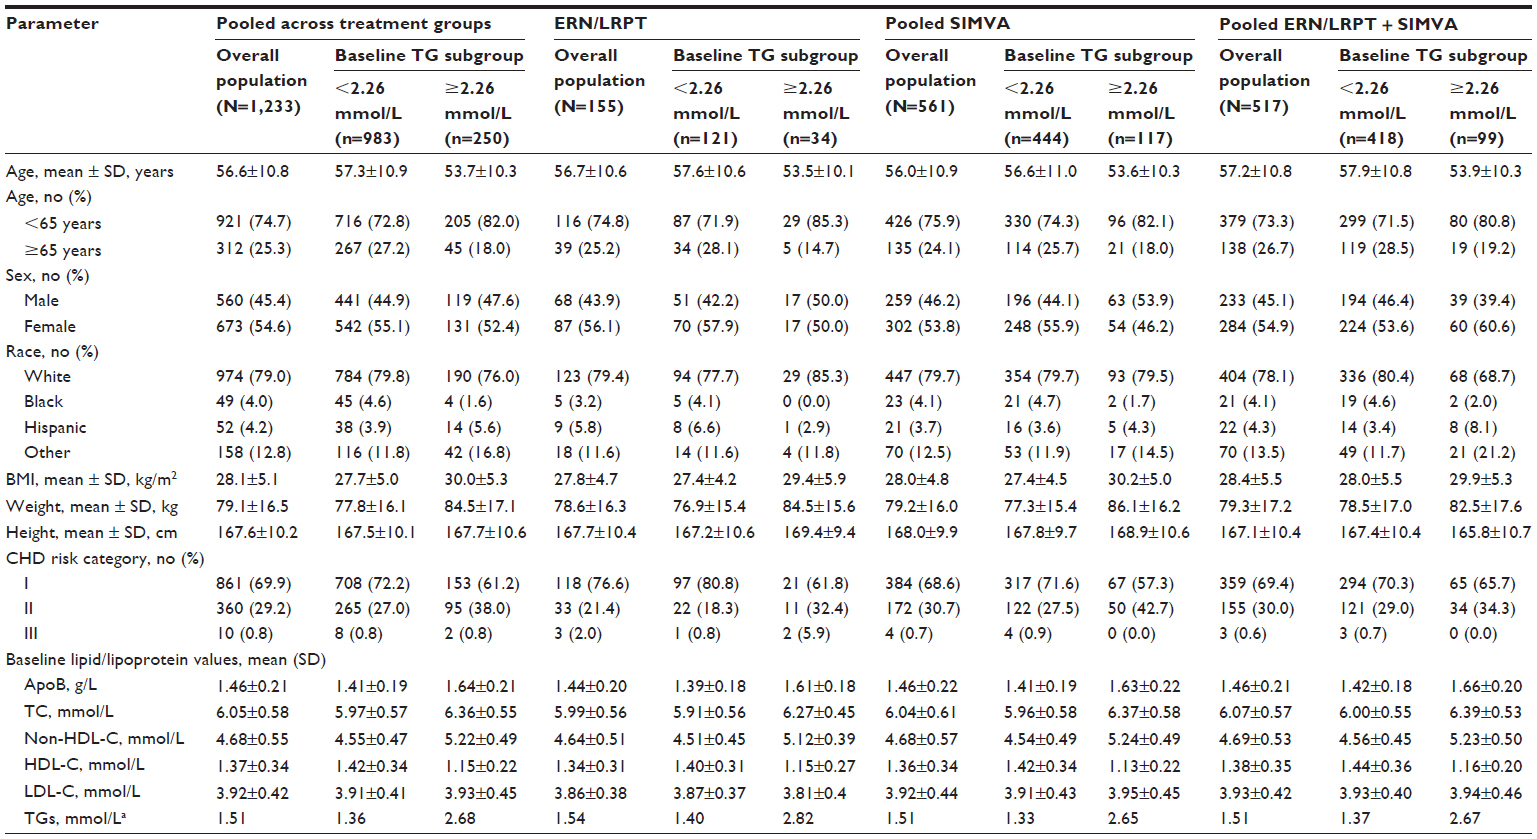 | Table 1 Baseline characteristics by pooled treatment group for the overall population and patient subgroups defined by baseline TGs <2.26 and ≥2.26 mmol/L |
Lipid/lipoprotein analyses
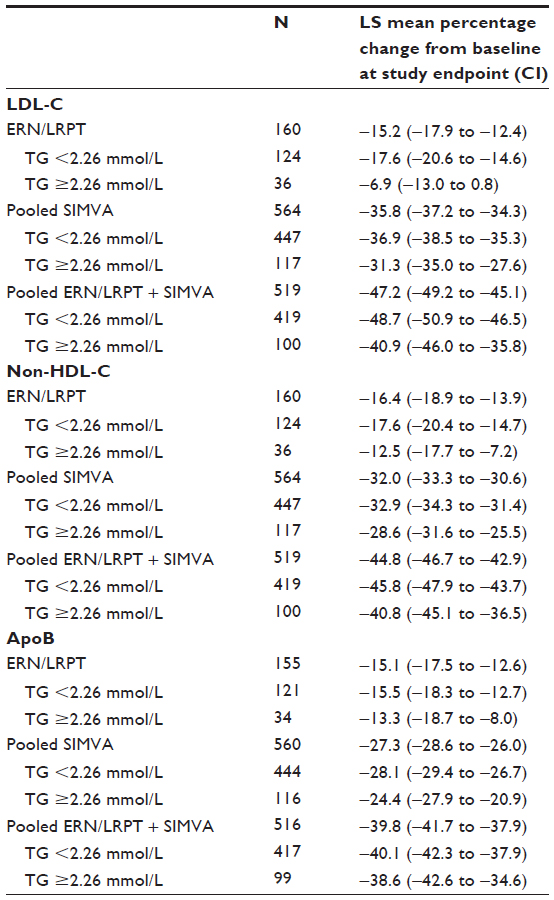
Treatment with ERN/LRPT + SIMVA produced significantly larger LS mean percentage reductions in LDL-C, non-HDL-C, and apoB compared with ERN/LRPT alone and SIMVA alone (Figure 1). Incrementally larger reductions of approximately 11%, 13%, and 13% were observed for LDL-C, non-HDL-C, and apoB, respectively, for ERN/LRPT + SIMVA versus pooled SIMVA alone. This corresponded well with the observed reductions from baseline in LDL-C, non-HDL-C, and apoB of approximately 15.2% (95% CI: −17.9 to −12.4), 16.4% (95% CI: −18.9 to −13.9), and 15.1% (95% CI: −17.5 to −12.6), respectively, following treatment with ERN/LRPT alone. The within-group treatment effects examined by each SIMVA dose were consistent with that observed for the pooled treatment groups (data not shown). The magnitude of the effects of SIMVA alone and ERN/LRPT + SIMVA on apoB were smaller compared with those seen for LDL-C and non-HDL-C, whereas treatment with ERN/LRPT produced similar magnitude reductions in all three of these lipid/lipoprotein parameters.
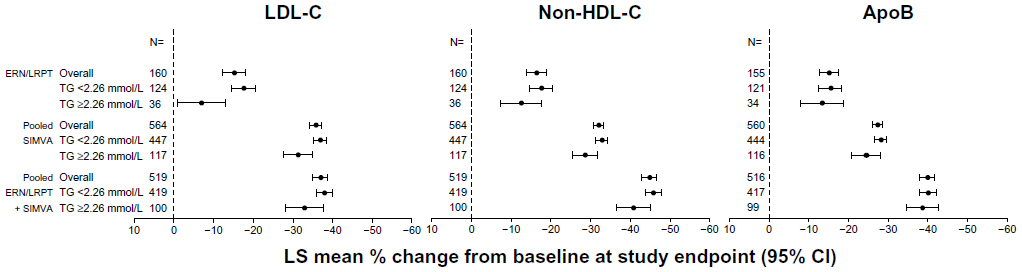 | Figure 1 Percentage change from baseline in LDL-C, non-HDL-C, and apoB in the overall treatment groups and defined by baseline TG <2.26 and ≥2.26 mmol/L. |
The reductions from baseline in LDL-C, non-HDL-C, and apoB with ERN/LRPT alone, SIMVA alone, and ERN/LRPT + SIMVA were numerically higher in the low versus high TG subgroup (Figure 1 and Table S1). The within-group treatment effects examined by each SIMVA dose were consistent with that observed for the pooled treatment groups (data not shown). The effect of baseline TG on LDL-C appeared to reach significance (ie, the 95% CIs for the point estimates did not overlap for the two subgroups) in the ERN/LRPT alone group, and approached significance in the pooled SIMVA alone and pooled ERN/LRPT + SIMVA groups. By comparison, the baseline TG effect on LDL-C did not reach significance in the individual SIMVA and ERN/LRPT + SIMVA groups when the treatment responses were examined by dose (data not shown). In addition, baseline TGs had a less pronounced influence on apoB relative to LDL-C and non-HDL-C across all treatments.
Correlation analysis
At baseline (ie, week 0) in untreated patients, the Pearson correlation coefficients and the predicted LDL-C and non-HDL-C values for a known apoB level were generally similar across the treatment groups (Tables 2 and 3). The only exception was the less positive (ie, weaker) correlation between apoB:LDL-C at baseline in the ERN/LRPT group, which may be due in part to the small number of patients in that group (n=155).
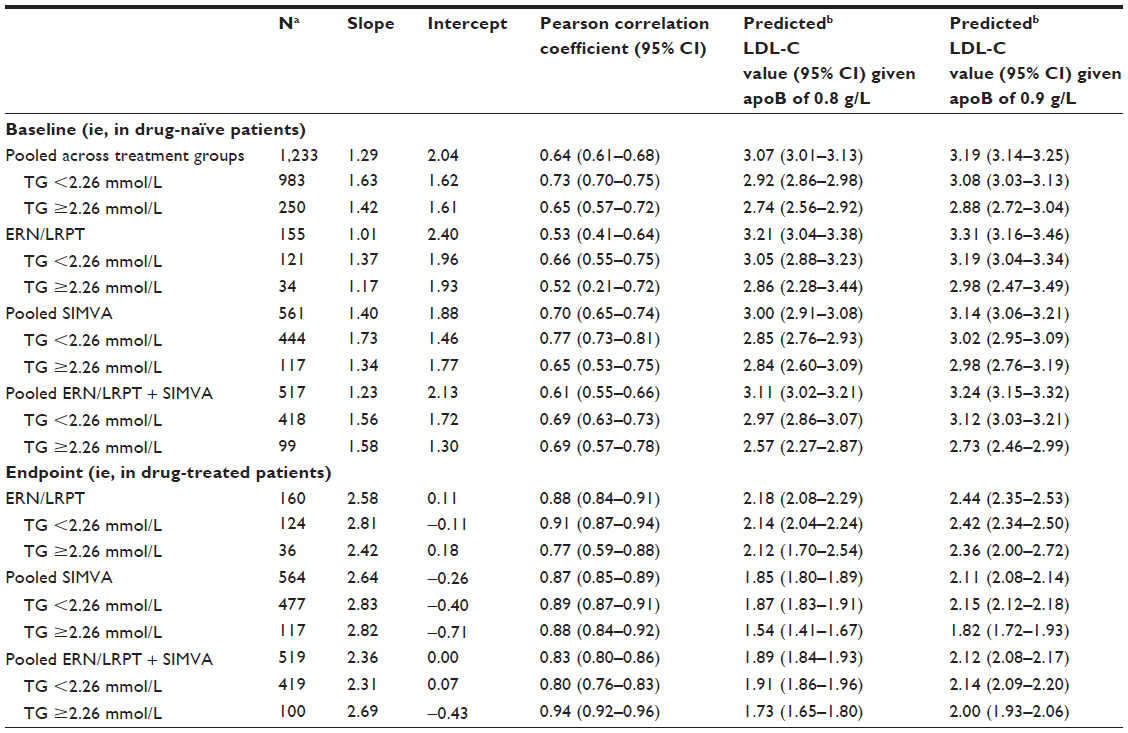 | Table 2 Slope, intercept, Pearson correlation coefficient, and predicted LDL-C values based on simple linear regression of LDL-C on apoB at baseline (ie, in drug-naïve patients) and endpoint (ie, last post-baseline on-treatment measurement) |
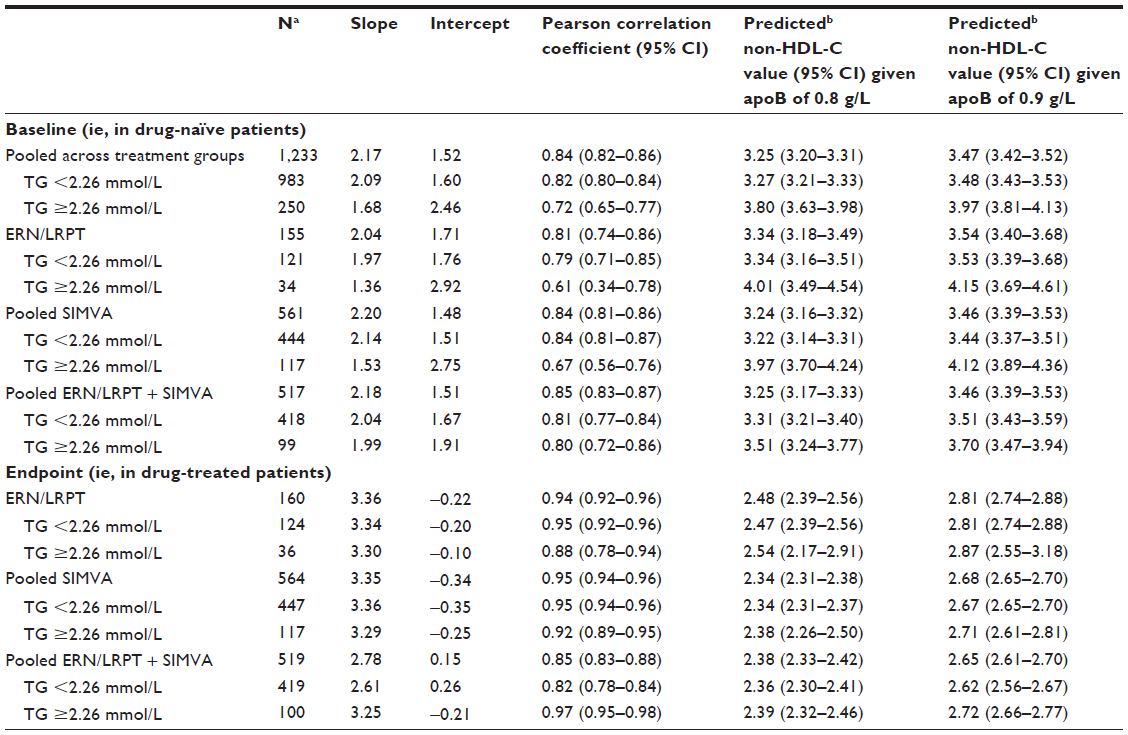 | Table 3 Slope, intercept, Pearson correlation coefficient, and predicted non-HDL-C values based on simple linear regression of non-HDL-C on apoB at baseline (ie, in drug-naïve patients) and endpoint (ie, last post-baseline on-treatment measurement) |
Strong positive correlations between apoB:LDL-C and apoB:non-HDL-C were observed at baseline and at endpoint for all treatment groups (Tables 2 and 3; Figures 2 and 3). Compared with LDL-C, non-HDL-C was more strongly correlated with apoB at baseline and endpoint. In general, treatment with ERN/LRPT alone, pooled SIMVA alone, and pooled ERN/LRPT + SIMVA increased the strengths of the correlations between apoB:LDL-C and apoB:non-HDL-C at endpoint versus baseline (Tables 2 and 3).
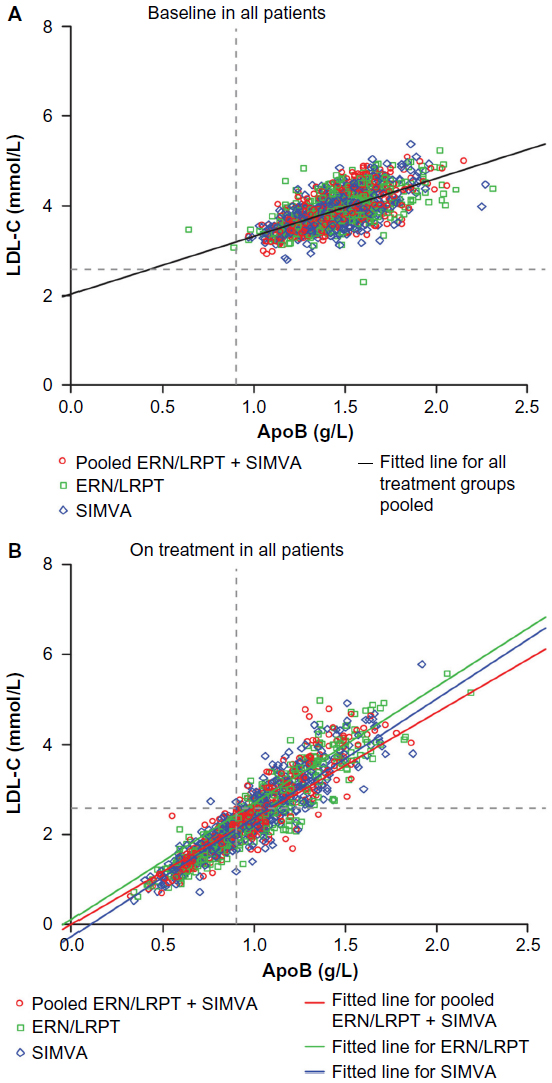 | Figure 2 Scatterplots of apoB versus LDL-C at baseline (A) and following treatment with ERN/LRPT, pooled SIMVA, or pooled ERN/LRPT + SIMVA (B). The upper thresholds for the less-stringent LDL-C <2.59 mmol/L and apoB <0.9 g/L goals are denoted by horizontal and vertical lines, respectively. Right lower quadrant in Figure 2B shows the subjects who met LDL-C goal <2.59 mmol/L but did not reach apoB goal <0.9 g/L after treatment. |
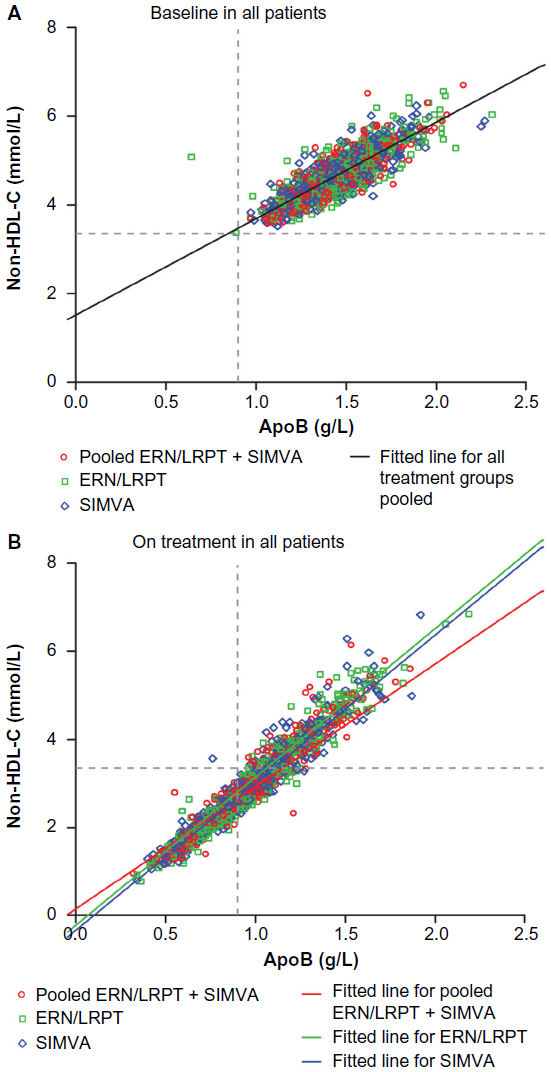 | Figure 3 Scatterplots of apoB versus non-HDL-C at baseline (A) and following treatment with ERN/LRPT, pooled SIMVA, or pooled ERN/LRPT + SIMVA (B). The upper thresholds for the less-stringent non-HDL-C <3.36 mmol/L and apoB <0.9 g/L goals are denoted by horizontal and vertical lines, respectively. Right lower quadrant in Figure 3B shows the subjects who met non-HDL-C goal <3.36 mmol/L but did not reach apoB goal <0.9 g/L after treatment. |
When the correlation coefficients were examined by baseline TGs, the strengths of the correlations between apoB:LDL-C and apoB:non-HDL-C were generally stronger or at least comparable in the subgroup of patients with TG <2.26 mmol/L versus ≥2.26 mmol/L, both before and after treatment (Tables 2 and 3).
Linear regression analyses
The predicted LDL-C and non-HDL-C values for known apoB values of 0.8 and 0.9 g/L in untreated patients at baseline and in the ERN/LRPT alone, pooled SIMVA alone, and pooled ERN/LRPT + SIMVA groups at endpoint are presented in Tables 2 and 3. The finding of lower predicted LDL-C and non-HDL-C values for a known apoB value at study endpoint (ie, on-treatment) versus baseline (ie, drug naïve) was consistently observed across each of the treatment groups, irrespective of the mechanism of action employed by the lipid-lowering treatment. There was no evidence of a trend toward lower predicted LDL-C and non-HDL-C values with increased SIMVA dose in either the SIMVA alone or ERN/LRPT + SIMVA groups (data not shown). Compared with the SIMVA alone and ERN/LRPT + SIMVA groups, smaller reductions in the predicted LDL-C values for a known apoB value were observed following treatment with ERN/LRPT alone at endpoint relative to baseline (Table 2). In contrast, the predicted non-HDL-C levels corresponding to a known apoB value were generally consistent across the treatment groups, including ERN/LRPT alone, at endpoint (Table 3).
When the regression analyses were examined by baseline TG, the predicted LDL-C values were generally lower in the high TG versus the low TG subgroup, both at baseline and study endpoint across the treatment groups (Table 2). In contrast, the predicted non-HDL-C values were generally higher in the high TG versus low TG subgroup at baseline, but were generally comparable between the TG subgroups following treatment with ERN/LRPT alone, SIMVA alone, and ERN/LRPT + SIMVA at study endpoint (Table 3).
Concordance analysis
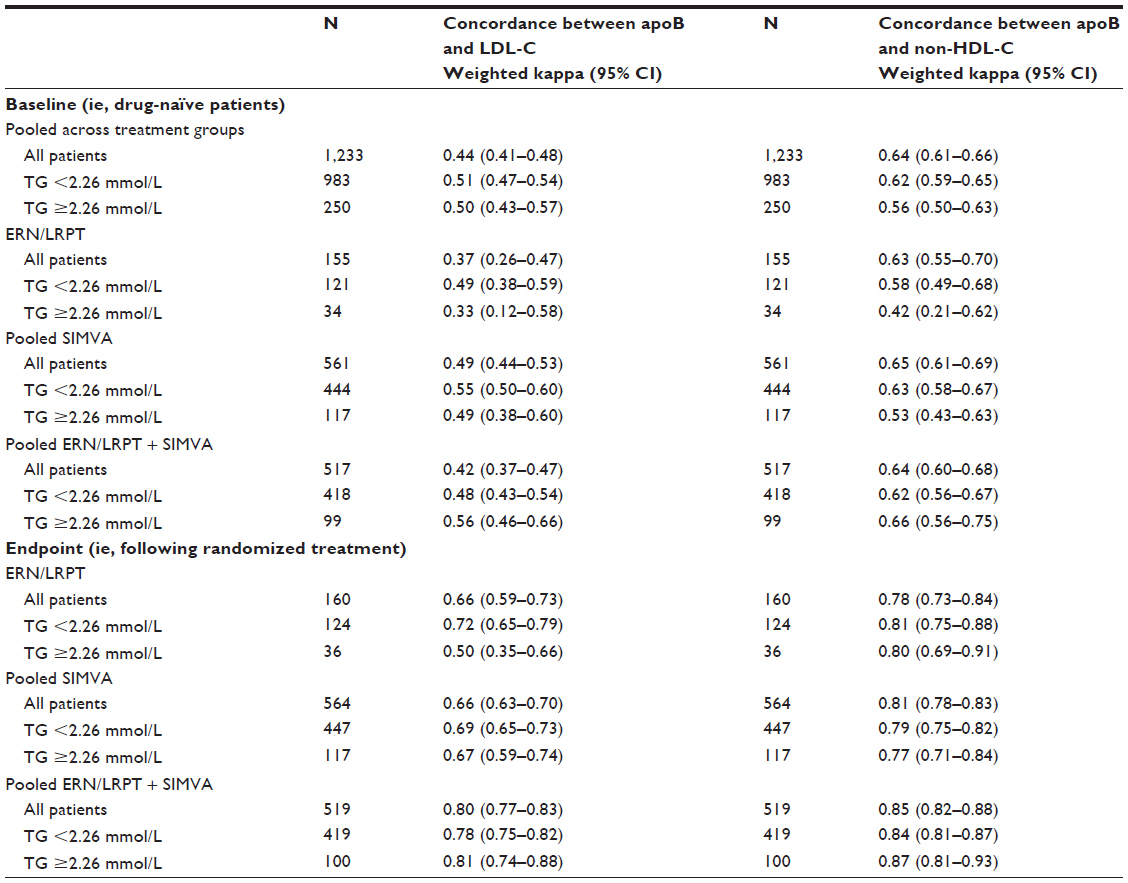
Weighted kappa statistics were used to assess the degree of concordance between apoB and LDL-C or non-HDL-C before and after treatment with ERN/LRPT alone, SIMVA alone, and ERN/LRPT + SIMVA (Table S2). A kappa value of 1 represents perfect overlap between two parameters, whereas a value of 0 represents a complete absence of overlap between two parameters. For apoB:LDL-C and apoB:non-HDL-C, the weighted kappa values were generally similar across the treatment groups and TG subgroups in untreated patients at baseline. For all treatments and both TG subgroups, the weighted kappa values were highest for the apoB:non-HDL-C versus the apoB:LDL-C comparisons both at baseline and endpoint. The degree of concordance between apoB:LDL-C was generally fair to moderate at baseline, whereas a more substantial level of concordance was seen between apoB:non-HDL-C at baseline. Treatment with ERN/LRPT alone, SIMVA alone, and ERN/LRPT + SIMVA improved the level of concordance between apoB:LDL-C and apoB:non-HDL-C relative to baseline. At study endpoint, the concordance between both apoB:LDL-C and apoB:non-HDL-C were less well improved following treatment with ERN/LRPT alone and SIMVA alone versus ERN/LRPT + SIMVA.
Discussion
Prior studies have examined the influence of various lipid-altering therapies on the relationships between apoB:LDL-C and apoB:non-HDL-C in dyslipidemic patients before (ie, in drug naïve) and after treatment.20–24 To our knowledge, the potential influence of ERN on the relationships between these lipid/lipoprotein parameters has not been examined. This post-hoc analysis of a previously published study evaluated the relationships (ie, correlations, linear regression analyses, and concordance) between apoB:LDL-C and apoB:non-HDL-C in a mixed population of patients with primary hypercholesterolemia or mixed dyslipidemia, in the untreated state (ie, at baseline following a drug washout period) and following treatment with ERN/LRPT alone, SIMVA alone, or ERN/LRPT + SIMVA for up to 8 weeks.
Statin monotherapy has been shown to produce smaller reductions in apoB relative to reductions in LDL-C and non-HDL-C,12,20 and the present results confirm this finding. A similar trend toward smaller reductions in apoB compared with LDL-C and non-HDL-C were observed following treatment with ERN/LRPT + SIMVA combination therapy. In contrast, patients receiving ERN/LRPT alone had similar magnitude reductions in apoB, LDL-C, and non-HDL-C. This finding supports prior study results, showing treatment with ERN/LRPT and ERN alone (without LRPT) produces equipotent reductions in apoB, LDL-C, and non-HDL-C.29 The different magnitude of reductions in these parameters between statins and ERN in this and prior studies is likely due to differences in the mechanisms of actions of these agents.
The correlation coefficients between apoB:LDL-C and apoB:non-HDL-C observed at baseline were similar to those observed in previous studies specifically conducted in drug-naïve patients with primary hypercholesterolemia or mixed dyslipidemia.20–24 However, unlike previous studies which demonstrated trends toward stronger apoB:LDL-C and apoB:non-HDL-C correlations with increasing potencies of lipid-lowering drugs (eg, switching from a lower to a higher potency statin, increasing the statin dose, or adding fenofibrate or ezetimibe to statin therapy), no evidence of such a trend was noted in the present analysis. Treatment with ERN/LRPT increased the correlation coefficients between apoB:LDL-C and apoB:non-HDL-C. Except for a finding of stronger correlations between apoB:LDL-C and apoB:non-HDL-C in the ERN/LRPT + SIMVA group among patients with TG ≥2.26 mmol/L versus <2.26 mmol/L, the strengths of the correlations between apoB:LDL-C and apoB:non-HDL-C were generally stronger (or at least similar) in the low versus the high TG subgroup, both before and after treatment.
This analysis demonstrated strong, linear relationships between apoB:LDL-C and apoB:non-HDL-C, both at baseline (ie, following the drug washout phase) and following treatment with ERN/LRPT alone, SIMVA alone, and ERN/LRPT + SIMVA. Following treatment, the predicted LDL-C and non-HDL-C levels corresponding to apoB values of 0.8 and 0.9 g/L were considerably lower compared with baseline. When examined by baseline TG subgroup, the predicted LDL-C values were generally lower in the high TG versus the low TG subgroup, both at baseline and study endpoint across the treatment groups. Conversely, the predicted non-HDL-C values were generally higher in the high TG versus low TG subgroup at baseline, but this finding was less pronounced at study endpoint.
ApoB appeared to be more concordant with non-HDL-C than with LDL-C, both at baseline in untreated patients and study endpoint, irrespective of the treatment administered (ie, ERN/LRPT alone, SIMVA alone, and ERN/LRPT + SIMVA) or TG subgroup. At baseline, the concordance between apoB and LDL-C was moderate, whereas a substantial level of concordance between apoB and non-HDL-C was observed. Treatment with ERN/LRPT alone and SIMVA alone had modest effects on the concordance between apoB and LDL-C and apoB and non-HDL-C, whereas ERN/LRPT + SIMVA improved the concordance between both apoB and LDL-C and apoB and non-HDL-C, with weighted kappa statistics in the substantial to near-perfect range, respectively.
In conclusion, the apoB:LDL-C and apoB:non-HDL-C correlations were higher and the predicted LDL-C and non-HDL-C levels for a known apoB value were considerably lower following treatment with ERN/LRPT, SIMVA, and ERN/LRPT + SIMVA compared with untreated patients at baseline. Taken together, these data suggest that greater dissociation of apoB, LDL-C, and non-HDL-C targets occur following treatment with ERN/LRPT, SIMVA, and ERN/LRPT + SIMVA in patients with dyslipidemia. The achievement of more aggressive LDL-C and non-HDL-C goals in patients receiving lipid-modifying therapy may further reduce coronary risk by normalizing apoB-containing atherogenic lipoproteins.
Acknowledgments
The authors thank Joseph Triscari, PhD, Jennifer Rotonda, PhD, and Kristen Lewis, BA of Merck and Co, Inc., Whitehouse Station, NJ for their assistance reviewing and preparing this manuscript for publication.
Author contributions
All authors were involved in the following: 1) substantial contributions to conception and design, acquisition of data, or analysis and interpretation of data; 2) drafting of article or revising it critically for important intellectual content; 3) final approval of the version to be published; and 4) agreement to be accountable for all aspects of the work in ensuring that questions related to the accuracy or integrity of any part of the work are appropriately investigated and resolved.
Funding
Funding for this study was provided by Merck Sharp & Dohme Corp., a subsidiary of Merck & Co., Inc., Whitehouse Station, NJ, USA.
Disclosure
M Farnier reports having received grants, consulting fees, and/or honoraria and delivering lectures for Abbott, Amgen, Boehringer-Ingelheim, Genzyme, Kowa, Merck and Co, Novartis, Pfizer, Recordati, Roche, Sanofi-Aventis, and SMB. E Chen, AO Johnson-Levonas, C McCrary Sisk, and YB Mitchel are employees of Merck Sharp & Dohme Corp., a subsidiary of Merck & Co., Inc., and hold stock/stock options in the company. M Farnier, E Chen, AO Johnson-Levonas, C McCrary Sisk, and YB Mitchel are responsible for the work described in this paper.
References
National Cholesterol Education Program (NCEP) Expert Panel on Detection, Evaluation, and Treatment of High Blood Cholesterol in Adults (Adult Treatment Panel III). Third Report of the National Cholesterol Education Program (NCEP) Expert Panel on Detection, Evaluation, and Treatment of High Blood Cholesterol in Adults (Adult Treatment Panel III) final report. Circulation. 2002;106:3143–3421. | |
Stone NJ, Robinson J, Lichtenstein AH, et al. 2013 ACC/AHA Guideline on the Treatment of Blood Cholesterol to Reduce Atherosclerotic Cardiovascular Risk in Adults: a report of the American College of Cardiology/American Heart Association Task Force on practice guidelines. J Am Coll Cardiol. Epub November 7, 2013. | |
Brunzell JD, Davidson M, Furberg CD, et al. Lipoprotein management in patients with cardiometabolic risk: consensus statement from the American Diabetes Association and the American College of Cardiology Foundation. Diabetes Care. 2008;31:811–822. | |
Davidson MH, Ballantyne CM, Jacobson TA, et al. Clinical utility of inflammatory markers and advanced lipoprotein testing: advice from an expert panel of lipid specialists. J Clin Lipidol. 2011;5:338–367. | |
Genest J, McPherson R, Frohlich J, et al. 2009 Canadian Cardiovascular Society/Canadian guidelines for the diagnosis and treatment of dyslipidemia and prevention of cardiovascular disease in the adult – 2009 recommendations. Can J Cardiol. 2009;25:567–579. | |
Catapano AL, Reiner Ž, De Backer G, et al. ESC/EAS guidelines for the management of dyslipidaemias: the task force for the management of dyslipidaemias of the European Society of Cardiology (ESC) and the European Atherosclerosis Society (EAS). Atherosclerosis. 2011;217:1–44. | |
Boekholdt SM, Arsenault BJ, Mora S, et al. Association of LDL cholesterol, non-HDL cholesterol, and apolipoprotein B levels with risk of cardiovascular events among patients treated with statins: a meta-analysis. JAMA. 2012;307:1302–1309. | |
Ingelsson E, Schaefer EJ, Contois JH, et al. Clinical utility of different lipid measures for prediction of coronary heart disease in men and women. JAMA. 2007;298:776–785. | |
Liu J, Sempos CT, Donahue RP, Dorn J, Trevisan M, Grundy SM. Non-high-density lipoprotein and very-low-density lipoprotein cholesterol and their risk predictive values in coronary heart disease. Am J Cardiol. 2006;98:1363–1368. | |
Pischon T, Girman CJ, Sacks FM, Rifai N, Stampfer MJ, Rimm EB. Non-high-density lipoprotein cholesterol and apolipoprotein B in the prediction of coronary heart disease in men. Circulation. 2005;112:3375–3383. | |
Robinson JG, Wang S, Smith BJ, Jacobson TA. Meta-analysis of the relationship between non-high-density lipoprotein cholesterol reduction and coronary heart disease risk. J Am Coll Cardiol. 2009;53:316–322. | |
Sniderman AD, Williams K, Contois JH, et al. A meta-analysis of low-density lipoprotein cholesterol, non-high-density lipoprotein cholesterol, and apolipoprotein B as markers of cardiovascular risk. Circ Cardiovasc Qual Outcomes. 2011;4:337–345. | |
Davidson MH. Reducing residual risk for patients on statin therapy: the potential role of combination therapy. Am J Cardiol. 2005;96:3K–13K. | |
Guyton JR, Goldberg AC, Kreisberg RA, Sprecher DL, Superko R, O’Connor CM. Effectiveness of once-nightly dosing of extended-release niacin alone and in combination for hypercholesterolemia. Am J Cardiol. 1998;82:737–743. | |
The Coronary Drug Project Research Group. Clofibrate and niacin in coronary heart disease. JAMA. 1975;231:360–381. | |
Brown BG, Zhao X-Q, Chait A, et al. Simvastatin and niacin, antioxidant vitamins, or the combination for the prevention of coronary disease. N Engl J Med. 2001;345:1583–1592. | |
Taylor AJ, Sullenberger LE, Lee HJ, Lee JK, Grace KA. Arterial biology for the investigation of the treatment effects of reducing cholesterol (ARBITER) 2. A double-blind, placebo-controlled study of extended-release niacin on atherosclerosis progression in secondary prevention patients treated with statins. Circulation. 2004;110:3512–3517. | |
The AIM-HIGH Investigators. Niacin in patients with low HDL cholesterol levels receiving intensive statin therapy. N Engl J Med. 2011;365:2255–2267. | |
HPS2-THRIVE Collaborative Group. HPS2-THRIVE randomized placebo-controlled trial in 25 673 high-risk patients of ER niacin/laropiprant: trial design, pre-specified muscle and liver outcomes, and reasons for stopping study treatment. Eur Heart J. 2013;34:1279–1291. | |
Ballantyne CM, Andrews TC, Hsia JA, Kramer JH, Shear C. Correlation of non-high-density lipoprotein cholesterol with apolipoprotein B: effect of 5 hydroxymethylglutaryl coenzyme A reductase inhibitors on non-high-density lipoprotein cholesterol levels. Am J Cardiol. 2001;88:265–269. | |
Ballantyne CM, Raichlen JS, Cain VA. Statin therapy alters the relationship between apolipoprotein B and low-density lipoprotein cholesterol and non-high-density lipoprotein cholesterol targets in high-risk patients: the MERCURY II (Measuring Effective Reductions in Cholesterol Using Rosuvastatin) trial. J Am Coll Cardiol. 2008;52:626–632. | |
Charlton-Menys V, Betteridge DJ, Colhoun H, et al. Targets of statin therapy: LDL cholesterol, non-HDL cholesterol, and apolipoprotein B in type 2 diabetes in the Collaborative Atorvastatin Diabetes Study (CARDS). Clin Chem. 2009;55:473–480. | |
Idris I, Tate H, Ahmad A, McCormack T. Concordance between plasma apolipoprotein B levels and cholesterol indices among patients receiving statins and nonstatin treatment: post-hoc analyses from the UK InPractice study. J Clin Lipidol. 2011;5:316–323. | |
Grundy SM, Vega GL, Tomassini JE, Tershakovec AM. Correlation of non-high-density lipoprotein cholesterol and low-density lipoprotein cholesterol with apolipoprotein B during simvastatin + fenofibrate therapy in patients with combined hyperlipidemia (a subanalysis of the SAFARI trial). Am J Cardiol. 2009;104:548–553. | |
Farnier M, Taggart W, Dong Q, Lin J, Shah A, Brudi P. Influence of simvastatin, fenofibrate and/or ezetimibe on correlation of LDL and non-HDL cholesterol with apolipoprotein B in mixed dyslipidemic patients. J Clin Lipidol. 2011;5:179–187. | |
Farnier M, Guyton JR, Jensen E, Polis AB, Johnson-Levonas AO, Brudi P. Effects of Ezetimibe, simvastatin and ezetimibe/simvastatin on correlations between apolipoprotein B, LDL cholesterol and non HDL cholesterol in patients with primary hypercholesterolemia. Atherosclerosis. 2013;229:415–422. | |
Gleim G, Ballantyne CM, Liu N, et al. Efficacy and safety profile of co-administered ER niacin/laropiprant and simvastatin in dyslipidaemia. Br J Cardiol. 2009;16:90–97. | |
Friedewald WT, Levy RI, Fredrickson DS. Estimation of the concentration of low-density lipoprotein cholesterol in plasma, without use of the preparative ultracentrifuge. Clin Chem. 1972;18:499–502. | |
Maccubbin D, Bays HE, Olsson AG, et al. Lipid-modifying efficacy and tolerability of extended release niacin/laropiprant in patients with primary hypercholesterolaemia or mixed dyslipidaemia. Int J Clin Pract. 2008;62:1959–1970. |
Supplementary materials
 | Table S1 Analysis of percentage change from baseline at study endpoint (ie, last post-week 6 measurement) in LDL-C, non-HDL-C, and apoB in the pooled treatment groups for the overall population and patient subgroups defined by baseline TG <2.26 and ≥2.26 mmol/L |
 | Table S2 Degree of concordance among apoB, LDL-C, and non-HDL-C levels at baseline and study endpoint in the pooled treatment groups for the overall population and patient subgroups defined by baseline TG <2.26 and ≥2.26 mmol/L |
 © 2014 The Author(s). This work is published and licensed by Dove Medical Press Limited. The full terms of this license are available at https://www.dovepress.com/terms.php and incorporate the Creative Commons Attribution - Non Commercial (unported, v3.0) License.
By accessing the work you hereby accept the Terms. Non-commercial uses of the work are permitted without any further permission from Dove Medical Press Limited, provided the work is properly attributed. For permission for commercial use of this work, please see paragraphs 4.2 and 5 of our Terms.
© 2014 The Author(s). This work is published and licensed by Dove Medical Press Limited. The full terms of this license are available at https://www.dovepress.com/terms.php and incorporate the Creative Commons Attribution - Non Commercial (unported, v3.0) License.
By accessing the work you hereby accept the Terms. Non-commercial uses of the work are permitted without any further permission from Dove Medical Press Limited, provided the work is properly attributed. For permission for commercial use of this work, please see paragraphs 4.2 and 5 of our Terms.