")
Back to Journals » International Journal of Nanomedicine » Volume 10 » Issue 1
Effects of a micro/nano rough strontium-loaded surface on osseointegration
Authors Li Y, Qi Y, Gao Q, Niu Q, Shen M, Fu Q, Hu K, Kong L
Received 11 March 2015
Accepted for publication 17 May 2015
Published 16 July 2015 Volume 2015:10(1) Pages 4549—4563
DOI https://doi.org/10.2147/IJN.S84398
Checked for plagiarism Yes
Review by Single anonymous peer review
Peer reviewer comments 6
Editor who approved publication: Professor Lei Yang
Yongfeng Li,1,* Yaping Qi,2,* Qi Gao,3,* Qiang Niu,1 Mingming Shen,2 Qian Fu,1 Kaijin Hu,1 Liang Kong1
1State Key Laboratory of Military Stomatology, Department of Oral and Maxillofacial Surgery, School of Stomatology, the Fourth Military Medical University, Xi’an, 2Department of Oral and Maxillofacial Surgery, School of Stomatology, the Second Hospital of Hebei Medical University, Shijiazhuang, 3Department of Stomatology, PLA 458 Hospital, Guangzhou, People’s Republic of China
*These authors contributed equally to this work
Abstract: We developed a hierarchical hybrid micro/nanorough strontium-loaded Ti (MNT-Sr) surface fabricated through hydrofluoric acid etching followed by magnetron sputtering and evaluated the effects of this surface on osseointegration. Samples with a smooth Ti (ST) surface, micro Ti (MT) surface treated with hydrofluoric acid etching, and strontium-loaded nano Ti (NT-Sr) surface treated with SrTiO3 target deposited via magnetron sputtering technique were investigated in parallel for comparison. The results showed that MNT-Sr surfaces were prepared successfully and with high interface bonding strength. Moreover, slow Sr release could be detected when the MNT-Sr and NT-Sr samples were immersed in phosphate-buffered saline. In in vitro experiments, the MNT-Sr surface significantly improved the proliferation and differentiation of osteoblasts compared with the other three groups. Twelve weeks after the four different surface implants were inserted into the distal femurs of 40 rats, the bone–implant contact in the ST, MT, NT-Sr, and MNT-Sr groups were 39.70%±6.00%, 57.60%±7.79%, 46.10%±5.51%, and 70.38%±8.61%, respectively. In terms of the mineral apposition ratio, the MNT-Sr group increased by 129%, 58%, and 25% compared with the values of the ST, MT, and NT-Sr groups, respectively. Moreover, the maximal pullout force in the MNT-Sr group was 1.12-, 0.31-, and 0.69-fold higher than the values of the ST, MT, and NT-Sr groups, respectively. These results suggested that the MNT-Sr surface has a synergistic effect of hierarchical micro/nano-topography and strontium for enhanced osseointegration, and it may be a promising option for clinical use. Compared with the MT surface, the NT-Sr surface significantly improved the differentiation of osteoblasts in vitro. In the in vivo animal experiment, the MT surface significantly enhanced the bone-implant contact and maximal pullout force than the NT-Sr surface.
Keywords: surface modification, micro/nanorough, implant
Introduction
It is estimated that approximately 10 million dental implants were inserted annually over the past few decades.1 Among the various types of implants, titanium implants have earned the approval of both patients and clinicians because of their favorable biological properties. The clinical success of titanium implants is mainly attributed to their osseointegration, which is defined as a direct contact between living bone and implants at the light-microscopic level.2 Researchers have made many attempts to enhance osseointegration, including surgical technique improvement, longer healing period, and surface modification; among them, surface modification has been studied with increasing interest by many researchers.3,4
Numerous studies have reported that surface characteristics such as roughness and chemistry are crucial for the short- and long-term success of dental implants.5 Depending on the scale of the features, the surface roughness of implants can be divided into three types: macro-, micro-, and nano-sized topologies. It has been suggested that macro and micro surfaces can promote bone–implant integration mainly by maximizing mechanical interlocking,6 while the roughness in nano-sized topography may stimulate osseointegration by affecting chemical reactivity and altering biomolecular interactions between the implants and surrounding bones.7 Although many studies have demonstrated that osseointegration can be promoted by both nano- and microscale topography independently via different mechanisms, a perspective that has been gaining increasing acceptance by many researchers is that the bioactivity of nanoscale topography is based on the initial clinical stability provided by microscale topography and overall implant design.8 Therefore, the roughness in hierarchical micro/nano-topography is a promising factor to enhance osseointegration.
Modification of the chemistry of titanium implants is another important approach to accelerate osseointegration. Several studies have demonstrated the potential application value of hydroxyapatite coatings with favorable mechanical compatibility.9–11 Owing to the similar biological function with calcium,12 strontium has been introduced in practice to improve the osseointegration of implants13–15 owing to its dual effects of promoting bone formation and reducing bone resorption.16 In addition to the systemic application of strontium, the local application of strontium is an alternative method to enhance implant osseointegration. Local application can avoid the potential adverse reactions, such as toxic epidermal necrolysis, drug rash with eosinophilia, and systemic symptoms syndrome.17 Thus, strontium surface coating has been of increasing interest as a method for modification of chemistry to promote osseointegration.
By considering the above information, we attempted to combine the advantages of roughness in micro/nanoscale and modification of chemistry with strontium loading to promote osseointegration. Therefore, we developed implants with a hierarchical micro/nano-topography loaded with strontium, which were treated with hydrofluoric (HF) acid etching to form the micro surface and later combined with magnetron sputtering to form the nanoscale strontium coating. Numerous reports have demonstrated that the roughness and chemistry of implant surfaces are important factors for improving osseointegration.18–20 However, few studies have compared the role of the two factors in osseointegration. In this study, we prepared four surfaces that differ in roughness and chemistry and compared the effects of these surfaces on osseointegration via an in vitro cellular study and in vivo animal experiment. Furthermore, we also attempted to evaluate the bioactivity of the micro/nano Sr-loaded surface developed using HF etching combined with magnetron sputtering.
Materials and methods
Sample preparation and characterization
A total of 318 Ti disks (Φ15 mm ×1 mm) and 80 Ti screws (Φ1.5 mm ×3 mm) (99.99% pure; Zhong Bang Corporation, Xi’an, People’s Republic of China) were divided into four groups: smooth Ti (ST) surface, which is polished Ti without further treatment; micro-textured Ti (MT) surface formed by treatment in 0.5% (w/v) HF for 30 minutes; Sr-loaded nano-textured Ti (NT-Sr) formed by magnetron sputtering; and Sr-loaded micro/nano-textured Ti (MNT-Sr) fabricated by HF etching combined with magnetron sputtering. Magnetron sputtering was performed with an industrial physical vapor deposition system (SKY Technology Development Co. Ltd, Shenyang, People’s Republic of China), with material deposited from a sputtering target consisting of SrTiO3 powder with a purity of 99.99% (HuiFangYuan Science and Technology Co. Ltd, Beijing, People’s Republic of China). The films were deposited under the following conditions: Ar2 with 0.5 Pa gas composition, 80 W power density, 7,200-second deposition time, and 10 cm target–substrate distance. After preparation, all the Ti disks were ultrasonically cleaned with acetone, ethanol, and deionized water, sequentially, and then sterilized with the cobalt-60 irradiation. The Ti samples were characterized using field-emission scanning electron microscopy (FE-SEM) (Hitachi S-4800), atomic force microscopy (AFM) (Innova; Vecco Instrument), X-ray diffraction (XRD) (Philips X’ Pert Pro) with Cu Ka radiation, and X-ray photoelectron spectroscopy (XPS) (ESCALB MKII). The interface bonding strength of Sr-loaded layers were evaluated by epoxy resin docking tensile test. The surface hydrophilicity of the Ti samples was measured using a surface–contact angle machine (DSA30; Kruss, Germany).
Sr release determination
The Sr-loaded samples were immersed in 5 mL phosphate-buffered saline (PBS) (Thermo Fisher Scientific, Waltham, MA, USA) at 37°C. The entire volume of PBS was collected using a pipette and replaced with fresh PBS after 1, 4, 7, and 14 days. The PBS containing released Sr was analyzed using inductively coupled plasma atomic emission spectrometry (ICP-AES) (IRIS Advantage ER/S). The Sr-containing layers on the Ti surfaces were completely dissolved in the HF and HNO3 mixture when ultrasonically treated at room temperature. The total amounts of Sr were determined by ICP-AES.
Cell culture
The murine osteoblast cell line MC3T3-E1 was used for the in vitro assay. The cells were cultured in α minimum essential medium (Thermo Fisher Scientific) containing 10% fetal calf serum (Thermo Fisher Scientific) at 37°C with the medium changed every 3 days. The Ti samples were placed in a 24-well plate (Costar), and the cells were seeded with a density of 2×10⁴ cells/mL for the assays, unless otherwise mentioned.
Cell adhesion
After incubation for 30, 60, and 120 minutes, the attached cells were stained using 4′,6′-diamidino-2-phenylindole (DAPI) (Sigma-Aldrich Co., St Louis, MO, USA). Positive cells were counted under an optical microscope (Olympus FluoView FV1000) in five randomly selected fields with ×10 magnification.
Cell proliferation
After culturing for 1, 4, and 7 days, the cell proliferation was assessed using 3-(4,5-dimethylthiazol-2-yl)-2,5-diphenyltetrazolium bromide (MTT) (Sigma-Aldrich Co.) assay. In brief, at prescribed time points, the Ti samples were gently rinsed thrice with PBS and transferred to a new plate. The Ti samples were then incubated with the MTT solution at 37°C for 4 hours to form formazan. The formazan was then dissolved in dimethyl sulfoxide, and the optical density was measured at 490 nm using a spectrophotometer (Bio-Tek).
Cell morphology
The cell morphology and details of cell/biomaterial interaction were inspected using FE-SEM and a confocal laser scanning microscope (CLSM) (Olympus FluoView FV1000). After incubation for 3 days, the samples with attached cells were fixed in 3% glutaraldehyde, dehydrated in a graded ethanol series, freeze dried, sputter coated with gold, and observed using FE-SEM.
After culturing for 3 days, the cells on the Ti samples were fixed in 3.7% formaldehyde for 5 minutes and then permeabilized with 0.1% Triton X-100. Subsequently, they were stained with 50 mg/mL fluorescein isothiocyanate (FITC)-labeled phalloidin (green fluorescence) (Sigma-Aldrich Co.) for 40 minutes and then counterstained with DAPI for the cell nuclei (blue fluorescence) (Sigma-Aldrich Co.) for 5 minutes at room temperature in the dark. Finally, the stained cells were inspected with a CLSM.
Alkaline phosphatase activity
After culturing for 7 days, the cells were washed and fixed, and alkaline phosphatase (ALP) staining was performed using a BCIP/NBT ALP color development kit (Beyotime Institute of Biotechnology, Jiangsu, People’s Republic of China) for 30 minutes. A colorimetric assay was used to determine the quantity of ALP present. This assay was based on an ALP reagent containing p-nitrophenyl phosphate (p-NPP) as the substrate.
In vivo experiment
Animals and surgical procedures
All procedures complied with the Guidelines for the Care and Use of Laboratory Animals and the rules of the Animal Research Committee of the Fourth Military Medical University (Xi’an, People’s Republic of China). Forty female Sprague Dawley rats (6 months old, 310±30 g) were included in this study. Eighty implants with 20 for each group were randomly inserted into the distal femurs of 40 rats with one implant for each femur. The operations were performed under general anesthesia through intraperitoneal injection of sodium pentobarbital (40 mg/kg) (Merck Drugs and Biotechnology) with lidocaine hydrochloride for local anesthesia. Postoperatively, 24 mg/kg penicillin was administered for 3 continuous days. Twelve weeks after implantation, the animals were sacrificed, and the femurs with implants were retrieved for micro-computed tomography (micro-CT) scanning, histological analysis, and biomechanical test. In order to evaluate new bone deposition by using fluorescent labeling, tetracycline (25 mg/kg) (Amresco Ltd., USA), and calcein (5 mg/kg) (Sigma-Aldrich Co.) were intraperitoneally injected 3 and 14 days before sacrifice, respectively.
Micro-CT scanning
Before the mechanical test and dehydration for histological analysis, the specimens were first scanned with micro-CT (Y. Cheetah, Y. XLON; 90 kV, 45 μA, 1,000 ms integration time), and the images were reconstructed with an isotropic voxel size of 17 μm. The acquired three-dimensional images were utilized for quantitative evaluation. The region of interest was a ring of radius 0.5 mm from the implant surface. The trabecular thickness (Tb.Th), trabecular number (Tb.N), trabecular separation (Tb.Sp), and bone volume/total volume (BV/TV) were determined.
Histological analysis
Ten samples in each group were maintained in 75% ethanol for 7 days. After dehydration through a graded series of ethanol and 100% acetone, the samples were embedded in polyester resin. We obtained 100 μm-thick undecalcified sections with a sawing microtome (Leica SP 1600; Leica Microsystems, Wetzlar, Germany), and then images were captured using a fluorescence microscope (Leica Microsystems).
After the fluorescence observation, the sections were stained with methylene blue/acid fuchsin and analyzed with a digitized image-analysis system (Leica Microsystems) coupled to a light microscope (Olympus Corporation, Tokyo, Japan) with a high-resolution video camera (CDC/RGB color video camera; Sony) and a Trinitron monitor (Sony). Bone–implant contact (BIC) was calculated as the linear percentage of direct BIC to the total implant interface in the cancellous bone.
Biomechanical test
After the specimen harvest, the ten samples in each group were quickly introduced to the biomechanical pullout test using a universal material testing system (AGS-10KNG; Shimadzu, Kyoto, Japan). The compression speed was set at 2 mm/min. The displacement versus force was recorded to calculate the maximal pullout force.
Statistical analysis
Data were analyzed with the Windows Version 13 Statistical Package for the Social Sciences (SPSS, Inc., Chicago IL, USA). One-way analysis of variance was used for multiple comparisons among the groups. All data were expressed as mean ± standard deviation. Significant differences and highly significant differences were defined as P<0.05 and 0.01, respectively.
Results
Surface characterization of the Ti samples
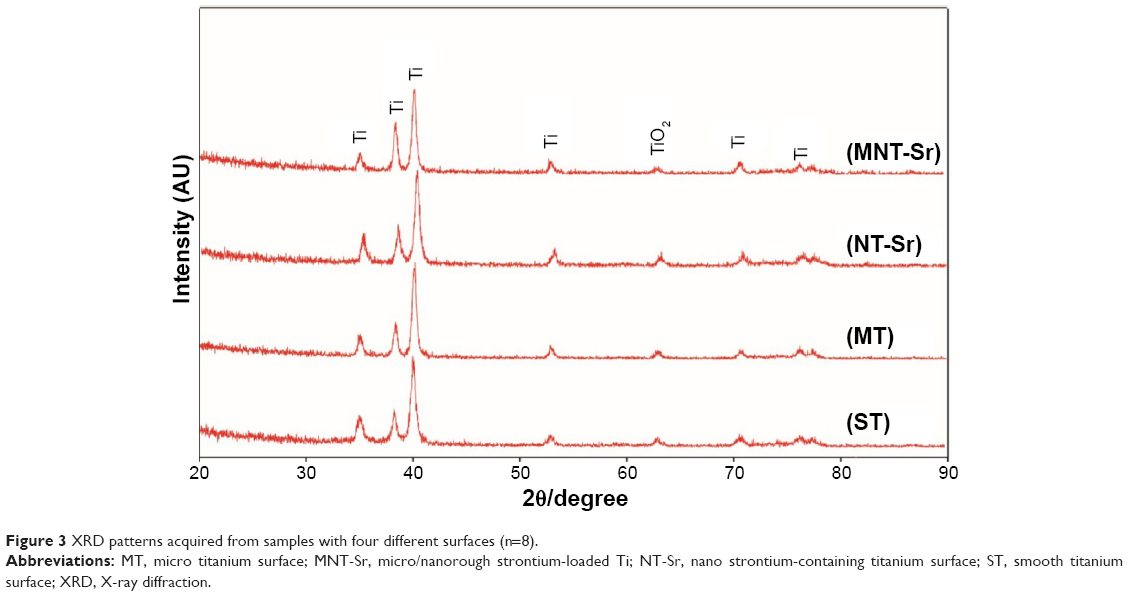
Scanning electron microscopy (SEM) and AFM results, shown in Figure 1, clearly display the surface texture of the Ti samples. There was no obvious micro or nano texture on the ST surface. The MT sample formed with etching treatment in 0.5% HF solution had a micropitted texture with F ions. The NT-Sr sample formed with magnetron sputtering treatment had a layer of nanodots with diameters of approximately 20–40 nm. The MNT-Sr sample formed with HF etching combined with magnetron sputtering possessed a micropitted texture on which there was an even distribution of nanodots with diameters of approximately 20–40 nm. Moreover, the cross section of NT-Sr and MNT-Sr samples from SEM images indicated that the thicknesses of Sr layers were approximately 20–40 nm (Figure 2). The surface roughness values measured using AFM and the water contact angles of the Ti samples are listed in Table 1. Significant differences in the surface roughness were observed among the Ti samples, as characterized by the surface area difference, root-mean-square roughness, and Z range. Generally, MT, NT-Sr, and MNT-Sr showed greater surface roughness than ST, in the order of MNT-Sr > MT > NT-Sr.
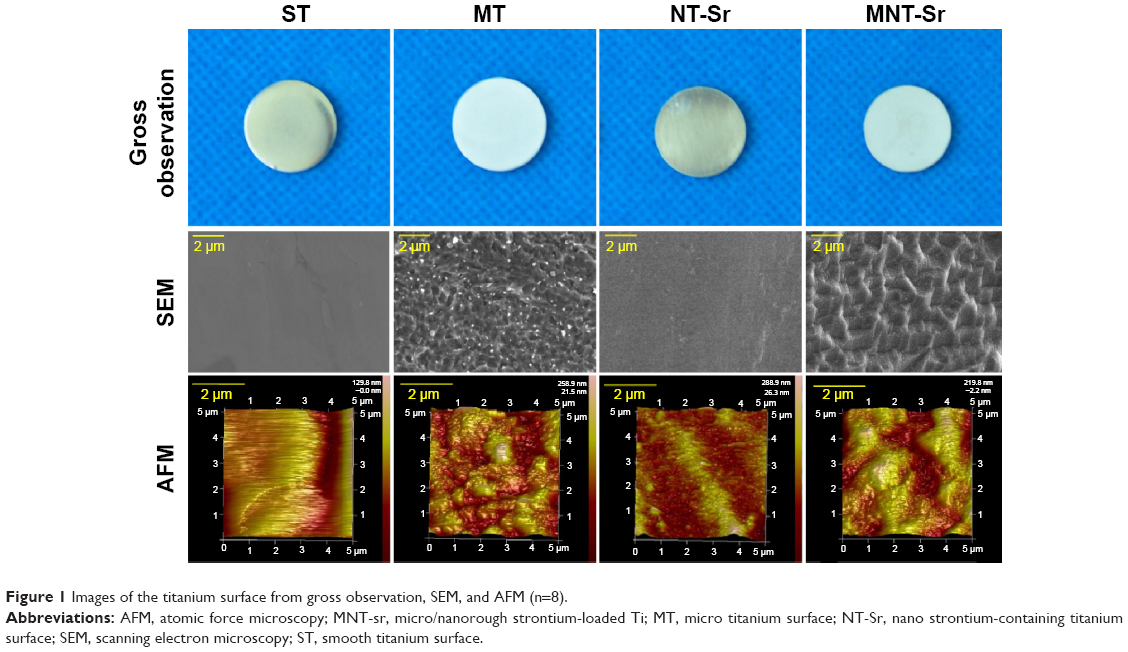 | Figure 1 Images of the titanium surface from gross observation, SEM, and AFM (n=8). |
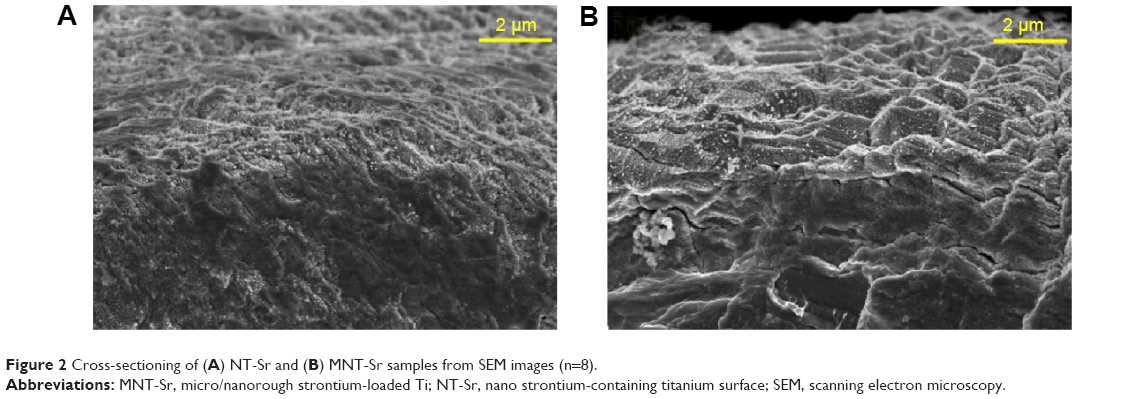 | Figure 2 Cross-sectioning of (A) NT-Sr and (B) MNT-Sr samples from SEM images (n=8). |
 | Table 1 Roughness values and contact angles of the four different surfaces (n=8) |
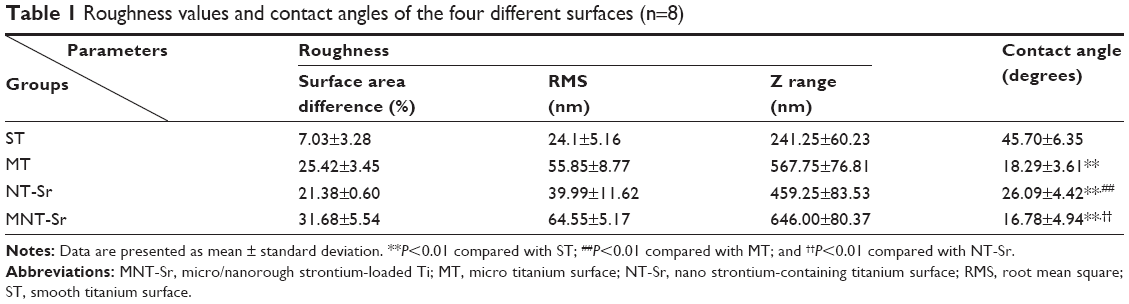
Moreover, the XRD spectra in Figure 3 disclosed no additional crystalline signal excepted for Ti and TiO2 on the four samples. The results of XPS survey spectra collected from four samples are shown in Figure 4 and Table 2 and confirmed that Sr and F content on the MNT-Sr surface were 2.73±0.55 at% and 0.89±0.21 at%, respectively, while the MT sample had 2.28±0.39 at% F and 3.6±0.28 at% Sr on the NT-Sr sample.
 | Figure 3 XRD patterns acquired from samples with four different surfaces (n=8). |
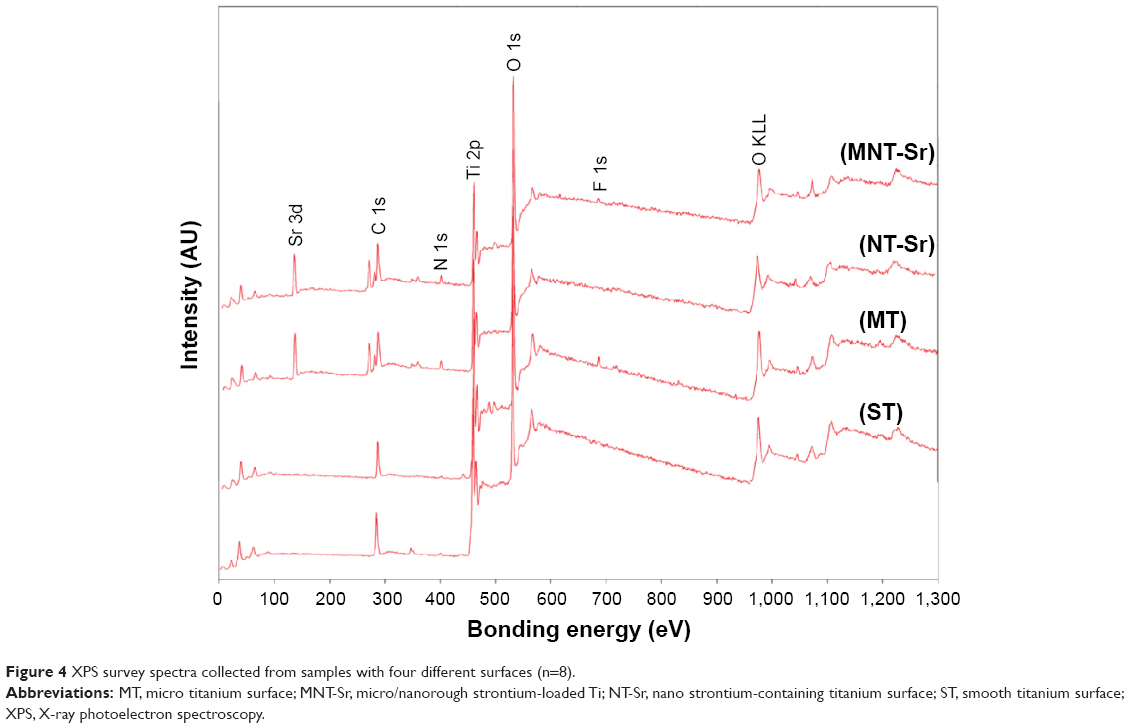 | Figure 4 XPS survey spectra collected from samples with four different surfaces (n=8). |
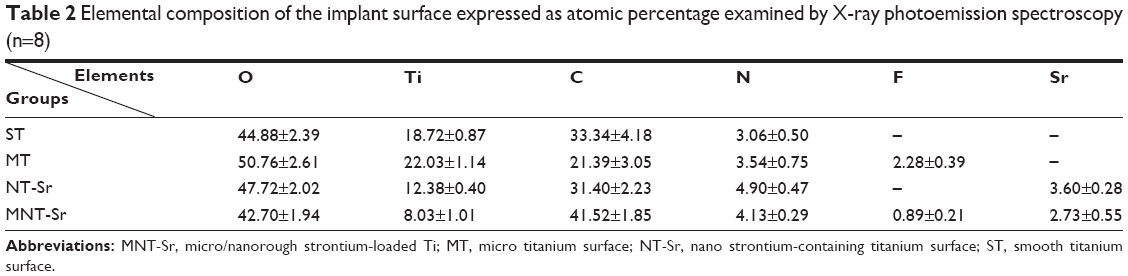 | Table 2 Elemental composition of the implant surface expressed as atomic percentage examined by X-ray photoemission spectroscopy (n=8) |
Furthermore, the interface bonding strength of NT-Sr and MNT-Sr samples were 59.3±7.6 MPa and 51.2±4.05 MPa, respectively. MT, NT-Sr, and MNT-Sr had much smaller water contact angles (18.29°±3.61°, 26.09°±4.42°, and 16.78°±4.94°, respectively) than ST did (45.70°±6.35°). MT and MNT-Sr, which possessed micro textures, had the smallest water contact angles.
Sr release
The Sr release kinetics were assessed by immersing the NT-Sr and MNT-Sr samples in 5 mL PBS for 14 days. The Sr release profiles of the NT-Sr and MNT-Sr samples are presented in Figure 5A. Generally, there was a quick initial Sr release, and the release rate decreased with time, and 7 days later, the released Sr amounts were relatively constant, with approximate Sr amounts released from NT-Sr and MNT-Sr daily being 0.0156±0.0092 μg/cm2 and 0.017±0.0063 μg/cm2, respectively. The total Sr contents leached from the NT-Sr and MNT-Sr surfaces were 42.08±2.52 μg and 35.92±6.86 μg, respectively (Figure 5B).
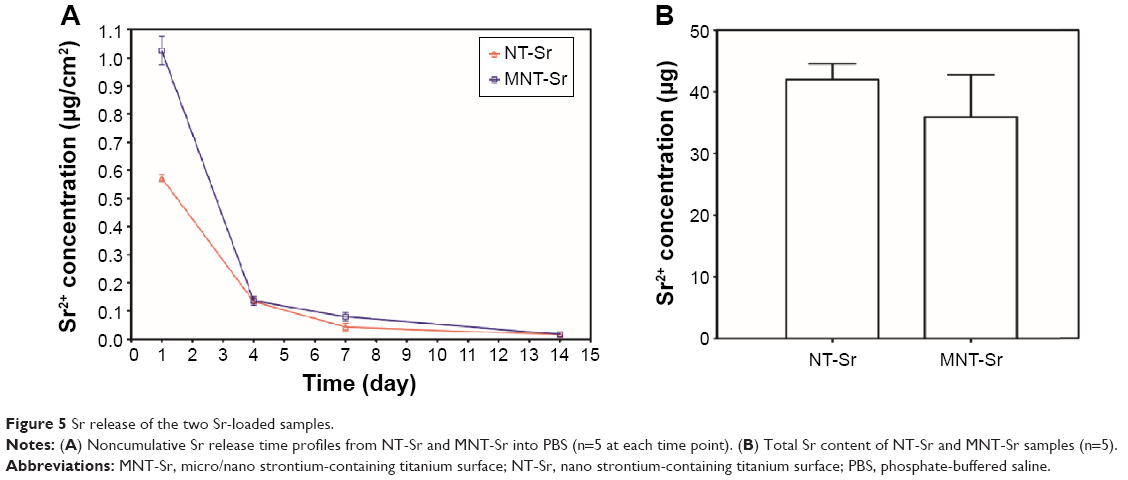 | Figure 5 Sr release of the two Sr-loaded samples. |
Cell adhesion
As shown in Figure 6, the adherent cell numbers on all the Ti samples increased with the incubation time from 30 to 120 minutes, and the cell numbers for the MT surface seemed to be higher than those for the other three groups were during the entire process. Furthermore, after 60 minutes of incubation, the numbers of adherent cells for the NT-Sr surface were significantly higher than those for the ST group. Although the numbers of adherent cells for the NT-Sr and MNT-Sr surfaces appeared to be higher than those for the ST surface at 30 and 120 minutes, the differences were not statistically significant.
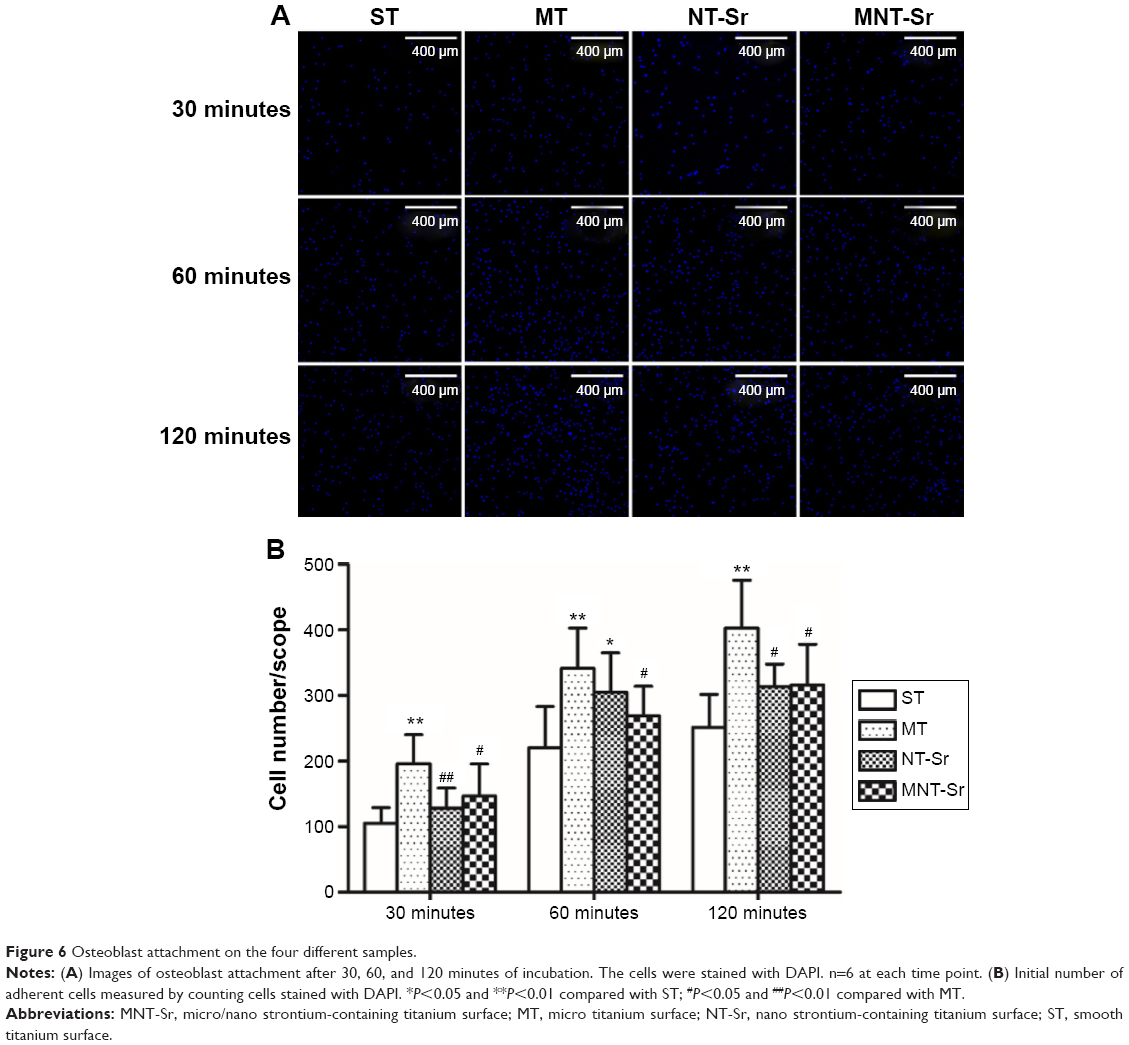 | Figure 6 Osteoblast attachment on the four different samples. |
Cell proliferation
The cell proliferation data assessed using MTT are presented in Figure 7. The cells for all the samples proliferated well with culture time from 1 to 7 days. At day 1, there was no discernible difference in the cell proliferation for the different Ti samples. At day 4, MT and MNT-Sr showed better cell proliferation than ST did, and at day 7, MNT-Sr showed considerably better cell proliferation than the other three groups.
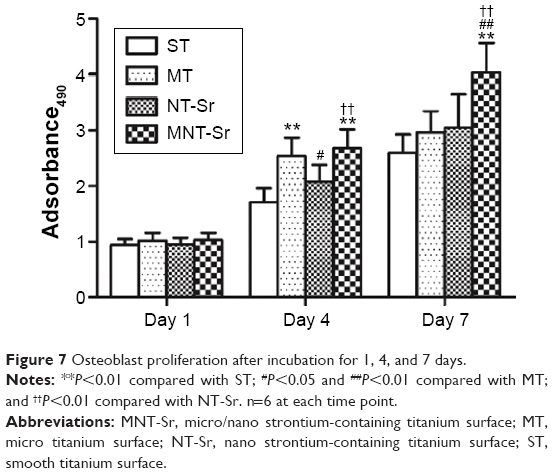 | Figure 7 Osteoblast proliferation after incubation for 1, 4, and 7 days. |
Cell morphology
As shown in Figure 8, the higher magnification SEM images reveal a clear morphological difference in the osteoblasts on the different Ti samples. The cells on MT, NT-Sr, and MNT-Sr all had smaller spreading areas than those on ST. Compared to the cells on MT, those on NT-Sr and MNT-Sr had a relatively larger spreading area, and they were polygonous in shape with abundant long lamellipodia and filopodia to form good intercellular junctions between adjacent cells.
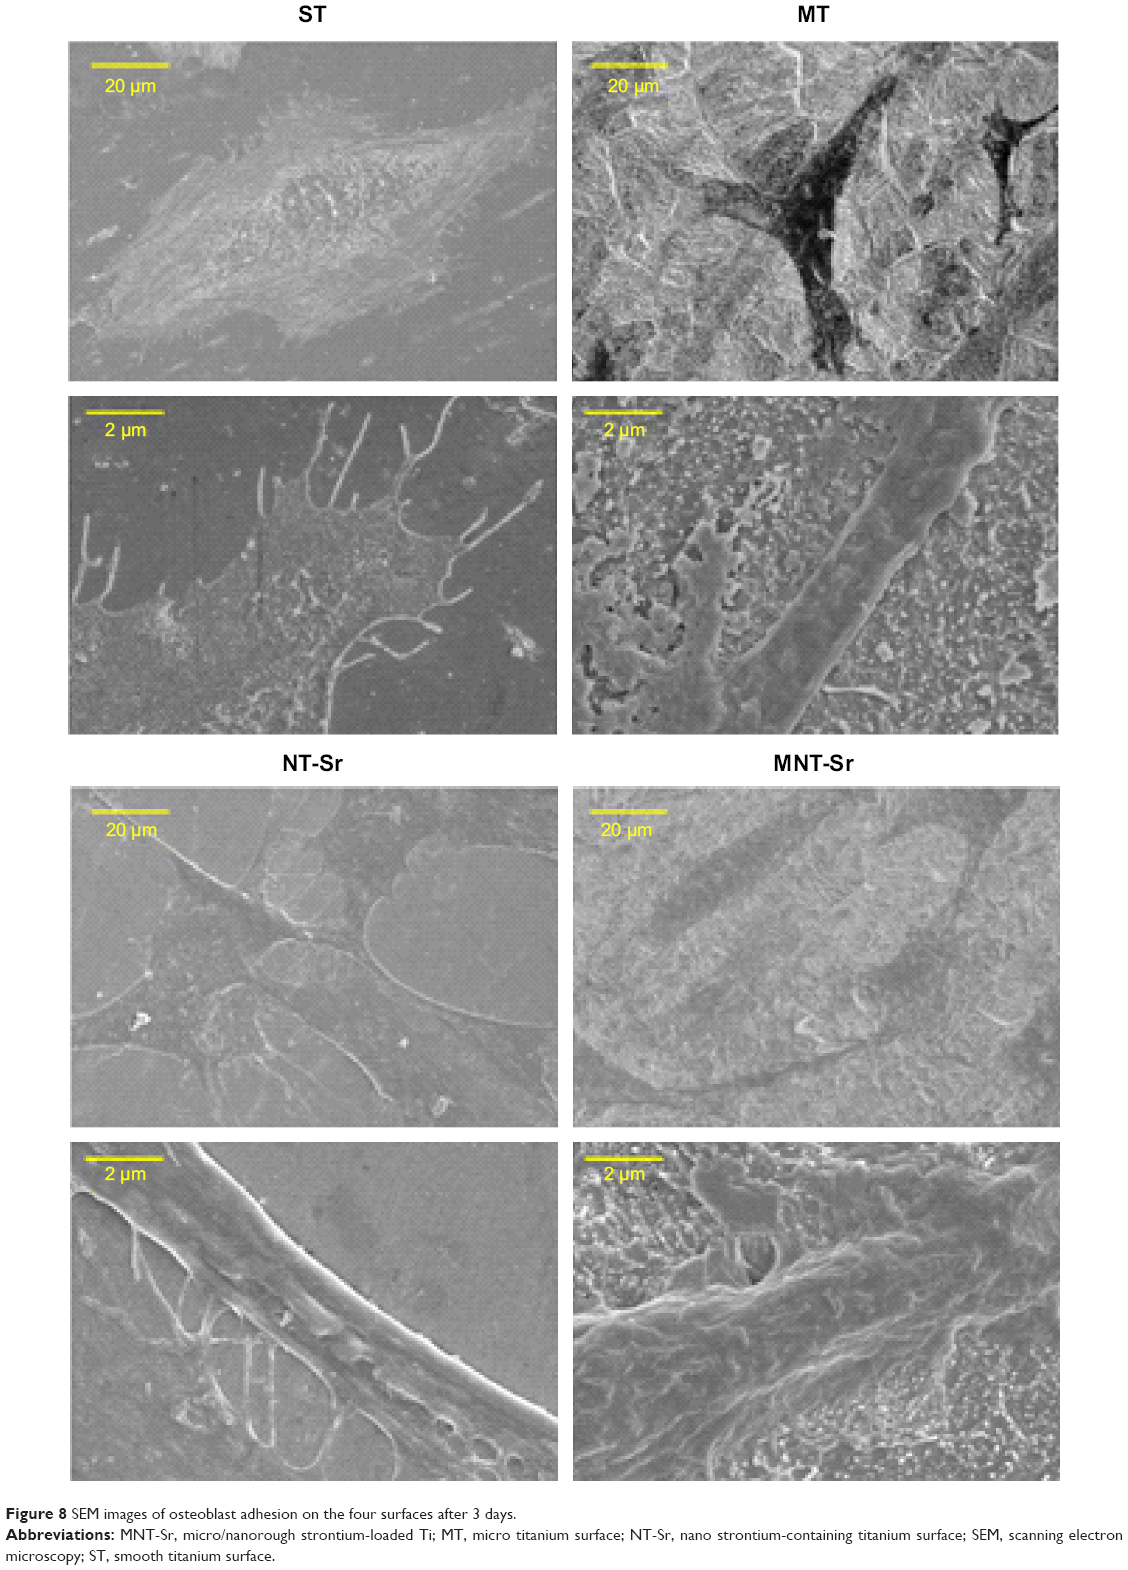 | Figure 8 SEM images of osteoblast adhesion on the four surfaces after 3 days. |
The CLSM images in Figure 9 show osteoblasts stained with FITC–phalloidin to label the actin cytoskeleton. More microfilaments and stress fibers (thicker bundles of filaments) were observed in the MNT-Sr sample. Strong labeling was frequently observed along the cellular edge and within the filopodia. In contrast, although the cells on the MT surface were extended with many filopodia, few cellular junctions were observed, and most of the cells did not exhibit an aligned cell array or a well-developed cytoskeleton. The actin bundles exhibited frequent haphazard orientation, and few long stress fibers were visible. The cells on the MT and NT-Sr surfaces exhibited more stress fibers and actin microfilaments than those on the ST surface did. At the same time, obvious cytoskeletal networks were observed on the MNT-Sr surface.
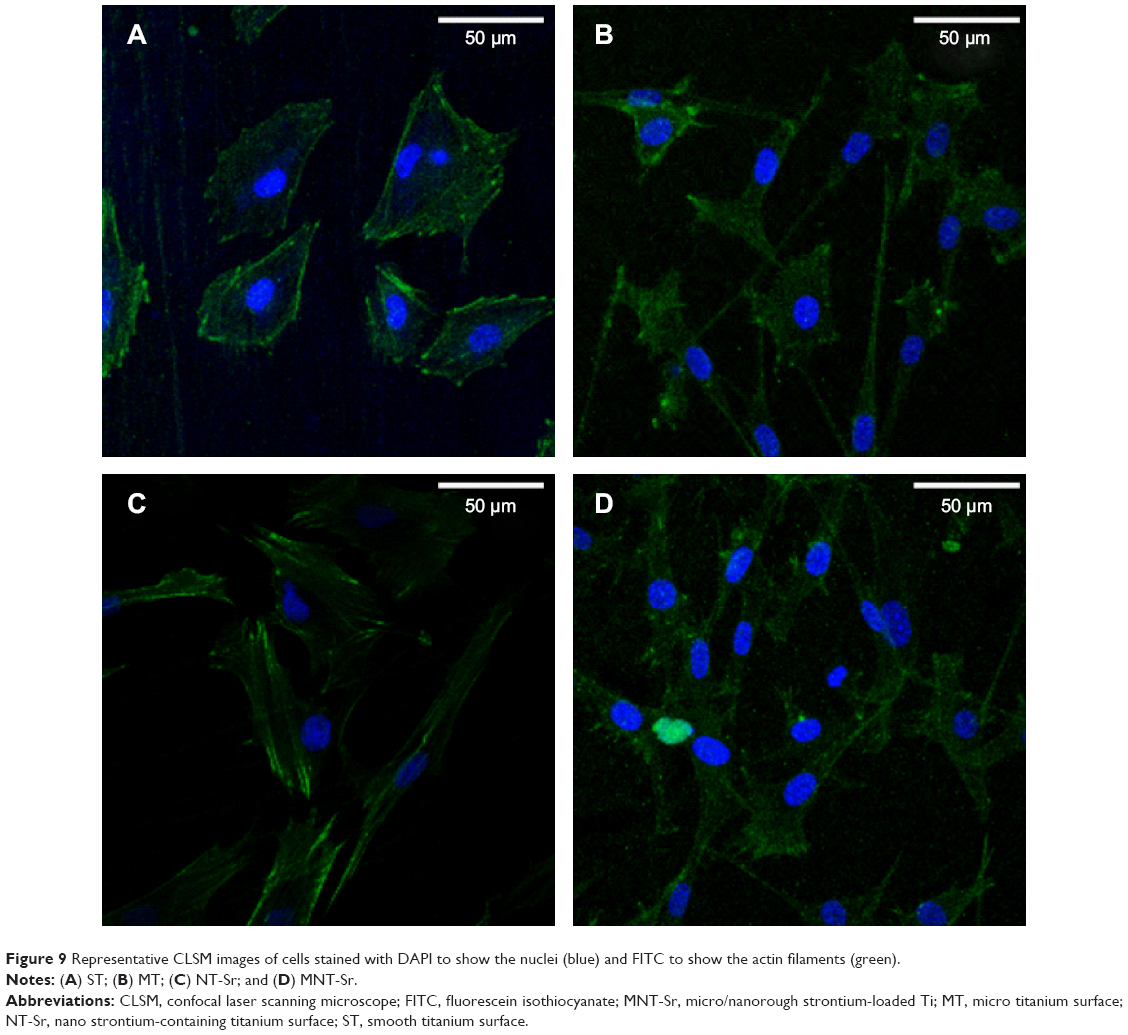 | Figure 9 Representative CLSM images of cells stained with DAPI to show the nuclei (blue) and FITC to show the actin filaments (green). |
ALP activity
As shown in Figure 10, compared with the other three groups, the MNT-Sr surface showed a significantly higher ALP activity after 7 days of culture. Furthermore, the NT-Sr surface had a higher level of ALP activity compared to the MT surface. However, the ALP activity on the MT surface was lower than that on the ST surface.
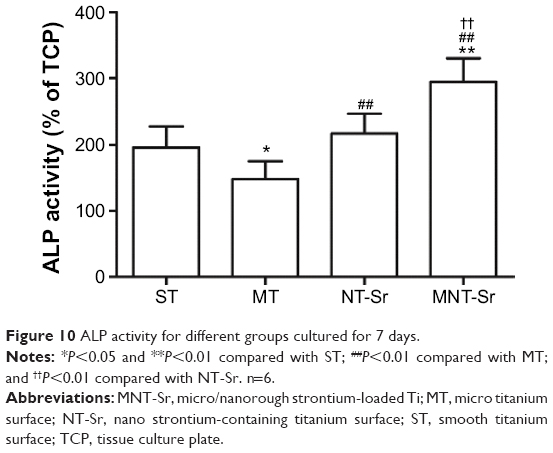 | Figure 10 ALP activity for different groups cultured for 7 days. |
Micro-CT evaluation
The micro-CT reconstructed images are shown in Figures 11 and 12, which clearly depict the architectural changes of trabecular bone around the implants. Compared with the other three groups, the bone volume around the MNT-Sr implant surface was clearly higher. In the quantitative assessment, BV/TV, Tb.N, and Tb.Th were significantly higher on the MNT-Sr; in particular, BV/TV, which is the most important parameter reflecting bone remodeling, increased by 0.99-fold, 0.27-fold, and 0.57-fold in comparison with ST, MT, and NT-Sr, respectively. The only significant difference in Tb.Sp was found between MT and MNT-Sr; MNT-Sr showed a slight reduction in Tb.Sp compared to MT. In addition, BV/TV was higher in the MT group than in the NT-Sr group, and compared with the ST group, the NT-Sr group showed a higher BV/TV. No statistically significant changes were found between the Tb.N and Tb.Th values of the NT-Sr surface and ST surface.
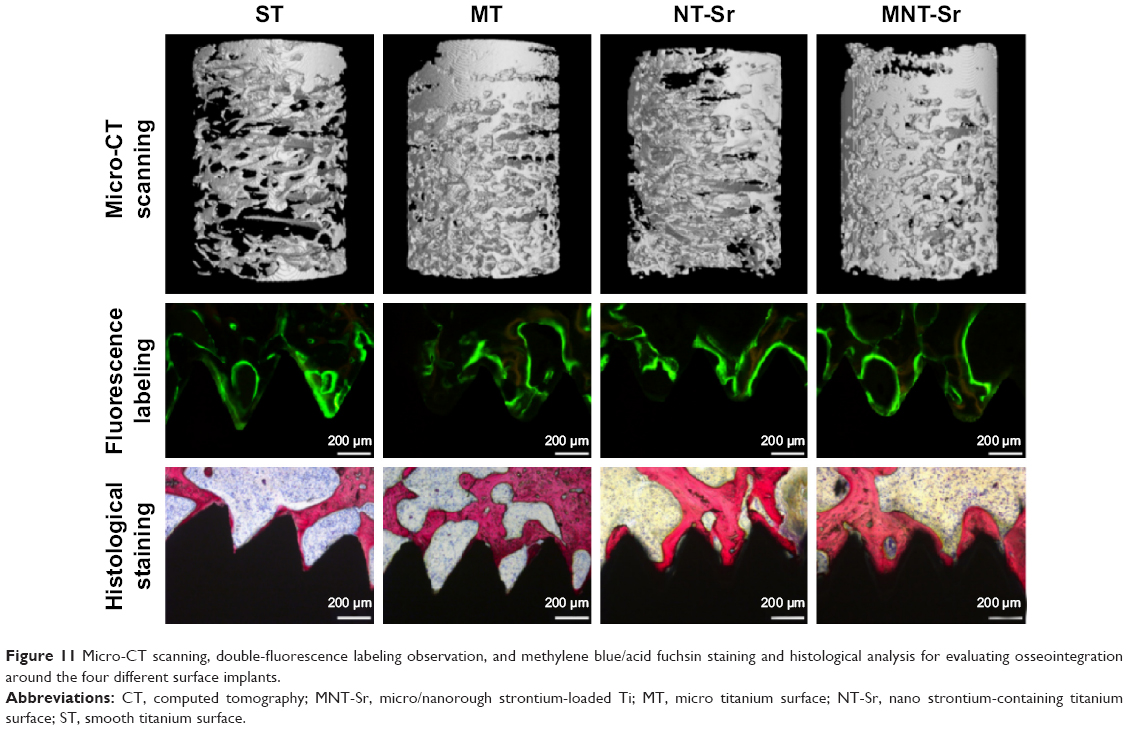 | Figure 11 Micro-CT scanning, double-fluorescence labeling observation, and methylene blue/acid fuchsin staining and histological analysis for evaluating osseointegration around the four different surface implants. |
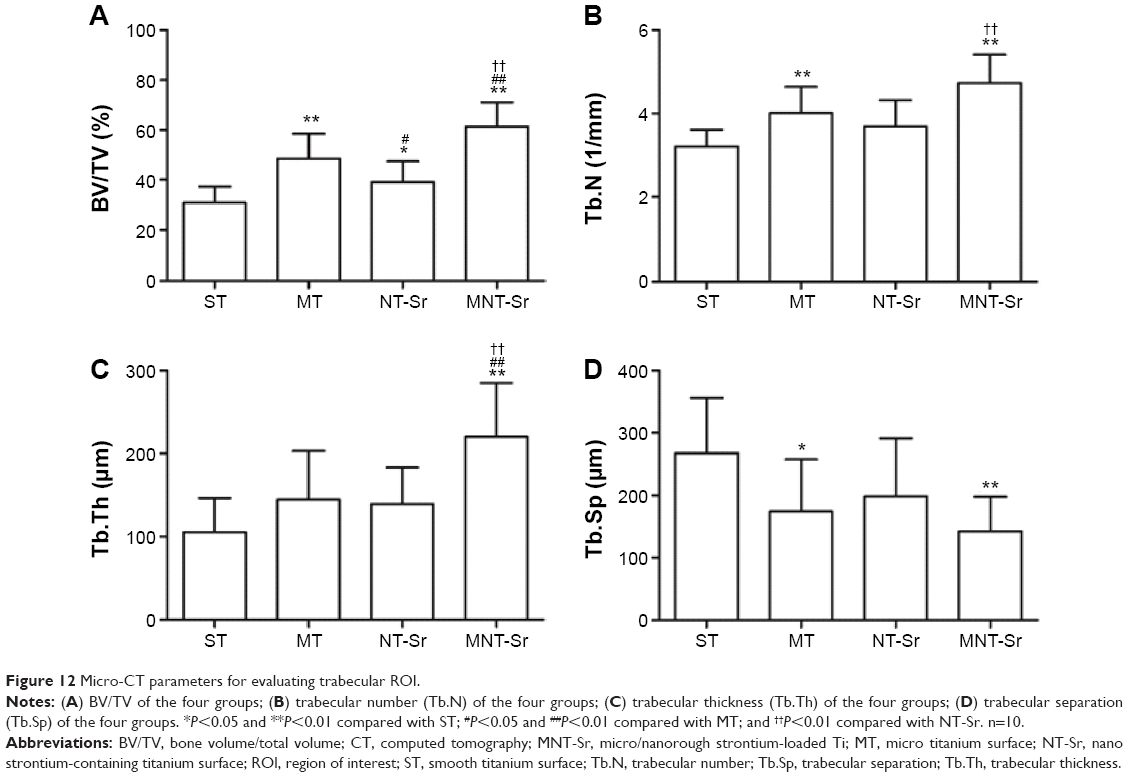 | Figure 12 Micro-CT parameters for evaluating trabecular ROI. |
Histological analysis
The implants and osseointegration of peri-implant trabecular bones were shown in the undecalcified sections with methylene blue/acid fuchsin staining. The calcified bone in the stained slides was distinguished from other tissues by its characteristic color (Figure 11). Bone tissue was stained bright pink and the implant was stained black in the slides. One section from each specimen was used for analysis, and the results of histomorphometry were expressed as BIC (Table 3). Twelve weeks after implantation, BIC% from the ST, MT, NT-Sr, and MNT-Sr groups were 39.70%±6.00%, 57.60%±7.79%, 46.10%±5.51%, and 70.38%±8.61%, respectively. There was a statistically significant difference in BIC% between the MNT-Sr group and the other three groups. Moreover, the MT group showed a statistically higher BIC% in comparison with the ST and NT-Sr groups. BIC% was higher in the NT-Sr group than in the ST group, but not significantly higher.
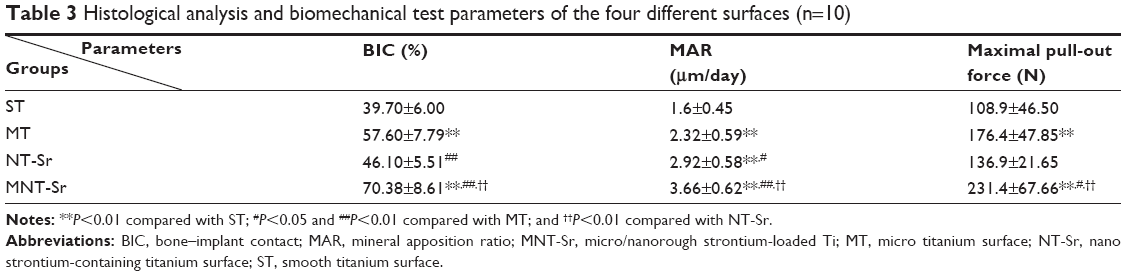 | Table 3 Histological analysis and biomechanical test parameters of the four different surfaces (n=10) |
Fluorescence microscope images are shown in Figure 11. The tissues labeled with calcein were observed with a green fluorescence marker, and those labeled with tetracycline were observed with a yellow fluorescence marker; the markers were deposited along the implant surfaces. The distance between two double-fluorescence markers indicated the rate of new-bone mineralization, which is defined as the mineral apposition ratio (MAR) (μm/day). There were statistically significant differences in MAR among the four groups with the following sequence: MNT-Sr > NT-Sr > MT > ST (P<0.01).
Biomechanical test
Table 3 lists the results of testing the maximal pullout force of the four groups 12 weeks after implantation. The pull-out forces of the MNT-Sr group were significantly higher than in the other groups (P<0.05). There was no statistically significant difference in the maximal pullout force between the MT and NT-Sr surfaces (P>0.05).
Discussion
SEM images of the microrough surface prepared by etching in 0.5% HF demonstrate micropits (with diameters of approximately 2–5 μm) engraved on the Ti surface. Previous studies have proved that this method is effective in improving osseointegration.21,22 On the other hand, the nano-sized roughness and Sr coating were achieved via magnetron sputtering, which is a physical deposition technique that enables the formation of nanostructured thin films and is widely used in several industrial applications with great success.23 The technique has three remarkable advantages. First, a nanostructured coating can be deposited on the material surface;23 in our study, layers of nanoparticles (diameters of approximately 20–40 nm) were fabricated through magnetron sputtering, and the same structure could also observed on the micro/nano surface. Second, the coating prepared using magnetron sputtering has high bonding strength at the interface.24 As demonstrated in our study, a high interface bonding strength can ensure the stability of the strontium layer to resist shear stress during implant insertion. Third, various inorganic components can be deposited on the materials by changing the targets in magnetron sputtering;25 here, the XPS results demonstrated Sr loaded on the nano and micro/nano surfaces, as anticipated.
In our study, via the above two techniques, we developed four surfaces that differed in roughness and chemistry component: ST, MT, NT-Sr, and MNT-Sr surfaces. The topography and chemistry of the four surfaces were investigated using SEM, AFM, XRD, and XPS. Although there was no Sr signal detected from XRD, the high Sr content was observed on the outermost surface of NT-Sr and MNT-Sr samples via XPS survey. It is estimated that Sr loaded on the samples was amorphous but crystalline, which can be detected via XRD. At the same time, amorphous Sr was inclined to dissolve, while crystalline Sr was hardly soluble in PBS.26,27 The issues were demonstrated by the result of Sr release experiment, which detected regular Sr release from the NT-Sr and MNT-Sr surfaces with amounts of 0.0156±0.0092 μg/cm2 and 0.017±0.0063 μg/cm2. The total Sr contents leached from the NT-Sr and MNT-Sr surfaces were 42.08±2.52 μg and 35.92±6.86 μg, respectively and the area of titanium disk was approximately 7.065 cm2. So, Sr may be delivered from the NT-Sr and MNT-Sr surfaces for a period of approximately 1 year theoretically, which can enable the functional effects of an Sr-loaded surface when inserted into bone tissues.
First, we discuss the roughness. The MT surface showed better osteoblastic adhesion than the other surfaces did in the early stage. This may be explained by the enhanced hydrophilicity in the micro surface etched using HF. Therefore, we speculate that the microrough surface fabricated with HF treatment will result in better hydrophilicity, which may be the reason for the higher cell adhesion; this speculation is in accordance with previous studies.8,28 Although the NT-Sr surface showed lower cell adhesion than the MT surface did, the proliferation and ALP activity of the two groups were significantly enhanced, and a similar phenomenon was observed by Zhao et al who found that the microtexture induces inconsistent osteoblast functions with enhanced initial cell adhesion and osteogenesis-related gene expressions but depressed effects on other cell behaviors including proliferation, ALP activity, and mineralization.22,29
Cell behaviors consist of adhesion, intracellular protein synthesis, proliferation, differentiation, extracellular matrix deposition, and mineralization. Cell adhesion is only the initial step during the functional process of osteoblasts. Higher cell adhesion does not imply enhanced osteogenetic activity. Intimate intercellular interaction is another crucial factor for osteogenetic activity. This phenomenon was observed on the NT-Sr and MNT-Sr surfaces via SEM and CLSM, as shown in Figures 8 and 9, respectively. Therefore, we can conclude that the NT-Sr and MNT-Sr surfaces may result in better osseointegration and better osteogenesis in vitro. It is certain that the role of Sr cannot be excluded, as will be discussed later.
Although the NT-Sr surface presented better osteogenetic activity in vitro and faster MAR compared with the MT surface in the animal experiment, remodeling of bones surrounding implants, BIC%, and maximum pullout force were all lower than in the MT group. Such contradictory results between in vivo and in vitro experiments may be explained via the theory proposed by Meirellese et al30 who considered that nanoscale topography alone is not sufficient to assure robust osseointegration; favorable osseointegration requires additional considerations of microscale topography and overall implant design for initial clinical stability.
We can interpret this issue by reviewing the process of osseointegration. After implantation, titanium implants interact with biological fluids and tissues. Direct bone apposition onto the surface of titanium is critical for the rapid loading of dental implants. There are two types of responses after implantation.31 The first type involves the formation of a fibrous, soft tissue capsule around the implant. This tissue capsule does not ensure proper biomechanical fixation and leads to clinical failure of the dental implant. The second type of bone response involves direct BIC without an intervening connective-tissue layer, which is known as osseointegration. Only a stable inner environment between the host bone and implant can promote true osseointegration instead of fibro-osseointegration. A fixed mechanical interlocking and broadened BIC area provided by the microrough surface could guarantee environmental stability, and this is the foundation of Sr functions.
For the modification of the chemistry, although strontium’s mechanisms of action on osteoblasts are not fully understood, the promotion and acceleration of new-bone formation on normal as well as osteoporotic individuals were confirmed by a series of cellular and animal experiments.13,29 Furthermore, the local administration of Sr has been attempted, including Sr-substituted hydroxyapatites modification, modification of metal-oxide layers with an Sr-containing salt, generation of strontium titanate (SrTiO3) nanotubes on the surface of metal implants,26 bioactive glasses comprising Sr,32 and Sr incorporation into metal-oxide layers on implant surfaces.33–35 In our animal experiment, although the NT-Sr surface decreased in BIC% and maximal pullout force, enhanced bone-mineralization deposition rate was observed on Sr-loaded surfaces. Currently, few studies have independently found a direct effect of enhanced bone mineralization on nano-sized roughness. We speculate that the faster MAR could be a result of Sr loaded on the surface. This speculation is consistent with previous studies,36,37 which demonstrated that strontium ranelate preserved or even promoted the characteristics of bone mineral crystals and degree of bone mineralization. Regarding the performance of osteoblasts on the surface shown in Figures 8 and 9, in comparison with each control group (ST versus NT-Sr and MT versus MNT-Sr), the phenomenon of promoting intercellular communication as well as the formation of lamellipodia and filopodia formed around the osteoblasts can be found in both the Sr-loaded surfaces. This may be the result of the synergistic effects of nanoparticles and Sr coating.
Although we did not investigate the entire process of osseointegration in detail, in brief, we can speculate that the effects of different surfaces during osseointegration may have been as follows: a smooth surface is beneficial for spread, a micro surface is beneficial for cell adhesion, a nano surface is beneficial for proliferation and differentiation, Sr loading results in better bone mineralization, and the synergistic effects of roughness in nanoscale and Sr loading result in favorable intercellular communication.
We found that the novel MNT-Sr surface ultimately exerted a highly beneficial effect on osseointegration in comparison with other surfaces in cellular and animal experiments. The advantages of both micro- and nanoscale roughness, in combination with the advantages of modification of chemistry with Sr, resulted in better osseointegration. In addition, from a biomimetic viewpoint, bone tissues are structures assembled in a highly organized manner and are composed of nano- (noncollagenous organic proteins, fibrillar collagen, and hydroxyapatite crystals), micro- (lamellae, osteons, and Haversian systems), and macro- (cancellous and cortical bones) scale building blocks.38 Therefore, in comparison with the other surfaces, the hierarchical hybrid micro/nanorough surface can better mimic the natural bone structure and provide a more suitable surface topography for cell functions as it can better mimic the structure of the natural extracellular matrix.
Conclusion
The MNT-Sr surface has a synergistic effect of hierarchical micro/nano-topography and Sr loading for enhanced osseointegration, and it may be a promising option for clinical use.
Though we attempted to consider all the aspects that might influence the results, limitations still exist such as the different bone metabolism pattern between rat and human, and the effects of nanoroughness and Sr loading could not be precisely established, since surface roughness and chemical modification were simultaneously achieved by magnetron sputtering. Nevertheless, we draw the following conclusions: roughness and chemistry play different roles at different stages during osseointegration, and a hierarchical micro/nano surface loaded with Sr developed by HF etching combined with magnetron sputtering is efficient for promoting osseointegration.
Acknowledgments
This work was supported by the National Natural Science Foundation of China (number 81371186 and number 81400564), Innovation Research Team in University (number IRT 13051), and Open Project of State Key Laboratory of Oral Medicine, Military (number 2014KA05).
Disclosure
The authors report no conflicts of interest in this work.
References
Berglundh T, Persson L, Klinge B. A systematic review of the incidence of biological and technical complications in implant dentistry reported in prospective longitudinal studies of at least 5 years. J Clin Periodontol. 2002;29 Suppl 3:197–212, 232–233. | ||
von Wilmowsky C, Moest T, Nkenke E, Stelzle F, Schlegel KA. Implants in bone: part II. Research on implant osseointegration: material testing, mechanical testing, imaging and histoanalytical methods. Oral Maxillofac Surg. 2014;18(4):355–372. | ||
Yin K, Wang Z, Fan X, Bian Y, Guo J, Lan J. The experimental research on two-generation BLB dental implants – part I: surface modification and osseointegration. Clin Oral Implants Res. 2012;23(7):846–852. | ||
Dohan Ehrenfest DM, Coelho PG, Kang BS, Sul YT, Albrektsson T. Classification of osseointegrated implant surfaces: materials, chemistry and topography. Trends Biotechnol. 2010;28(4):198–206. | ||
Kim TI, Jang JH, Kim HW, Knowles JC, Ku Y. Biomimetic approach to dental implants. Curr Pharm Des. 2008;14(22):2201–2211. | ||
Albrektsson T, Wennerberg A. Oral implant surfaces: Part 1 – review focusing on topographic and chemical properties of different surfaces and in vivo responses to them. Int J Prosthodont. 2004;17(5):536–543. | ||
Liu H, Webster TJ. Nanomedicine for implants: a review of studies and necessary experimental tools. Biomaterials. 2007;28(2):354–369. | ||
Mendonça G, Mendonça DB, Aragão FJ, Cooper LF. Advancing dental implant surface technology – from micron- to nanotopography. Biomaterials. 2008;29(28):3822–3835. | ||
Hacking SA, Tanzer M, Harvey EJ, Krygier JJ, Bobyn JD. Relative contributions of chemistry and topography to the osseointegration of hydroxyapatite coatings. Clin Orthop Relat Res. 2002;(405):24–38. | ||
Gross KA, Saber-Samandari S, Heemann KS. Evaluation of commercial implants with nanoindentation defines future development needs for hydroxyapatite coatings. J Biomed Mater Res B Appl Biomater. 2010; 93(1):1–8. | ||
Saber-Samandari S, Gross KA. The use of thermal printing to control the properties of calcium phosphate deposits. Biomaterials. 2010;31(25):6386–6393. | ||
Pors Nielsen S. The biological role of strontium. Bone. 2004;35(3):583–588. | ||
Maïmoun L, Brennan TC, Badoud I, Dubois-Ferriere V, Rizzoli R, Ammann P. Strontium ranelate improves implant osseointegration. Bone. 2010;46(5):1436–1441. | ||
Li Y, Li Q, Zhu S, et al. The effect of strontium-substituted hydroxyapatite coating on implant fixation in ovariectomized rats. Biomaterials. 2010;31(34):9006–9014. | ||
Zhou J, Li B, Lu S, Zhang L, Han Y. Regulation of osteoblast proliferation and differentiation by interrod spacing of Sr-HA nanorods on microporous titania coatings. ACS Appl Mater Interfaces. 2013;5(11):5358–5365. | ||
Fogelman I, Blake GM. Strontium does accumulate in bone. Osteoporos Int. 2012;23(3):1187, 1189–1190. | ||
Pernicova I, Middleton ET, Aye M. Rash, strontium ranelate and DRESS syndrome put into perspective. European Medicine Agency on the alert. Osteoporos Int. 2008;19(12):1811–1812. | ||
Le Guéhennec L, Soueidan A, Layrolle P, Amouriq Y. Surface treatments of titanium dental implants for rapid osseointegration. Dent Mater. 2007;23(7):844–854. | ||
Shibata Y, Tanimoto Y. A review of improved fixation methods for dental implants. Part I: surface optimization for rapid osseointegration. J Prosthodont Res. 2015;59(1):20–33. | ||
Yeo IS. Reality of dental implant surface modification: a short literature review. Open Biomed Eng J. 2014;8:114–119. | ||
Gao Y, Li Y, Xiao J, Xu L, Hu K, Kong L. Effects of microrough and hierarchical hybrid micro/nanorough surface implants on osseointegration in ovariectomized rats: a longitudinal in vivo microcomputed tomography evaluation. J Biomed Mater Res A. 2012;100(8):2159–2167. | ||
Zhao L, Mei S, Chu PK, Zhang Y, Wu Z. The influence of hierarchical hybrid micro/nano-textured titanium surface with titania nanotubes on osteoblast functions. Biomaterials. 2010;31(19):5072–5082. | ||
Tallarico DA, Gobbi AL, Paulin Filho PI, Maia da Costa ME, Nascente PA. Growth and surface characterization of TiNbZr thin films deposited by magnetron sputtering for biomedical applications. Mater Sci Eng C Mater Biol Appl. 2014;43:45–49. | ||
Ding SJ. Properties and immersion behavior of magnetron-sputtered multi-layered hydroxyapatite/titanium composite coatings. Biomaterials. 2003;24(23):4233–4238. | ||
Andersen OZ, Offermanns V, Sillassen M, et al. Accelerated bone ingrowth by local delivery of strontium from surface functionalized titanium implants. Biomaterials. 2013;34(24):5883–5890. | ||
Xin Y, Jiang J, Huo K, Hu T, Chu PK. Bioactive SrTiO(3) nanotube arrays: strontium delivery platform on Ti-based osteoporotic bone implants. ACS Nano. 2009;3(10):3228–3234. | ||
Anderson J, Kahn B, LaBone T, Brown L, Harris F. Solubility of various forms of strontium titanate in lungs: in vitro and in vivo studies. Health Phys. 1999;76(6):628–634. | ||
Zinger O, Anselme K, Denzer A, et al. Time-dependent morphology and adhesion of osteoblastic cells on titanium model surfaces featuring scale-resolved topography. Biomaterials. 2004;25(14):2695–2711. | ||
Zhao L, Wang H, Huo K, et al. The osteogenic activity of strontium loaded titania nanotube arrays on titanium substrates. Biomaterials. 2013;34(1):19–29. | ||
Meirelles L, Arvidsson A, Albrektsson T, Wennerberg A. Increased bone formation to unstable nano rough titanium implants. Clin Oral Implants Res. 2007;18(3):326–332. | ||
Grandfield K, Gustafsson S, Palmquist A. Where bone meets implant: the characterization of nano-osseointegration. Nanoscale. 2013;5(10):4302–4308. | ||
Gentleman E, Fredholm YC, Jell G, et al. The effects of strontium-substituted bioactive glasses on osteoblasts and osteoclasts in vitro. Biomaterials. 2010;31(14):3949–3956. | ||
Park JW, Kim HK, Kim YJ, Jang JH, Song H, Hanawa T. Osteoblast response and osseointegration of a Ti-6Al-4V alloy implant incorporating strontium. Acta Biomater. 2010;6(7):2843–2851. | ||
Park JW, Kim YJ, Jang JH. Enhanced osteoblast response to hydrophilic strontium and/or phosphate ions-incorporated titanium oxide surfaces. Clin Oral Implants Res. 2010;21(4):398–408. | ||
Park JW, Kim YJ, Jang JH, Song H. Positive modulation of osteogenesis- and osteoclastogenesis-related gene expression with strontium-containing microstructured Ti implants in rabbit cancellous bone. J Biomed Mater Res A. 2013;101(1):298–306. | ||
Choudhary S, Halbout P, Alander C, Raisz L, Pilbeam C. Strontium ranelate promotes osteoblastic differentiation and mineralization of murine bone marrow stromal cells: involvement of prostaglandins. J Bone Miner Res. 2007;22(7):1002–1010. | ||
Farlay D, Boivin G, Panczer G, Lalande A, Meunier PJ. Long-term strontium ranelate administration in monkeys preserves characteristics of bone mineral crystals and degree of mineralization of bone. J Bone Miner Res. 2005;20(9):1569–1578. | ||
Rho JY, Kuhn-Spearing L, Zioupos P. Mechanical properties and the hierarchical structure of bone. Med Eng Phys. 1998;20(2):92–102. |
 © 2015 The Author(s). This work is published and licensed by Dove Medical Press Limited. The full terms of this license are available at https://www.dovepress.com/terms.php and incorporate the Creative Commons Attribution - Non Commercial (unported, v3.0) License.
By accessing the work you hereby accept the Terms. Non-commercial uses of the work are permitted without any further permission from Dove Medical Press Limited, provided the work is properly attributed. For permission for commercial use of this work, please see paragraphs 4.2 and 5 of our Terms.
© 2015 The Author(s). This work is published and licensed by Dove Medical Press Limited. The full terms of this license are available at https://www.dovepress.com/terms.php and incorporate the Creative Commons Attribution - Non Commercial (unported, v3.0) License.
By accessing the work you hereby accept the Terms. Non-commercial uses of the work are permitted without any further permission from Dove Medical Press Limited, provided the work is properly attributed. For permission for commercial use of this work, please see paragraphs 4.2 and 5 of our Terms.