")
Back to Journals » ClinicoEconomics and Outcomes Research » Volume 6
Economic evaluation of aclidinium bromide in the management of moderate to severe COPD: an analysis over 5 years
Authors Karabis A, Mocarski M, Eijgelshoven I, Bergman G
Received 20 November 2013
Accepted for publication 16 January 2014
Published 5 April 2014 Volume 2014:6 Pages 175—185
DOI https://doi.org/10.2147/CEOR.S57904
Checked for plagiarism Yes
Review by Single anonymous peer review
Peer reviewer comments 2
Andreas Karabis,1 Michelle Mocarski,2 Indra Eijgelshoven,1 Gert Bergman1
1Mapi HEOR and Strategic Market Access, Houten, the Netherlands; 2Forest Research Institute, Jersey City, NJ, USA
Purpose: Aclidinium bromide is a long-acting muscarinic antagonistic used in maintenance treatment of chronic obstructive pulmonary disease (COPD). A model-based health economic study evaluated the cost-effectiveness of aclidinium 400 µg bid as an alternative to tiotropium 18 µg od for this indication in the US.
Patients and methods: Patient characteristics in this model reflect those in the aclidinium clinical studies: age > 40 years, stable moderate-to-severe COPD, current or ex-smokers (>10 pack-years), post-salbutamol forced expiratory volume in 1 second (FEV1) ≥30% and <80% of predicted normal value, and FEV1/forced vital capacity <70%. The model consists of five main health states indicating severity of COPD and the level of utility, resource use, and costs. Treatment efficacy over 5 years was modeled using FEV1% predicted; a network meta-analysis comparing aclidinium and tiotropium was used to estimate disease progression during the first 24 weeks, and results from the UPLIFT trial were used for time points after 24 weeks. Quality of life was assessed using utility scores in US patients from the UPLIFT trial. Cost-effectiveness was assessed as the incremental cost per quality-adjusted life year (QALY) gained.
Results: Over 5 years, QALYs were 3.50 for aclidinium versus 3.49 for tiotropium; life years accumulated were 4.52 for both. In this economic model, aclidinium versus tiotropium showed marginally fewer exacerbations (3.364 versus 3.390, respectively) and mean total health care costs (US$126,274 versus US$128,591, respectively). In all scenario analyses performed (discount factors of 0% and 6% for benefits and costs; time horizon of 1 year; mapping St George's Respiratory Questionnaire to European Quality of Life–5 Dimensions; excluding pharmacy costs, COPD-related cost only; cost of exacerbations; including ACCORD II trial in the network meta-analysis), aclidinium was associated with lower costs and marginally greater QALYs versus tiotropium.
Conclusion: Aclidinium is potentially cost-effective compared with tiotropium for maintenance treatment of moderate-to-severe COPD.
Keywords: chronic obstructive pulmonary disease, cost-effectiveness, model, tiotropium
Introduction
Chronic obstructive pulmonary disease (COPD) is a common, preventable, and treatable disease characterized by persistent airflow limitation that is usually progressive.1 It arises as the result of a modified inflammatory response in the respiratory tract to chronic irritants in noxious particles or gases, most commonly from tobacco smoking. The effects on lung function are irreversible; symptoms include dyspnea, cough, sputum production, wheezing, and chest tightness. Patients are susceptible to COPD exacerbations characterized by worsening of symptoms that may necessitate a change in medication, unscheduled health care utilization, or hospital stay.2
COPD is associated with considerable morbidity and mortality.3 COPD was estimated to be the eleventh leading cause of disability-adjusted life years in high-income countries, rising to seventh place by 2030, according to the WHO (World Health Organization) Global Burden of Disease and Risk Factors project.4 COPD accounted for 672,000 hospital discharges in the US in 2006.5 It is the third leading cause of death in the US; in 2005, there were 126,005 deaths with COPD as the underlying cause in people over the age of 25, reflecting an increase of 8% from the year 2000.6 COPD also poses a major economic burden in terms of health care costs and resource utilization. The total (direct and indirect) annual cost of COPD to the US was estimated by the National Heart, Lung, and Blood Institute to be US$(2005)38.8 billion, with more than half (US$21.8 billion) constituting direct costs.7 Direct costs of COPD typically include medication, general practitioner and specialist visits, and inpatient and outpatient hospital visits, and may also include the cost of pulmonary rehabilitation. Management of comorbidities contributes to additional health care spending.
In consideration of the significant economic and humanistic burden of COPD, therapeutic decisions should be based on an evaluation of the costs and benefits of available treatments. Bronchodilator medications are central to symptom management in COPD and are prescribed on an as-needed or on a regular basis to prevent or reduce symptoms.1 Long-acting bronchodilator medications are more convenient and produce more sustained relief than short-acting bronchodilators. In particular, long-acting muscarinic antagonists such as tiotropium bromide act by blocking the effect of acetylcholine on muscarinic receptors.8 Tiotropium has been shown to reduce exacerbations and related hospitalizations, improve symptoms and health status,9 and improve the effectiveness of pulmonary rehabilitation.10 Aclidinium bromide is a long-acting muscarinic antagonist indicated for long-term maintenance treatment of bronchospasm associated with COPD, including chronic bronchitis and emphysema, and has shown efficacy and tolerability among patients with COPD.11 From an economic perspective of the health care system, the cost-effectiveness of aclidinium should be assessed as a potential alternative to tiotropium.
A model-based health economic study was conducted to evaluate the cost-effectiveness of using aclidinium bromide 400 µg twice daily (bid) versus tiotropium bromide 18 µg once daily (od) in the maintenance treatment of COPD patients. As the analysis was performed from the perspective of the payer in the US health care system, only direct medical costs were considered.
Material and methods
Patient population
The patient population used in this model was in line with the licensed indication of aclidinium bromide 400 µg bid. The intention was to reflect patients enrolled in the aclidinium clinical studies. Therefore, the model assumed patients to be >40 years of age with stable moderate-to-severe COPD, current or ex-smokers with more than 10 pack-years, and have a post-salbutamol forced expiratory volume in 1 second (FEV1) ≥30% and <80% of predicted normal value and FEV1/forced vital capacity <0.7.
The age and sex characteristics used to inform the model were in line with the pivotal trial ACCORD I (AClidinium in Chronic Obstructive Respiratory Disease I),12 which was conducted solely in North America (Table 1).
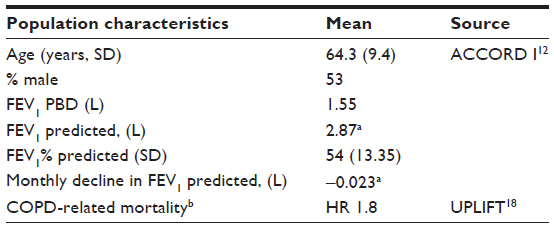 | Table 1 Patient characteristics in the ACCORD I trial used to inform the model |
Model structure
For this analysis, a cost-utility model was developed using Microsoft Excel® 2010 (Microsoft Corporation, Redmond, WA, USA), based on a time-in-state model structure. The model structure was similar to that of a Markov cohort model, with five main health states: mild, moderate, severe, and very severe (reflecting the severity of COPD) and a state for death (absorbing state). However, instead of using transition probabilities to determine movement between health states, the model calculated the proportion of patients in each health state according to the estimated FEV1% predicted values.
A schematic representation of the model structure is shown in Figure 1. Severity of COPD is depicted in line with the GOLD 2010 classification (Global initiative for chronic Obstructive Lung Disease [GOLD] Guidelines 2010).13 Although this classification has been modified in the updated GOLD 2011 guidelines,1 (and remained unchanged in the more recent 2013 update of the guidelines) the model was created according to the previous classification, as utilities, costs, and exacerbation rates in all available publications are reported according to the GOLD 2010 document. There were no research publications as of this analysis that quantified the utilities, costs, and exacerbation rates according to the severity classifications in the GOLD 2011 guidelines.
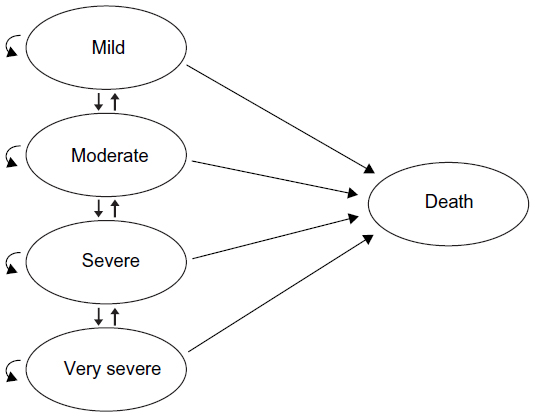 | Figure 1 Basic concept of the model indicating health states in chronic obstructive pulmonary disease. |
Each disease severity health state in the model reflected the risk of experiencing a severe or non-severe exacerbation, as well as the corresponding level of utility, resource use, and costs. Regardless of the patient’s level of disease severity, it was possible for that patient to experience either a severe or non-severe exacerbation. The model used a 1-month cycle length. At the end of a cycle, patients could remain in the same state or move to another state, according to the estimated post-bronchodilator FEV1 value. The model uses the mild state for extreme cases, in which a patient began the model being marginally in the moderate state (eg, FEV1 =49% of predicted normal value), and after a short period of treatment, an improvement in FEV1 percentage of predicted normal value was achieved such that the patient moved to the mild state for a number of cycles. For the lower extreme FEV1 values, the very severe state was used for those patients whose lung function deteriorated beyond the severe stage.
Clinical inputs
Most published models for the economic evaluation of COPD treatments (for example, Price et al14 and Rutten-van Mölken and Lee,15) are based on individual patient data (IPD) from head-to-head clinical trials. Using the IPD, transition probabilities from health states can be calculated. In the current study, the trials on aclidinium that were of sufficient duration for consideration in this model were versus placebo; therefore, the calculation of transition probabilities from IPD was not feasible.
To bypass the lack of IPD and direct comparison with other drugs, this model used the FEV1% predicted to measure the progress of the disease and the treatment effect by the following method: first, a baseline FEV1 predicted value was calculated at the starting point of the model (as post-bronchodilator FEV1/FEV1% predicted) using data from the clinical trial ACCORD I,12 which was conducted primarily in the US. Thereafter, a (linear) decline of this value with time (age) was considered. The slope of this FEV1 predicted graph was derived from published data for FEV1 regression analysis.16 Next, the change from baseline (CFB) for the post-bronchodilator FEV1 at 12 and 24 weeks was estimated. This estimation was based on the assumption that CFB for post-bronchodilator FEV1 was equal to CFB for FEV1 trough (ie, the use of a short-acting β2-agonist for the postbronchodilator measurement would not affect the CFB FEV1 values). The CFB values for FEV1 trough for each arm were estimated with a network meta-analysis (NMA).17 Finally, the FEV1% predicted was calculated at 12 and 24 weeks as the ratio of post-bronchodilator FEV1/predicted FEV1. The value of FEV1% predicted at the starting point was taken from ACCORD I.12
A linear interpolation was used to estimate the FEV1% predicted values between these three time points. After 24 weeks, the results of the UPLIFT (Understanding Potential Long-term Impacts on Function with Tiotropium) study18 were used to extrapolate the FEV1% predicted estimation for both arms. The rate of decline used for both arms was the same. A schematic representation of this approach is given in Figure 2.
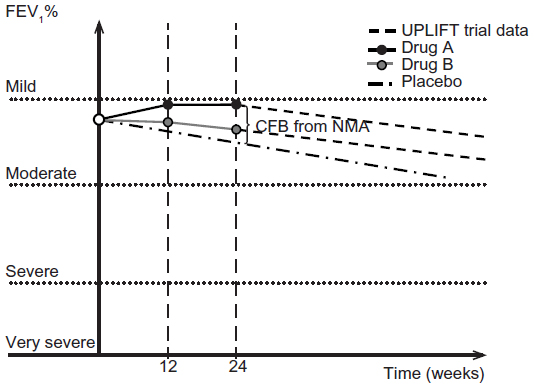 | Figure 2 Basic concept of the model, indicating efficacy for both treatment arms. |
Statistical testing has demonstrated that empirical data for FEV1% predicted does not significantly deviate from a normal distribution,19 with a standard deviation of 19.9%. Therefore, this model assumed that at each time point, the FEV1% predicted is normally distributed, with a mean value given by the three-step procedure described above and a standard deviation of 13.35% (baseline of ACCORD I study),12 which does not change over the time. This standard deviation is lower than in Hoogendoorn et al’s study,19 as only patients with moderate and severe COPD were included. With this assumption, we can estimate the percentage of patients in each health state. At the end of each cycle, the percentage of patients who had died was estimated. The model assumed that patient age followed a normal distribution, with a mean of 64.3 years and a standard deviation of 9.4 (baseline of ACCORD I study).12
Short-term changes in trough FEV1
Efficacy was modeled using values for FEV1% predicted. The estimation of FEV1% predicted was based on trough FEV1. The results of an NMA for the CFB trough FEV1 endpoints at 12 and 24 weeks were used in the economic model to estimate the decline of the FEV1% predicted during the first 24 weeks of the time horizon as a result of the efficacy of treatments (short-term changes in trough FEV1). NMA results of the comparison between aclidinium 400 µg bid and tiotropium 18 µg od were taken from a larger NMA that also compared aclidinium 400 µg bid and tiotropium 5 µg od;17 however, since tiotropium 5 µg od is not a relevant comparator in the United States, a scenario analysis was performed comparing only aclidinium 400 µg bid and tiotropium 18 µg od, and these latter results were used to populate the present model. NMA results were used, as no long-term studies have been conducted comparing aclidinium and tiotropium.20 The inclusion of data from the shorter studies (2 weeks and 6 weeks) comparing aclidinium and tiotropium would require substantial extrapolation of the trial data, which would increase uncertainty in the outcomes of the analysis.
The LAS-MD-38 (ACCORD COPD II) study was excluded from the NMA because of a high risk of bias due to an imbalance in patients’ baseline characteristics, including COPD severity, which occurred despite randomization.21 The aclidinium bromide arm included a more severe COPD population than the placebo arm at baseline, reducing the apparent treatment differences in this study. The impact of including this trial on the NMA results was evaluated in scenario analysis, which in turn has been evaluated in the economic model.
Long-term changes in trough FEV1
The estimation of the long-term evolvement of trough FEV1 (after 24 weeks) was based on long-term data from the UPLIFT study, a 4-year randomized controlled trial comparing tiotropium versus placebo in patients with COPD.18 This study showed that after a 30-day period, tiotropium did not significantly reduce the rate of decline in trough FEV1 compared with placebo. Therefore, the assumption used in our economic model was that the annual decline in trough FEV1, after an initial treatment-specific improvement, was the same for both interventions; this is −0.04 mL (standard error 0.01), extracted from the UPLIFT publication graph.18
The treatment effect at 12 and 24 weeks (NMA result) as well as the common annual decline after 24 weeks (based on UPLIFT study data) are demonstrated in Figure 3.
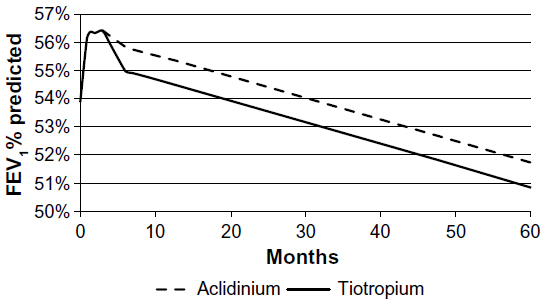 | Figure 3 Change in FEV1% predicted over 5 years. |
Exacerbations
In the model, severe exacerbations were defined as exacerbations that required hospitalization, while non-severe exacerbations were those that required a change in medication and/or contact with a health care provider. The estimation of treatment differences in terms of the reduction in rate of exacerbations was challenging due to variation in the definitions used across the randomized controlled trials. Furthermore, the trials reported relatively low rates of exacerbations as a result of short follow-up periods. Therefore, the probabilities of experiencing severe and non-severe exacerbations in each modeled health state were derived from published literature.22 The values used in the analysis are presented in Table 2.
 | Table 2 Values used for each of the parameters in the model |
Safety
Both treatment regimens (aclidinium 400 µg bid and tiotropium 18 µg od) had acceptable safety profiles. No adverse events were included in the analysis, on account of the lack of data on utility loss and costs related to adverse events.
No mortality benefit was assumed with either treatment. Disease-specific mortality, estimated using the hazard ratio of COPD mortality versus natural mortality reported in the UPLIFT study (hazard ratio =1.8),18 was equal for both arms. Estimations of natural mortality were based on a US-specific life table.23
Quality of life
Rutten-van Mölken et al24 assessed the quality of life of COPD patients using the European Quality of Life–5 Dimensions (EQ-5D) for COPD severity stages and concluded that an increase in severity of COPD was associated with a decline in utility scores. In their analysis, data on a subset of 1,235 patients from the UPLIFT trial (out of a total of 5,993 patients) were used. A substantial proportion (34.5%) of patients lived in the US. The EQ-5D was completed at the randomization visit and prior to start of study medication. Utility scores were reported for three GOLD-defined COPD severity stages (moderate, severe, and very severe) for the UK (derived in 1990) and the US (derived in 2002). For the current evaluation, the US dataset was used. As the utility value for mild COPD was lacking, it was assumed that the utility value for moderate COPD was applicable to mild COPD as well.
In a recently published US cost-effectiveness study, Earnshaw et al25 used a utility multiplier for moderate and severe exacerbations of 15% and 50% utility loss, respectively; the utility multipliers were derived from Oostenbrink et al.22 In the current analysis, these same utility multipliers (15% and 50% reduction in utility score for mild/moderate and severe exacerbations, respectively, applied to the cycle length) were used.
Additionally, Pickard et al26 demonstrated that the St George’s Respiratory Questionnaire (SGRQ)27 provides a greater capacity for discrimination between different levels of COPD severity stages compared with the use of generic measures such as the EQ-5D. Therefore, for the US model, the SGRQ total score was mapped to utility values using the algorithm developed by Starkie et al.28 The SGRQ data by COPD severity at baseline from the ACCORD I trial was used as the basis for the mapping. The utility value for exacerbations did not change, as it was not possible to quantify this due to the lack of SGRQ data at time of exacerbation. This set of utility values was evaluated in a scenario analysis.
Economic inputs
Due to a lack of quantifiable resource use data, a lump sum cost per severity stage for COPD management and exacerbations was used in the model (Table 2).25,29–31 Costs from Yu et al31 were used for the base case results, while the cost of exacerbations was varied using data from Earnshaw et al25 and Oba29 in our scenario analysis.
As Yu et al31 did not report the COPD management cost by disease stage, the all-cause cost in 2008 for patients not having an exacerbation (US$4,672) was assumed to be applicable for the moderate COPD stage. In addition, a multiplier was used to estimate the COPD management costs for the severe (1.37) and very severe (1.90) stages, as suggested by Rutten-van Mölken et al.32
The drug costs are US$7.25 and US$8.03 per day for aclidinium and tiotropium, respectively (Table 2). All prices have been indexed to 2012 using the consumer price index33 (2008–2012 costs multiplied by 1.076, and 2006–2012 by 1.15). As the model uses a 1-month cycle length, the COPD management quarterly cost31 was converted to a monthly cost.
In accordance with the recommendations of the American Society of Health System Pharmacists,34 the third-party payer perspective was taken. For the base case, the willingness to pay threshold was set at US$50,000. Costs and health benefits were discounted yearly, after the first year, at a rate of 3%.34
Analysis
At the start of treatment, all patients were considered to be in the moderate or severe health states, reflecting the characteristics of patients in the aclidinium pivotal trials.
Although COPD is a chronic disease, suggesting that a lifetime horizon should be applied, long-term efficacy and safety data are not available for aclidinium, as the longest double-blind, placebo-controlled trial was of 24 weeks’ duration. Additionally, our approach assumed that the FEV1 benefit incurred during the first 24 weeks of treatment will not be lost over the course of time, or in other words, that the slope of lines describing lung function decline will remain parallel between treatment groups. This assumption can be supported clinically by studies like TORCH (TOwards a Revolution in COPD Health) (3 years)18 and UPLIFT (4 years) but has not been demonstrated in life-long studies. Thus, the authors decided not to extrapolate to a lifetime horizon, as it introduced assumptions that cannot be supported by clinical evidence. Therefore, our analysis was based on a time horizon of 5 years. Longer timeframes would require substantial extrapolation of 24-week trial results. Many other published economic models in COPD support this approach (1 year,22 3 years,35 and 5 years15,32,36).
Model calculations
The model compared the benefits expressed in quality-adjusted life years (QALYs) and costs with aclidinium versus tiotropium by taking into account efficacy, safety, health-related quality of life, mortality, medical resource use, and costs over 5 years. The costs were broken down into drug costs and medical costs. Uncertainty in the modeled outcomes was evaluated using a probabilistic sensitivity analysis (PSA). The primary estimate for cost-effectiveness was the incremental cost per QALY gained.
Results
Base case
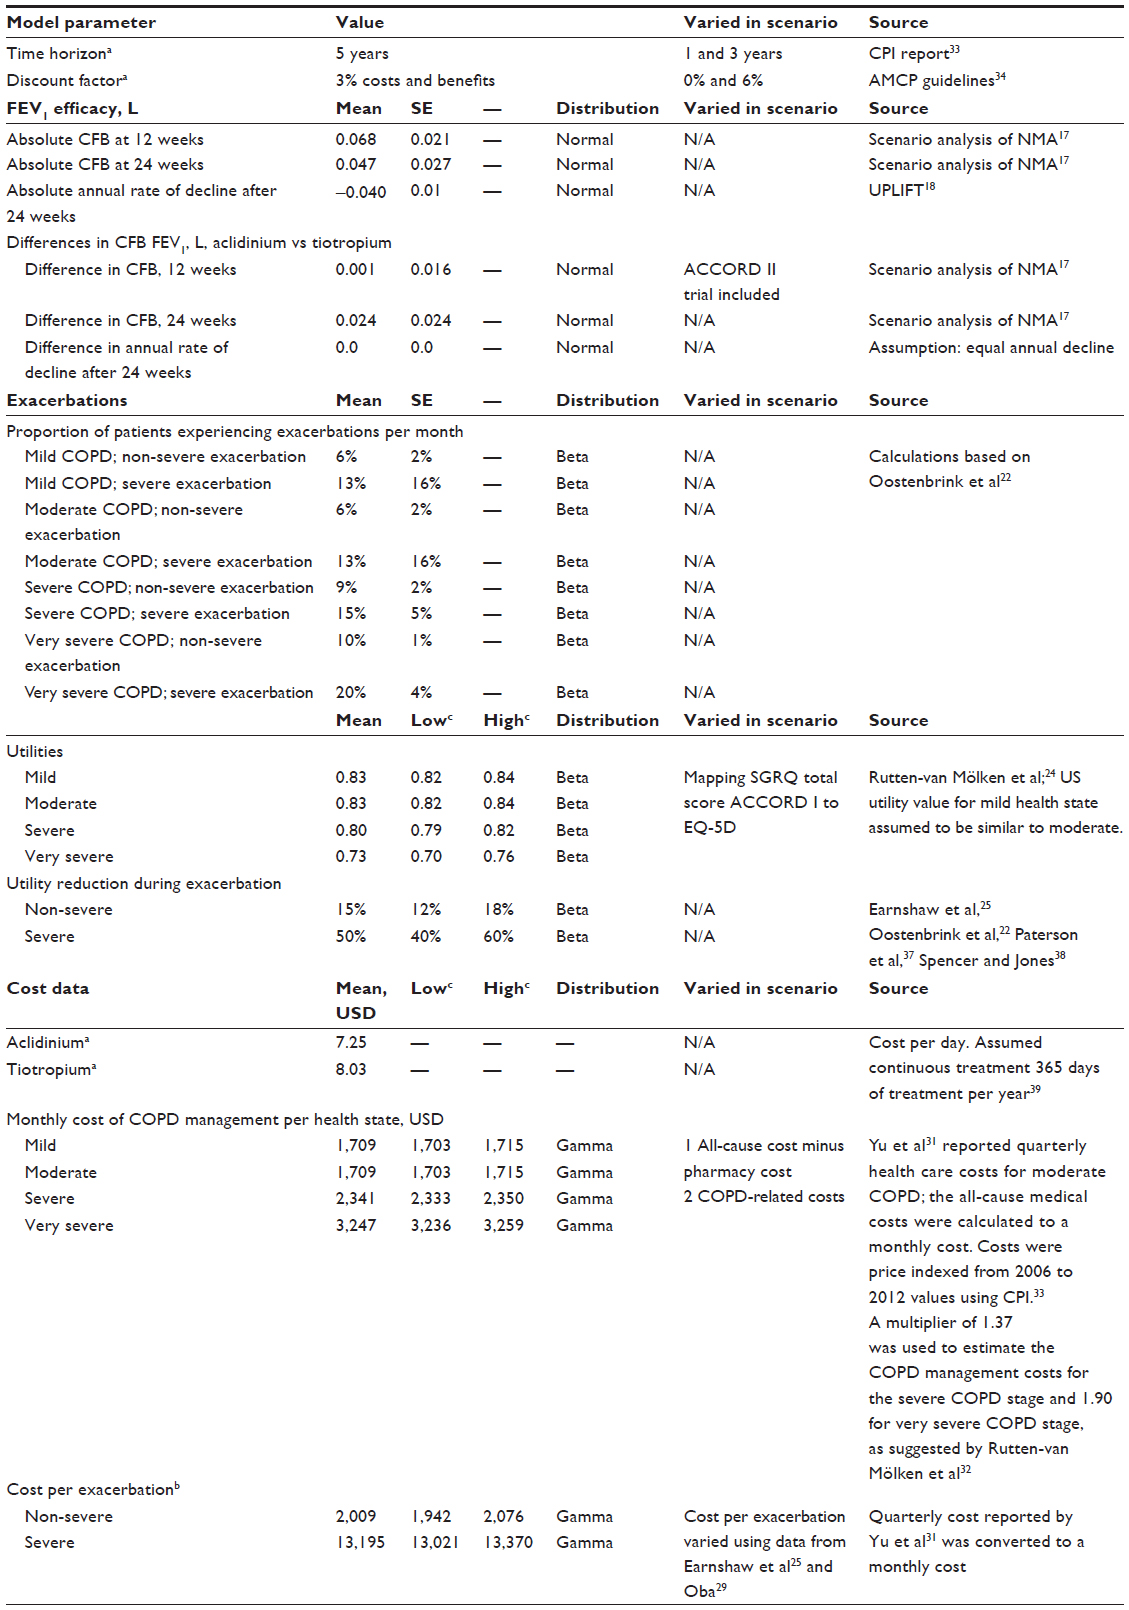
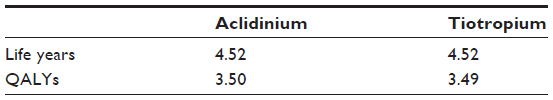
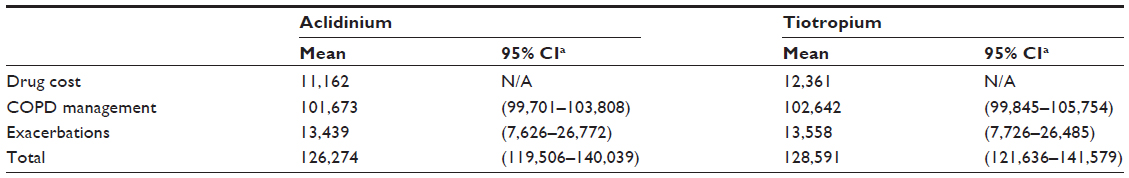
Over 5 years, 4.52 life years were accumulated for both aclidinium and tiotropium, while the QALYs were slightly lower for tiotropium (3.49) than for aclidinium (3.50) (Table 3). The mean total health care costs were lower for aclidinium (US$126,274) versus tiotropium (US$128,591), arising from the lower drug cost and lower cost of COPD management for the former (Table 4). Aclidinium showed a marginal benefit compared with tiotropium in terms of QALYs, reflecting a marginally better treatment efficacy (Figure 3), which in combination with the lower costs, resulted in a position of dominance (Table 5). Fewer exacerbations were seen with aclidinium compared with tiotropium over the 5-year time horizons (Table 6).
 | Table 3 Life years and QALYs with the upper–lower bound estimation from PSA (over 5 years) |
 | Table 4 Total health care costs (in USD) (over 5 years) |
 | Table 5 Differences between treatments in QALYs, life years, and costs over 5 years |
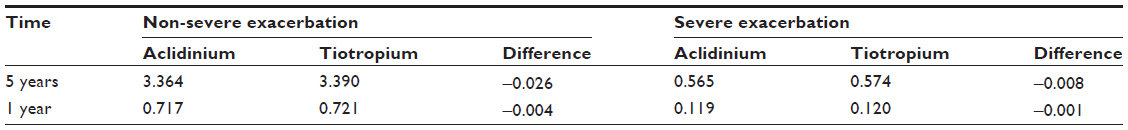 | Table 6 Number of exacerbations over 1-year and 5-year time horizons |
Sensitivity analyses
To address uncertainty in the evaluation, a PSA was performed to quantify the uncertainty in the model outcomes based on the uncertainty of the input parameters. The parameters included in the PSA together with the distributions are presented in Table 2. The results of the PSA for 1,000 stochastically sampled iterations are presented on the cost-effectiveness plane (Figure 4). Incremental QALYs (QALYAclidinium – QALYTiotropium) and incremental costs (CostAclidinium – CostTiotropium) are represented by the x and y axes of the graph. As the number of exacerbations is the key driver for both costs and QALYs, the incremental costs are (negatively) correlated with the incremental QALYs (eg, as the number of exacerbations for aclidinium increases, the incremental costs increase, and the incremental QALYs decrease). Although the difference in QALYs is low, 84% of the iterations fall in the lower right quadrant (Figure 4), demonstrating the robustness of the base case results (Table 5).
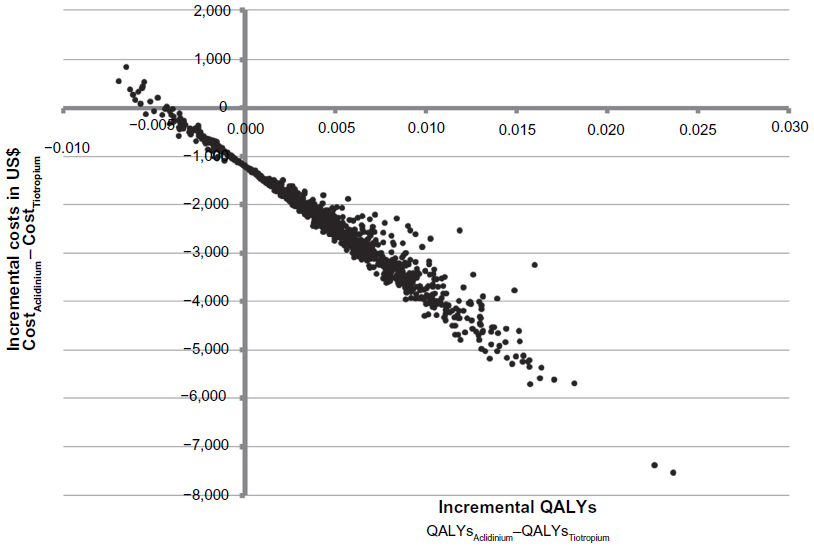 | Figure 4 Probabilistic sensitivity analyses – incremental cost-effectiveness plane. |
As the incremental benefit in QALYs is low, the results are driven by cost, and even small changes in the input values can have an impact on the incremental cost-effectiveness ratio.
Scenario analyses
For the base case analysis for the COPD management cost, the all-cause medical costs were used. Since the all-cause medical costs for patients not having an exacerbation also included pharmacy costs and we modeled daily-use drugs (tiotropium and aclidinium separately), a scenario was tested excluding the pharmacy costs reported31 from the all-cause medical costs. In addition, a scenario was tested using only the COPD-related cost, although this was expected to be an underestimation of the true COPD-related medical costs due to coding inconsistencies in medical claims from which these values were derived.31
Furthermore, scenario analyses using discount factors of 0% and 6% for benefits and costs were performed; a scenario for a time horizon of 1 year, scenarios on the cost of exacerbations, a scenario using estimation of utilities by mapping SGRQ to EQ-5D, and a scenario including the ACCORD II trial on the NMA results were evaluated. In all analyses, aclidinium was associated with lower costs (US$–2,458 to US$–444) and marginally greater QALYs (0.0041–0.0072) compared with tiotropium for each of the parameters assessed (Table 7).
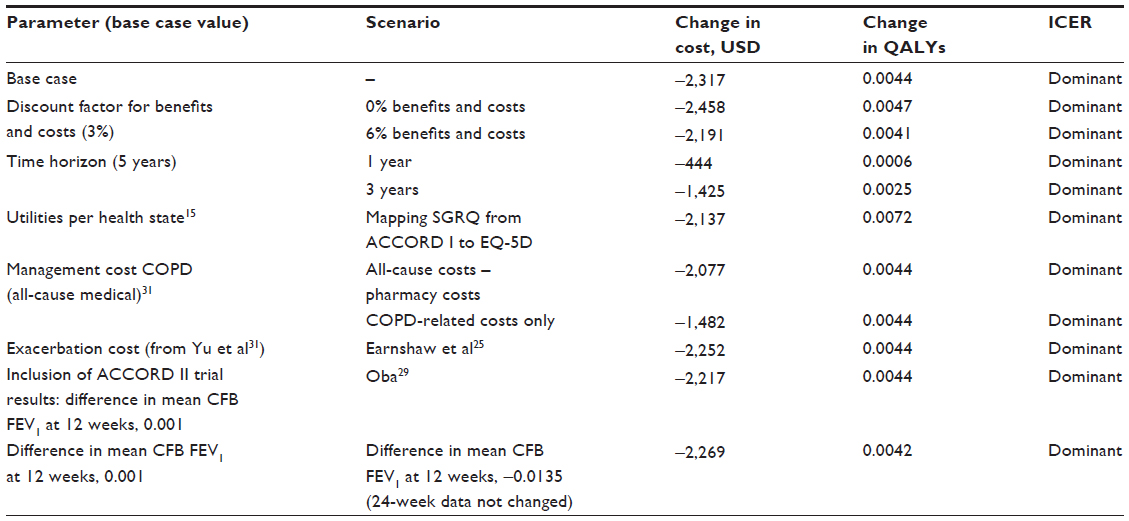 | Table 7 Scenario analyses (change of source data) difference in cost, QALYs, and ICER of aclidinium vs tiotropium |
Discussion
The current study evaluated the cost-effectiveness of using aclidinium 400 µg bid versus tiotropium 18 µg od in the treatment of patients with moderate-to-severe COPD in the US. The findings suggest that aclidinium 400 µg may be expected to provide comparable accrued health benefits as tiotropium 18 µg, but at a lower treatment cost. Cost savings are expected due to the lower price of aclidinium 400 µg compared with tiotropium 18 µg.
The modeling approach used is largely in line with previously published models in COPD, although some differences should be noted. Most of the previously published models have used patient level trial data as source data. In the current model, the use of aggregated level data was forced by the lack of comparative trial data versus tiotropium. Hence, comparative data were generated by means of indirect treatment comparison techniques. This increases the number of assumptions and complication of the model, as the lack of IPD does not allow for the estimation of transition probabilities. One limitation related to the use of the indirect treatment comparison is that variables may be listed differently in the hierarchy of endpoints for the different studies compared. For instance, in some studies used in the indirect comparison, exacerbations were listed as an additional efficacy endpoint, whereas in others they were listed as a secondary endpoint.
Inconsistencies in the reported data and the lack of reported data presented a challenge in parameterizing the model. Trough FEV1 formed the key treatment clinical source data, but only short-term comparative data were available. Hence FEV1 data from the long-term UPLIFT trial were used to extrapolate the findings beyond the trial period; this had to be assumed applicable for both treatments compared. Pronounced differences in accrued health benefits were therefore not expected.
A final limitation of this study was the use of health states (COPD severity states) that are in line with a previous (2010) version of the GOLD guidelines. This was due to the lack of published research quantifying utilities, costs, and exacerbation rates according to the new severity classification.
Conclusion
The cost-utility analysis described in the present paper suggests that the use of aclidinium is potentially cost effective compared with tiotropium in the maintenance treatment of moderate-to-severe COPD patients in the US. The precision of this estimation is limited mainly due to the lack of long-term head-to-head trials between the treatments under consideration.
Author contributions
All authors participated in the design and conduct of the study, as well as drafting and revising the manuscript. All authors have provided final approval of the submitted manuscript.
Acknowledgments
The authors would like to acknowledge Shamika de Silva (Medical Writer, MAPI Consultancy) for assistance in drafting the manuscript as well as thank Prescott Medical Communications Group, Chicago, USA for additional editorial support. Financial assistance to support these services was provided by FRI.
Disclosure
This study was conducted by Mapi HEOR and Strategic Market Access on behalf of Forest Research Institute, Inc. (FRI), a wholly owned subsidiary of Forest Laboratories, Inc., which funded the study and the preparation of this manuscript.
Michelle Mocarski is an employee of FRI. Andreas Karabis is an employee of Mapi and served as a paid consultant to FRI during the conduct of this study and the preparation of this manuscript. Indra Eijgelshoven and Gert Bergman worked for Mapi during the conduct of the study but are currently employed by AbbVie and Roche Diagnostics, respectively. AbbVie and Roche Diagnostics were not associated with this study.
References
Vestbo J, Hurd SS, Agusti AG, et al. Global strategy for the diagnosis, management, and prevention of chronic obstructive pulmonary disease: GOLD executive summary. Am J Respir Crit Care Med. 2013;187(4):347–365. | |
Xu W, Collet JP, Shapiro S, et al. Negative impacts of unreported COPD exacerbations on health-related quality of life at 1 year. Eur Respir J. 2010;35(5):1022–1030. | |
Lopez AD, Shibuya K, Rao C, et al. Chronic obstructive pulmonary disease: current burden and future projections. Eur Respir J. 2006;27(2):397–412. | |
Chronic respiratory diseases. Available from: http://www.who.int/gard/publications/chronic_respiratory_diseases.pdf. Accessed August 10, 2012. | |
Chronic obstructive pulmonary disease (COPD) fact sheet. 2013. Available from: http://www.lung.org/lung-disease/copd/resources/facts-figures/COPD-Fact-Sheet.html#note_10. Accessed August 10, 2012. | |
Centers for Disease Control and Prevention (CDC). Deaths from chronic obstructive pulmonary disease – United States, 2000–2005. MMWR Morb Mortal Wkly Rep. 2008;57(45):1229–1232. | |
Foster TS, Miller JD, Marton JP, Caloyeras JP, Russell MW, Menzin J. Assessment of the economic burden of COPD in the US: a review and synthesis of the literature. COPD. 2006;3(4):211–218. | |
Disse B, Speck GA, Rominger KL, Witek TJ Jr, Hammer R. Tiotropium (Spiriva): mechanistical considerations and clinical profile in obstructive lung disease. Life Sci. 1999;64(6–7):457–464. | |
Barr RG, Bourbeau J, Camargo CA, Ram FS. Inhaled tiotropium for stable chronic obstructive pulmonary disease. Cochrane Database Syst Rev. 2005;(2):CD002876. | |
Kesten S, Casaburi R, Kukafka D, Cooper CB. Improvement in self-reported exercise participation with the combination of tiotropium and rehabilitative exercise training in COPD patients. Int J Chron Obstruct Pulmon Dis. 2008;3(1):127–136. | |
Tudorza™ Pressair™ [package insert]. Forest Pharmaceuticals, Inc., St Louis, MO; 2012. | |
Kerwin EM, D’Urzo AD, Gelb AF, Lakkis H, Garcia Gil E, Caracta CF. Efficacy and safety of a 12-week treatment with twice-daily aclidinium bromide in COPD patients (ACCORD COPD I). COPD. 2012;9(2):90–101. | |
Global Initiative for Chronic Obstructive Lung Disease Inc. Global Strategy for the Diagnosis, Management, and Prevention of Chronic Obstructive Lung Disease. Available from: http://www.goldcopd.org/uploads/users/files/GOLDReport_April112011.pdf. Accessed August 21, 2012. | |
Price D, Gray A, Gale R, et al. Cost-utility analysis of indacaterol in Germany: a once-daily maintenance bronchodilator for patients with COPD. Respir Med. 2011;105(11):1635–1647. | |
Rutten-van Molken M, Lee TA. Economic modeling in chronic obstructive pulmonary disease. Proc Am Thorac Soc. 2006;3(7):630–634. | |
Quanjer PH, Tammeling GJ, Cotes JE, Pedersen OF, Peslin R, Yernault JC. Lung volumes and forced ventilatory flows. Report Working Party Standardization of Lung Function Tests, European Community for Steel and Coal. Official Statement of the European Respiratory Society. Eur Respir J Suppl. 1993;16:5–40. | |
Karabis A, Lindner L, Mocarski M, Huisman E, Greening A. Comparative efficacy of aclidinium versus glycopyrronium and tiotropium, as maintenance treatment of moderate to severe COPD patients: a systematic review and network meta-analysis. Int J Chron Obstruct Pulmon Dis. 2013;8:405–423. | |
Tashkin DP, Celli B, Senn S, et al. A 4-year trial of tiotropium in chronic obstructive pulmonary disease. N Engl J Med. 2008;359(15):1543–1554. | |
Hoogendoorn M, Rutten-van Molken MP, Hoogenveen RT, Al MJ, Feenstra TL. Developing and applying a stochastic dynamic population model for chronic obstructive pulmonary disease. Value Health. 2011;14(8):1039–1047. | |
Fuhr R, Magnussen H, Sarem K, et al. Efficacy of aclidinium bromide 400 µg twice daily compared with placebo and tiotropium in patients with moderate to severe COPD. Chest. 2012;141(3):745–752. | |
Rennard SI, Scanlon PD, Ferguson GT, et al. ACCORD COPD II: A randomized clinical trial to evaluate the 12-week efficacy and safety of twice-daily aclidinium bromide in chronic obstructive pulmonary disease patients. Clin Drug Investig. 2013;33(12):893–904. | |
Oostenbrink JB, Rutten-van Molken MP, Monz BU, FitzGerald JM. Probabilistic Markov model to assess the cost-effectiveness of bronchodilator therapy in COPD patients in different countries. Value Health. 2005;8(1):32–46. | |
Arias E. United States life tables, 2007. Natl Vital Stat Rep. 2011; 59(9):1–60. | |
Rutten-van Mölken MPMH, Oostenbrink JB, Tashkin DP, Burkhart D, Monz BU. Does quality of life of COPD patients as measured by the generic EuroQol five-dimension questionnaire differentiate between COPD severity stages? Chest. 2006;130(4):1117–1128. | |
Earnshaw SR, Wilson MR, Dalal AA, et al. Cost-effectiveness of fluticasone propionate/salmeterol (500/50 microg) in the treatment of COPD. Respir Med. 2009;103(1):12–21. | |
Pickard AS, Yang Y, Lee TA. Comparison of health-related quality of life measures in chronic obstructive pulmonary disease. Health Qual Life Outcomes. 2011;9:26. | |
Jones PW, Quirk FH, Baveystock CM. The St George’s Respiratory Questionnaire. Resp Med. 1991;85 Suppl B:25–31. | |
Starkie HJ, Briggs AH, Chambers MG, Jones P. Predicting EQ-5D values using the SGRQ. Value Health. 2011;14(2):354–360. | |
Oba Y. Cost-effectiveness of salmeterol, fluticasone, and combination therapy for COPD. Am J Manag Care. 2009;15(4):226–232. | |
Sun SX, Marynchenko M, Banerjee R, et al. Cost-effectiveness analysis of roflumilast/tiotropium therapy versus tiotropium monotherapy for treating severe-to-very severe COPD. J Med Econ. 2011; 14(6):805–815. | |
Yu AP, Yang H, Wu EQ, Setyawan J, Mocarski M, Blum S. Incremental third-party costs associated with COPD exacerbations: a retrospective claims analysis. J Med Econ. 2011;14(3):315–323. | |
Rutten-van Molken MP, Oostenbrink JB, Miravitlles M, Monz BU. Modelling the 5-year cost effectiveness of tiotropium, salmeterol and ipratropium for the treatment of chronic obstructive pulmonary disease in Spain. Eur J Health Econ. 2007;8(2):123–135. | |
US Bureau of Labor Statistics. Consumer Price Index Detailed Report: Data for December 2011. Available from: http://www.bls.gov/cpi/cpid1112.pdf. Accessed August 21, 2012. | |
The AMCP format for formulary submissions version 3.0. J Manag Care Pharm. 2010;16(1 Suppl A):1–30. | |
Briggs AH, Glick HA, Lozano-Ortega G, et al. Is treatment with ICS and LABA cost-effective for COPD? Multinational economic analysis of the TORCH study. Eur Respir J. 2010;35(3):532–539. | |
Sin DD, Golmohammadi K, Jacobs P. Cost-effectiveness of inhaled corticosteroids for chronic obstructive pulmonary disease according to disease severity. Am J Med. 2004;116(5):325–331. | |
Paterson C, Langan CE, McKaig GA, et al. Assessing patient outcomes in acute exacerbations of chronic bronchitis: the measure your medical outcome profile (MYMOP), medical outcomes study 6-item general health survey (MOS-6A) and EuroQol (EQ-5D). Qual Life Res. 2000;9(5):521–527. | |
Spencer S, Jones PW; GLOBE Study Group. Time course of recovery of health status following an infective exacerbation of chronic bronchitis. Thorax. 2003;58(7):589–593. | |
Red Book® Online. American Academy of Pediatrics. Available from: http://aapredbook.aappublications.org/. Accessed Aug 21, 2012. |
 © 2014 The Author(s). This work is published and licensed by Dove Medical Press Limited. The full terms of this license are available at https://www.dovepress.com/terms.php and incorporate the Creative Commons Attribution - Non Commercial (unported, v3.0) License.
By accessing the work you hereby accept the Terms. Non-commercial uses of the work are permitted without any further permission from Dove Medical Press Limited, provided the work is properly attributed. For permission for commercial use of this work, please see paragraphs 4.2 and 5 of our Terms.
© 2014 The Author(s). This work is published and licensed by Dove Medical Press Limited. The full terms of this license are available at https://www.dovepress.com/terms.php and incorporate the Creative Commons Attribution - Non Commercial (unported, v3.0) License.
By accessing the work you hereby accept the Terms. Non-commercial uses of the work are permitted without any further permission from Dove Medical Press Limited, provided the work is properly attributed. For permission for commercial use of this work, please see paragraphs 4.2 and 5 of our Terms.