")
Back to Journals » International Journal of Chronic Obstructive Pulmonary Disease » Volume 10 » Issue 1
Dynamic hyperinflation and dyspnea during the 6-minute walk test in stable chronic obstructive pulmonary disease patients
Authors Satake M, Shioya T, Uemura S , Takahashi H, Sugawara K, Kasai C, Kiyokawa N, Watanabe T, Sato S, Kawagoshi A
Received 3 September 2014
Accepted for publication 17 November 2014
Published 17 January 2015 Volume 2015:10(1) Pages 153—158
DOI https://doi.org/10.2147/COPD.S73717
Checked for plagiarism Yes
Review by Single anonymous peer review
Peer reviewer comments 5
Editor who approved publication: Dr Richard Russell
Masahiro Satake,1 Takanobu Shioya,1 Sachiko Uemura,1 Hitomi Takahashi,2 Keiyu Sugawara,2 Chikage Kasai,2 Noritaka Kiyokawa,2 Toru Watanabe,2 Sayaka Sato,2 Atsuyoshi Kawagoshi2
1Department of Physical Therapy, Akita University Graduate School of Health Sciences, Akita, Japan; 2Department of Rehabilitation, Akita City Hospital, Akita, Japan
Abstract: The purpose of this study was to investigate the relationship between dynamic hyperinflation and dyspnea and to clarify the characteristics of dyspnea during the 6-minute walk test (6MWT) in chronic obstructive pulmonary disease patients. Twenty-three subjects with stable moderate chronic obstructive pulmonary disease (age 73.8±5.8 years, all male) took part in this study. During the 6MWT, ventilatory and gas exchange parameters were measured using a portable respiratory gas analysis system. Dyspnea and oxygen saturation were recorded at the end of every 2 minute period during the test. There was a significant decrease in inspiratory capacity during the 6MWT. This suggested that dynamic hyperinflation had occurred. Dyspnea showed a significant linear increase, and there was a significant negative correlation with inspiratory capacity. It was suggested that one of the reasons that dyspnea developed during the 6MWT was the dynamic hyperinflation. Even though the tidal volume increased little after 2 minutes, dyspnea increased linearly to the end of the 6MWT. These results suggest that the mechanisms generating dyspnea during the 6MWT were the sense of respiratory effort at an early stage and then the mismatch between central motor command output and respiratory system movement.
Keywords: field walking test, chronic respiratory diseases, respiratory gas analysis, inspiratory capacity, IC, inspiratory reserve volume, IRV, Borg CR-10 scale, COPD
Introduction
The 6-minute walk test (6MWT) is now the most commonly used timed walk test.1,2 It is simple and does not require sophisticated equipment or advanced technical training. In addition, walking is a familiar activity typically performed by even the most severely debilitated patients.2 The assessment of disability in patients with chronic obstructive pulmonary disease (COPD) usually requires the practitioner to estimate the patient’s capacity for exercise. The 6MWT is an examination required to evaluate patients with COPD.3 In the 6MWT, not only the 6 minute walk distance but dyspnea and percutaneous oxygen saturation are generally measured.3,4
We have carried out respiratory gas analysis during the 6MWT before.5 We found that there was no difference in the peak oxygen uptake (V’O2) compared with the incremental cycle ergometer test or the incremental shuttle walking test.5–8 During the 6MWT, V’O2 increased sharply during the first 2 minutes, then showed a steady-state profile from minute 3 to minute 6 of the 6MWT. For the change in V’O2, Troosters et al showed the same results.7 We also measured dyspnea during the 6MWT in a research setting and found that dyspnea increased linearly until the end of the test, unlike the V’O2.
Dynamic hyperinflation (DH) develops in patients with COPD during the 6MWT. DH is one of the causes of dyspnea. We measured the ventilatory volume during the 6MWT and considered the relationship between DH and dyspnea in this study. Although O’Donnell et al considered the relationship between ventilatory volume and dyspnea, they used the bicycle ergometer,9 while we used the 6MWT.
We have so far reported the change of the respiratory gas and the ventilatory volume during the 6MWT in COPD patients. In this paper, we reported that the ventilatory volume increased sharply during the first 2 minutes, then showed a steady-state profile. On the other hand, dyspnea increased linearly to the end of the 6MWT. From this, we measured inspiratory capacity (IC) and decided to examine how dyspnea is related to dynamic pulmonary hyperinflation.
There are some studies that measured and considered DH related to dyspnea before and after the 6MWT, but we cannot find any studies that considered the relationship between DH and dyspnea during the 6MWT. The purpose of this study was to measure respiratory gases during the 6MWT and investigate the relationship between the characteristics of dyspnea in the 6MWT and ventilatory volumes.
Methods
Subjects
The subjects were recruited from among the participants in the pulmonary rehabilitation program at Akita City Hospital. They came to the hospital every 2 weeks and underwent a course of pulmonary rehabilitation. The COPD patients were diagnosed from pulmonary function tests, X-ray film examination, and dyspnea according to Global initiative for chronic Obstructive Lung Disease (GOLD) criteria.10 Exclusion criteria included unstable pulmonary status, orthopedic or cardiovascular complications affecting exercise performance, difficulty in understanding the required tasks, and the necessity for supplemental oxygen during walking. Patients who could not walk without a walking aid and could not visit our hospital every 2 weeks were also excluded. At the time of the study, all patients were clinically stable. The demographic and pulmonary function data are summarized in Table 1. This study was approved by the medical ethics committee of our hospital. All procedures were performed according to the research ethics guidelines of the Declaration of Helsinki.11 The subjects were fully informed of any risks involved in participating in the research program, and their written, informed consent was obtained.
Material and methods
Prior to and throughout the 6MWT, ventilatory and gas exchange parameters were measured using a breath-by-breath system. Subjects were instructed to refrain from eating or drinking any caffeinated products for 2 hours prior to testing.
The 6MWT was carried out in a hospital corridor. The subjects walked along a rectangular track of 88 meters in length (34×10 m). Subjects were instructed to walk as fast as possible for 6 minutes and to cover as much ground as possible in that time. The subjects were given feedback on the elapsed time every minute and encouraged to continue walking.
During the 6MWT, the ventilatory and gas exchange parameters and the heart rate (HR) were measured using a portable metabolic test system (MetaMax 3B, Cortex, Leipzig, Germany). The MetaMax 3B system consisted of a face mask (attached to a volume transducer), a Polar HR chest strap, a transmitter (with expiratory gas analyzing system), and a receiving unit. The transmitter was placed around the subject’s neck, with the two main parts resting on the chest. The equipment, which was carried by the subject, weighed 0.7 kg. The receiver was linked to a personal computer, and MetaSoft (Cortex) was used for data analysis. This apparatus has been previously validated against a conventional stationary instrument.12,13
The ventilatory and gas exchange parameters were measured in the breath-by-breath mode. Using this system, IC was measured every 2 minutes in the standing position during the 6MWT.
Percutaneous oxygen saturation was measured using a pulse oximeter and finger sensor (Pulsox-M24, Teijin, Tokyo, Japan) every minute. This device, designed for ambulatory use and weighing 45 g, was attached to the subject’s wrist. Breathlessness was measured using the Borg category-ratio (CR)-10 scale.14 During the test, subjects described the intensity of breathlessness by pointing to a descriptor on the scale every 2 minutes.
The data were analyzed by one-way repeated measures analysis of variance (ANOVA) and the Bonferroni post hoc test. Relationships between the Borg CR-10 scale and the IC were assessed using Spearman’s rank order correlation and linear regression analysis. Statistical analysis was performed using IBM SPSS Statistics version 19 (IBM Corporation, Armonk, NY, USA). A P-value of <0.05 was considered significant.
Results
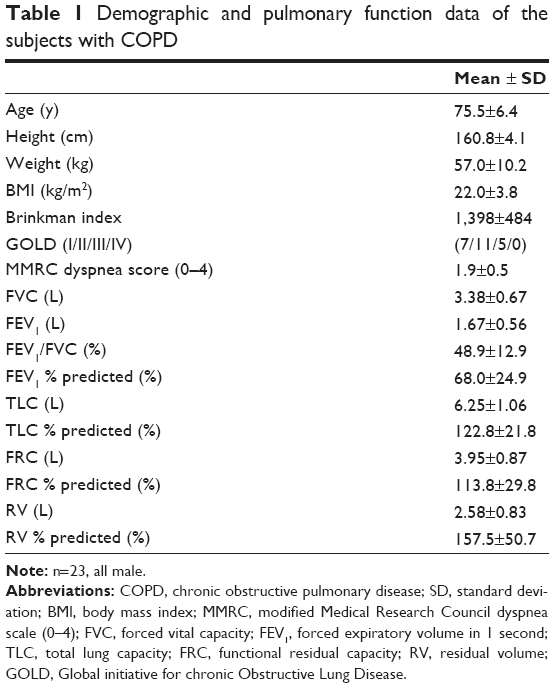
The functional characteristics of the 23 patients with COPD are shown in Table 1. The subjects were all male, their mean age was 75.5 years, and their mean body mass index was 22.0 ±3.8 kg/m2. The mean forced expiratory volume in 1 second/forced vital capacity ratio was 48.9%±12.9%, and the mean forced expiratory volume in 1 second was 68.0% ±24.9% predicted.
 | Table 1 Demographic and pulmonary function data of the subjects with COPD |
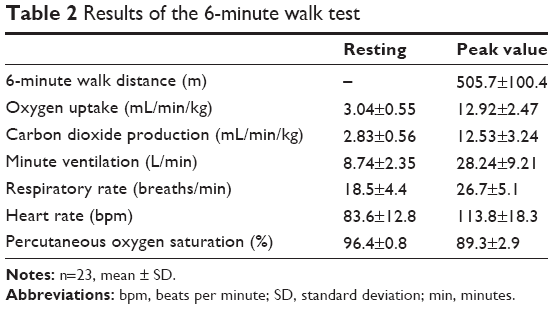
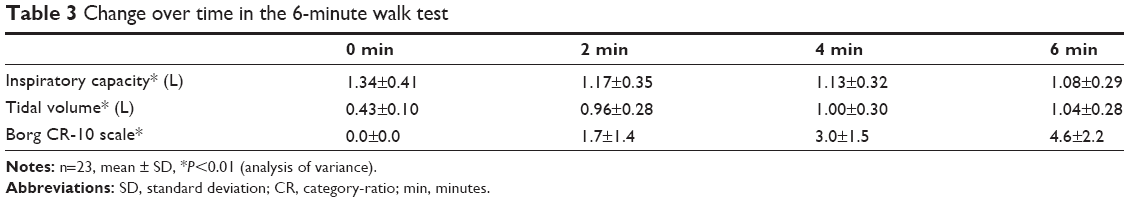
All patients completed this study. No subjects rested during the 6MWT. Results are expressed as means ± standard deviation (Tables 2 and 3). The mean 6 minute walk distance was 505.7±100.4 m. The peak V’O2 was 12.9 ±2.5 mL/min/kg, and carbon dioxide production was 12.5±3.2 mL/min/kg. The changes during the 6MWT in IC, tidal volume (VT), and the Borg CR-10 scale are shown in Table 3. These values were measured in the standing position. IC decreased significantly, and the VT increased significantly during the 6MWT (P<0.01). The Borg CR-10 scale increased significantly in a linear fashion during the 6MWT (P<0.01).
 | Table 2 Results of the 6-minute walk test |
 | Table 3 Change over time in the 6-minute walk test |
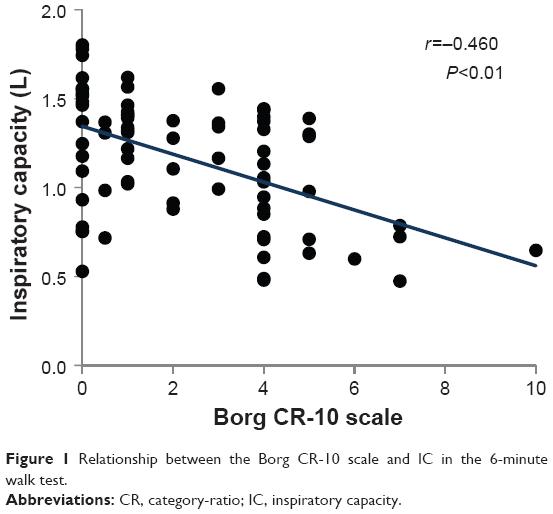
There was a significant, moderate negative correlation between the Borg CR-10 scale and IC (r =0.460, P<0.01) (Figure 1).
 | Figure 1 Relationship between the Borg CR-10 scale and IC in the 6-minute walk test. |
There was no significant correlation between the changes in the Borg CR-10 scale and the changes in IC (r=0.117) (Figure 2).
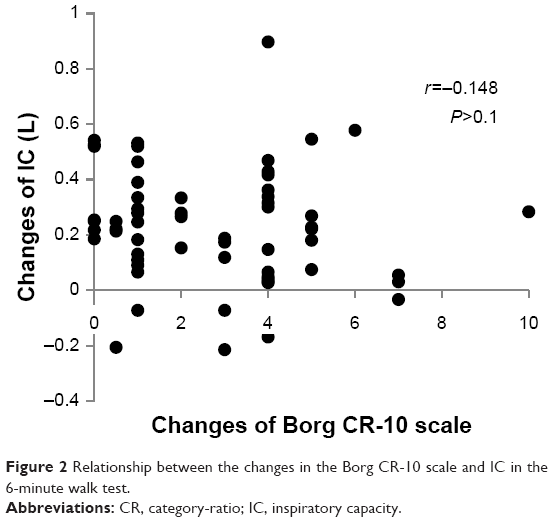 | Figure 2 Relationship between the changes in the Borg CR-10 scale and IC in the 6-minute walk test. |
Figure 3summarizes the VT, inspiratory reserve volume (IRV), and Borg CR-10 scale responses during the 6MWT. The sum of VT and IRV shows IC. IC and the IRV decreased significantly during the 6MWT (P<0.01).
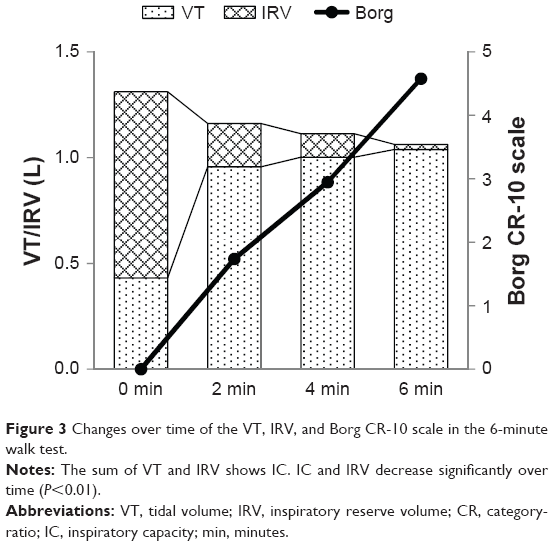 | Figure 3 Changes over time of the VT, IRV, and Borg CR-10 scale in the 6-minute walk test. |
The relationship between the Borg CR-10 scale and IRV during the 6MWT is shown in Figure 4. Although the Borg CR-10 scale increased linearly with exercise time, there was a clear inflection point noted in the Borg CR-10 scale and IRV relationship during the 6MWT. This inflection point occurred at 2 minutes of exercise, and the IRV at this point was 0.20±0.19 L.
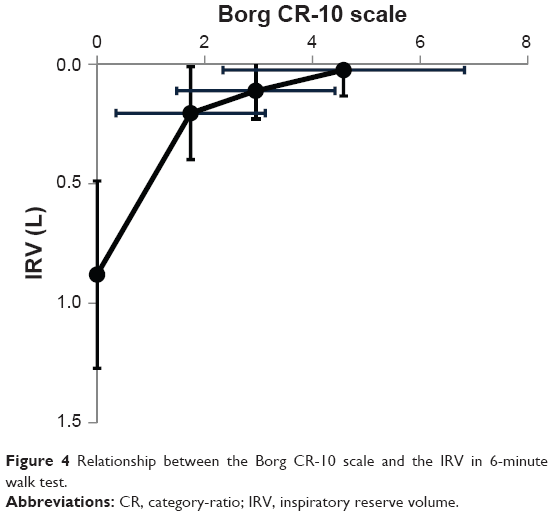 | Figure 4 Relationship between the Borg CR-10 scale and the IRV in 6-minute walk test. |
Discussion
Factors such as airflow limitation and DH have been given as causes of the dyspnea that occurs in COPD patients.3 In DH, the residual volume accumulates because of airflow limitation in COPD due to exercise, and it is expressed as a decrease in IC from a continuous increase in end expiratory lung volume.3,15–20 In this study, stable COPD patients performed the 6MWT, and a significant decrease was seen in IC measured every 2 minutes. This was suggested to be the cause of DH. Dyspnea measured simultaneously using the Borg CR-10 scale showed a significant increase. Since a significant, moderate negative correlation was also seen between IC and the Borg CR-10 scale, DH was suggested to be one cause of the increase in dyspnea in the 6MWT in the present study as well.
Reported measurements of IC in the 6MWT are occasionally seen,21–23 but all show that IC decreases before and immediately after the 6MWT and causes DH. These reports agree with the results of the present study. However, the change in IC during the 6MWT was not measured in any of these reports. Hence, the present study result showing a relationship between the decrease in IC and dyspnea during the 6MWT is an original finding, and it confirms that IC gradually decreases even during the 6MWT.24
DH occurs when respiration is accelerated by exercise or exertion in COPD, decreasing IC.3 Normally, VT is increased during exercise, increasing the necessary V’O2, but in COPD, VT can no longer be increased with decreasing IC, and the respiratory pattern becomes shallow and rapid. O’Donnell et al conducted a constant load test using a cycle ergometer in COPD patients and detected the point at which VT is no longer increased.9 They called the IRV at that point the minimal IRV. They reported that this minimal IRV was seen in the third minute after the start of the test, and that it was 0.5 L. In the present 6MWT with COPD patients, VT showed a rapid increase until 2 minutes after the start of the test, but almost no increase was seen after 2 minutes. The value of IRV, obtained by subtracting VT from IC, also decreased after 2 minutes. The fact that IRV shows a limited volume of maximal inspiration suggests that the amount of air that can be inspired after 2 minutes decreases.25 Minimal IRV was also confirmed in the present study, occurring in the second minute after the start of the test with a value of about 0.2 L.
Dyspnea in the 6MWT increased linearly and significantly in the present study. VT increased significantly. However, the amount of increase after 2 minutes was small. IRV decreased significantly, but the amount of decrease became smaller after 2 minutes.
It is said that there are three mechanisms of dyspnea: the sense of respiratory effort (motor command theory), the afferent information from sensory receptors, and a mismatch between central drive (central motor command output) and mechanical response (sensory feedback from a multitude of mechanoreceptors throughout the respiratory system) (neuromechanical dissociation).9,26 In the relationship between dyspnea and IRV, O’Donnell et al described that the mechanism of dyspnea changed at the minimal IRV.9 They took dyspnea in the early stage of exercise to be correlated with the level of respiratory effort, and dyspnea during this period to be produced from a sense of respiratory effort. In addition, VT did not increase when the minimal IRV was passed after exercise for 3 minutes, and they thought that dyspnea was produced by a mismatch between central drive, in which ventilatory volume does not increase even with effort of breathing, and respiratory system movement.
In the present study with the 6MWT, VT showed a rapid increase until 2 minutes; after 2 minutes, the amount of increase lessened. Thus, it is thought that IRV became smaller, and inspiratory volume approached its limit. In contrast, dyspnea continued to increase linearly until the end of the test. Therefore, in this study the mechanism of dyspnea was also thought to change at around 2 minutes with the 6MWT. The sense of respiratory effort until 2 minutes and dyspnea after 2 minutes are thought to be due to a mismatch between central drive and movement of the respiratory system.
There are several limitations to this study that must be addressed. The number of patients recruited was small, and subjects of this study were all male. As such, additional research with a larger number of patients is required to clarify the significance of changes in patients with COPD. Furthermore, the relationship between DH and dyspnea during the 6MWT was not examined in a normal control group in this study.
Conclusion
In the present study, respiratory gas response during the 6MWT was measured, and the relationship between ventilatory volumes and dyspnea was considered. The results suggested that DH occurred with a significant decrease in IC in the 6MWT. The significant negative correlation between the decrease in IC and the increase in dyspnea was also thought to be a cause of DH with the increase in dyspnea during the 6MWT. The dyspnea increased linearly until the end of the test even though there was almost no increase in VT after 2 minutes, suggesting the mechanism of dyspnea changed from the sense of respiratory effort until 2 minutes to mismatch between central motor command output and movement of the respiratory system after 2 minutes during the 6MWT.
Disclosure
The authors report no conflicts of interest in this work.
References
Elpern EH, Stevens D, Kesten S. Variability in performance of timed walk tests in pulmonary rehabilitation programs. Chest. 2000;118(1):98–105. | ||
Solway S, Brooks D, Lacasse Y, Thomas S. A qualitative systematic overview of the measurement properties of functional walk test used in the cardiorespiratory domain. Chest. 2001;119(1):256–270. | ||
Japan Society for Respiratory Care and Rehabilitation, Japanese Association of Rehabilitation Medicine, Japanese Respiratory Society, Japanese Physical Therapy Association, eds. Pulmonary Rehabilitation Manual – Therapeutic Exercise. 2nd ed, Tokyo: Shorinsha; 2002. | ||
ATS Committee on Proficiency Standards for Clinical Pulmonary Function Laboratories. ATS statement: guidelines for the six-minute walk test. Am J Respir Crit Care Med. 2003;166(1):111–117. | ||
Satake M, Shioya T, Takahashi H, Kawatani M. Ventilatory responses to six-minute walk test, incremental shuttle walking test, and cycle ergometer test in patients with chronic obstructive pulmonary disease. Biomedical research. 2003;24(6):309–316. | ||
Palange P, Forte S, Onorati P, Manfredi F, Serra P, Carlone S. Ventilatory and metabolic adaptations to walking and cycling in patients with COPD. J Appl Physiol (1985). 2000;88(5):1715–1720. | ||
Troosters T, Vilaro J, Rabinovich R, et al. Physiological responses to the 6-min walk test in patients with chronic obstructive pulmonary disease. Eur Resipr J. 2002;20(3):564–569. | ||
Onorati P, Antonucci R, Valli G, et al. Non-invasive evaluation of gas exchange during a shuttle walking test vs a 6-min walking test to assess exercise tolerance in COPD patients, Eur J Appl Physiol. 2003;89(3–4):331–336. | ||
O’Donnell DE, Hamilton AL, Webb KA. Sensory-mechanical relationships during high-intensity, constant-work-rate exercise in COPD. J Appl Physiol (1985). 2006;101(4):1025–1035. | ||
Global Initiative for Chronic Obstructive Lung Disease. Global Strategy for the Diagnosis, Management and Prevention of Chronic Obstructive Pulmonary Disease – Executive Summary. Geneva, Switzerland: Heart, Lung, and Blood Institute, World Health Organization; 2003. Available from: http://www.who.int/respiratory/copd/GOLD_WR_06.pdf. Accessed Oct 10, 2014. | ||
World Medical Association. World Medical Association Declaration of Helsinki: ethical principles for medical research involving human subjects. JAMA. 2013;310(20):2191–2194. | ||
Faggiano P, DAloia A, Gualeni A, Lavatelli A, Giordano A. Assessment of oxygen uptake during the 6-minute walking test in patients with heart failure: Preliminary experience with a portable device. Am Heart J. 1997;134(2 Pt 1):203–206. | ||
Schulz H, Helle S, Heck H. The validity of the telemetric system cortex x1 in the ventilatory and gas exchange measurement during exercise. Int J Sports Med. 1997;18(6):454–457. | ||
Borg GA. Psychophysical basis of perceived exertion. Med Sci Sports Exerc. 1982;14(5):377–381. | ||
Diaz O, Villafranca C, Ghezzo H, et al. Role of inspiratory capacity on exercise tolerance in COPD patients with and without tidal expiratory flow limitation at rest. Eur Respir J. 2000;16(2):269–275. | ||
O’Donnell DE, Revill SM, Webb KA. Dynamic hyperinflation and exercise intolerance in chronic obstructive pulmonary disease. Am J Respir Crit Care Med. 2001;164(5):770–777. | ||
O’Donnell DE, Lam M, Webb KA. Measurement of symptoms, lung hyperinflation, and endurance during exercise in chronic obstructive pulmonary disease. Am J Respir Crit Care Med. 1998;158(5 Pt 1):1557–1565. | ||
O’Donnell DE, Webb KA. Exertional breathlessness in patients with chronic airflow limitation. The role of lung hyperinflation. Am Rev Respir Dis. 1993;148(5):1351–1357. | ||
Belman MJ, Botnick WC, Shin JW. Inhaled bronchodilators reduce dynamic hyperinflation during exercise in patients chronic obstructive pulmonary disease. Am J Respir Crit Care Med. 1996;153(3):967–975. | ||
Thomas M, Decramer M, O’Donnell DE. No room to breathe: the importance of lung hyperinflation in COPD. Prim Care Respir J. 2013;22(1):101–111. | ||
Marin JM, Carrizo SJ, Gascon M, Sanchez A, Gallego B, Celli BR. Inspiratory capacity, dynamic hyperinflation, breathlessness, and exercise performance during the 6-minute-walk test in chronic obstructive pulmonary disease. Am J Respir Crit Care Med. 2001;163(6):1395–1399. | ||
Callens E, Graba S, Gillet-Juvin K, et al. Measurement of dynamic hyperinflation after a 6-minute walk test in patients with COPD. Chest. 2009;136(6):1466–1472. | ||
Zafar MA, Tsuang W, Lach L, Eschenbacher W, Panos RJ. Dynamic hyperinflation correlates with exertional oxygen desaturation in patients with chronic obstructive pulmonary disease. Lung. 2013;191(2):177–182. | ||
Satake M, Takahashi H, Sugawara K, et al. Inhibitory effect of procaterol on exercise dynamic lung hyperinflation during the 6-min walk test in stable patients with chronic obstructive pulmonary disease. Arzneimittelforschung. 2011;61(1):8–13. | ||
Kurosawa H, Toga H. Spirometry and lung function. In: Japanese Respiratory Society eds. Clinical respiratory function test. 7th ed. Osaka: Medical Review; 2008:9–23. | ||
Izumizaki M. Mechanism of dyspnea. In: Shioya T, Takahashi H. Practical technique in respiratory care. 3rd ed. Tokyo: Medical View; 2011:2–8. |
 © 2015 The Author(s). This work is published and licensed by Dove Medical Press Limited. The full terms of this license are available at https://www.dovepress.com/terms.php and incorporate the Creative Commons Attribution - Non Commercial (unported, v3.0) License.
By accessing the work you hereby accept the Terms. Non-commercial uses of the work are permitted without any further permission from Dove Medical Press Limited, provided the work is properly attributed. For permission for commercial use of this work, please see paragraphs 4.2 and 5 of our Terms.
© 2015 The Author(s). This work is published and licensed by Dove Medical Press Limited. The full terms of this license are available at https://www.dovepress.com/terms.php and incorporate the Creative Commons Attribution - Non Commercial (unported, v3.0) License.
By accessing the work you hereby accept the Terms. Non-commercial uses of the work are permitted without any further permission from Dove Medical Press Limited, provided the work is properly attributed. For permission for commercial use of this work, please see paragraphs 4.2 and 5 of our Terms.