")
Back to Journals » International Journal of Nanomedicine » Volume 10 » Issue 1
Dual-color immunofluorescent labeling with quantum dots of the diabetes-associated proteins aldose reductase and Toll-like receptor 4 in the kidneys of diabetic rats
Authors Liu X, Hu R, Lian H, Liu Y, Liu J, Liu J, Lin G, Liu L, Duan X, Yong K, Ye L
Received 22 January 2015
Accepted for publication 17 March 2015
Published 20 May 2015 Volume 2015:10(1) Pages 3651—3662
DOI https://doi.org/10.2147/IJN.S81395
Checked for plagiarism Yes
Review by Single anonymous peer review
Peer reviewer comments 5
Editor who approved publication: Professor Lei Yang
Xiaomin Liu,1,* Rui Hu,2,* Hongwei Lian,1,3 Yang Liu,4 Jing Liu,1 Jianwei Liu,1 Guimiao Lin,5 Liwei Liu,6 Xiaojian Duan,1 Ken-Tye Yong,2 Ling Ye1
1Institute of Gerontology and Geriatrics, Chinese PLA General Hospital, Beijing Key Lab of Aging and Geriatrics, Beijing, People’s Republic of China; 2School of Electrical and Electronic Engineering, Nanyang Technological University, Singapore, Singapore; 3Department of Emergency Medicine, Peking University Third Hospital, Beijing, 4Department of Geriatric Nephrology, Chinese PLA General Hospital, Beijing, 5Key Lab of Biomedical Engineering, School of Medical Sciences, Shenzhen University, Shenzhen, 6School of Science, Changchun University of Science and Technology, Changchun, People’s Republic of China
*These authors contributed equally to this work
Abstract: Diabetes is one of the major chronic diseases diagnosed worldwide with a common complication of diabetic nephropathy (DN). There are multiple possible mechanisms associated with DN. Aldose reductase (AR) and Toll-like receptor 4 (TLR4) may be involved in the occurrence and development of DN. Here, we describe the distribution of AR and TLR4 in cells and renal tissues of diabetic rats through a quantum dot (QD)-based immunofluorescence technique and conventional immunohistochemistry. As a new type of nanosized fluorophore, QDs have been recognized in imaging applications and have broad prospects in biomedical research. The results of the reported study demonstrate that both the AR and the TLR4 proteins were upregulated in the renal tissues of diabetic rats. Further, to explore the relationship between AR and TLR4 in the pathogenesis of DN, a dual-color immunofluorescent labeling technique based on QDs was applied, where the expressions of AR and TLR4 in the renal tissues of diabetic rats were simultaneously observed – for the first time, as far as we are aware. The optimized QD-based immunofluorescence technique has not only shown a satisfying sensitivity and specificity for the detection of biomarkers in cells and tissues, but also is a valuable supplement of immunohistochemistry. The QD-based multiplexed imaging technology provides a new insight into the mechanistic study of the correlation among biological factors as well as having potential applications in the diagnosis and treatment of diseases.
Keywords: diabetic nephropathy, TLR4, immunofluorescence, immunohistochemistry
Introduction
Diabetes is one of the major chronic diseases worldwide and can have a serious impact on human health.1 Prolonged exposure to chronic hyperglycemia without timely and effective treatment can ultimately induce various complications affecting the cardiovascular, renal, neurological, and visual systems. The complications are the main cause of morbidity and mortality in diabetic patients. Due to the increasing prevalence of diabetes, diabetic nephropathy (DN) is the major renal complication and the primary cause of end-stage renal disease.2 The pathogenesis of DN still remains unclear; multiple possible mechanisms are thought to be associated with it, including advanced glycation end products, protein kinase C, the polyol pathway, inflammatory cytokines, and the unifying mechanism of superoxide production.3 Therefore, it is crucial to explore the relationship between the various mechanisms.
Among these mechanisms, the polyol pathway has been extensively studied. Aldose reductase (AR) is a key enzyme in the polyol pathway that catalyzes the nicotinamide adenine dinucleotide phosphate, reduced (NADPH)-dependent conversion of glucose to sorbitol.4 It has low affinity for glucose under normal glycemic conditions, while the activity is elevated in hyperglycemic conditions. Hyperglycemia can activate glucose flux through the polyol pathway, in which AR accelerates glucose to sorbitol and NADPH to nicotinamide adenine dinucleotide phosphate (NADP+).3,5,6 The excessive accumulation of sorbitol and NADP+ increases oxidative stress and cell osmotic pressure which eventually induce cellular damage.7,8 As it is thought that AR plays an important role in the development of chronic diabetic complications, much attention has been focused on this enzyme.9
Toll-like receptors (TLRs), as a family of receptors in the innate immune system, trigger the signal transduction pathways through regulating the expression of proinflammatory cytokines and chemokines which are known to participate in the pathogenesis of DN.10 Among the family of TLRs, the role and implications of Toll-like receptor 4 (TLR4) in diabetes have attracted much attention. The TLR4 signaling pathway can induce the upregulation of nuclear factor-kappa B (NF-κB), and consequently lead to the release of inflammatory mediators causing inflammation.11 Recently, some evidence has indicated that the expression of TLR4 is elevated in the human diabetic kidney and the renal tissues of the streptozotocin (STZ)-induced diabetic mouse.12,13
The diagnosis and exploration of the many diseases depend on the detection and discovery of biomarkers. Previous studies usually focused on the assessment of AR activity. Localization and the visual expression of AR in cells or tissues were rarely reported. Most studies detected the expression of TLR4 with conventional immunohistochemistry (IHC),14 which is well-established for cell and tissue imaging. However, the quantification of multiple biomarkers simultaneously is limited in conventional IHC. Further, conventional IHC uses 3,3′-diaminobenzidine (DAB) to label the expression sites of biomarkers, and DAB staining intensity depends on reaction time, temperature and the concentration of the horseradish peroxidase substrate. Therefore, the quantitative detection sensitivity is bound to be influenced, resulting in subjective diagnosis results. Fluorescence-based imaging may offer a better solution to IHC in labeling multiple signals with different colors. Nevertheless, to achieve multiple labeling using conventional organic fluorescent dyes, which have narrow excitation and broad emission spectra, requires complicated optical microscopy systems. In addition, their fluorescence is easy to quench, which makes it impractical to view molecular signals repeatedly over time.15,16 Thus, it is meaningful to seek a new fluorophore with excellent optical properties for achieving the detection of multiple biomarkers using spectral imaging.
Quantum dots (QDs) are a novel class of inorganic fluorescent nanomaterial, which have great potential in biological imaging.17,18 QDs are semiconductor nanocrystals with diameters in the order of 2–10 nm, which emit fluorescence depending on their size. Compared with conventional organic dyes and fluorescent proteins, QDs have unique optical properties such as broad absorption spectra, narrow and symmetrical emission spectra, superior signal brightness, and resistance to photobleaching.19,20 At present, QD-based immunofluorescence imaging has become a trend for biological detection, especially for the detection of multiple biomarkers in cell biology and in vivo imaging.21–23
The aim of the study reported here was to investigate the roles of AR and TLR4 in the development of DN and compare the techniques of quantum dot-based immunohistochemistry (QD-IHC) and conventional IHC for the detection of AR and TLR4 in cells and tissues. Meanwhile, we also set up a QD-based double-color labeling method for imaging the expression of AR and TLR4 in diabetic rat renal tissues simultaneously to explore their relationship. In this work, we were delighted to find that QD-based IHC is more convenient and has a satisfying effect in cell and tissue imaging. An important finding is that the levels of AR and TLR4 were upregulated in diabetic rat renal tissues which suggests AR is implicated in inflammation and renal insufficiency. The results not only provide new insights into the pathogenesis of DN but also demonstrate that the QD-based multiplex-staining IHC is a powerful platform for studying the relationships among biomarkers.
Materials and methods
Conjugation of QDs with AR antibody and TLR4 antibody
CdSe/CdS/ZnS quantum dots with the emission wavelength of 620 nm (QDs-620) were obtained as reported previously.24 For the bioconjugation of QDs, 5 μL of 1 mg/mL QD-620 solution was mixed with 40 μL of 0.5 mg/mL 1-ethyl-3-(3-dimethylaminopropyl) carbodiimide (EDC) solution (Thermo Fisher Scientific, Waltham, MA, USA) and gently stirred for 2–3 minutes, with a total of five samples prepared. Mouse monoclonal AR antibody (Ab) solution (1 μL to 5 μL of 200 μg/mL; Santa Cruz Biotechnology Inc., Dallas, TX, USA) and the appropriate amount of double-distilled water were added into the five mixtures to make a total volume of 50 μL and gently stirred. Then they were incubated at room temperature for 2 hours to allow the Ab to covalently bind to the QDs-620.
QDs-620 conjugated with rabbit polyclonal TLR4 Ab (Boster Biotechnology Co Ltd, Wuhan, Hubei, People’s Republic of China) was prepared using the same methods. Five different ratios of QD–anti-AR conjugates and QD–anti-TLR4 conjugates were prepared. Agarose gel electrophoresis was used to detect the effect of the conjugates. Furthermore, immunofluorescence and IHC were used to confirm their functions in cells and tissues.
Agarose gel electrophoresis
Gels 0.5 cm thick were prepared from 1% agarose v/v in 1× TAE buffer (40 mM Tris, 40 mM acetate, 1 mM ethylenediaminetetraacetic acid [EDTA]; pH 8.3). A 10 μL amount of the conjugates, 1 μL of 1 mg/mL QD solution, and 1 μL of primary Ab stock solution were mixed with a moderate sample buffer, and the mixtures were loaded into the sample wells on agarose gels in Tris–Tricine sample buffer (Bio-Rad Laboratories Inc, Hercules, CA, USA). The electrophoresis was run at 100 V for 20 minutes in 1× TAE buffer at room temperature and imaged by ultraviolet excitation with the gel-imaging system (Tanon Science and Technology Co, Shanghai, People’s Republic of China). Then the gel was stained with Coomassie Brilliant Blue and imaged with a charge-coupled device (CCD) camera (Kodak, Rochester, NY, USA).
Transient transfection of COS-7 cells
African green monkey kidney fibroblast-like cells (COS-7 cells) (American Type Culture Collection, Manassas, VA, USA) were cultured at 37°C, 5% CO2 in Dulbecco’s Modified Eagle’s Medium (Gibco®; Thermo Fisher Scientific) supplemented with 5% fetal bovine serum (Gibco, Thermo Fisher Scientific). The day before transfection, 2×10⁵ COS-7 cells were seeded on coverslips in 35 mm cell-culture dishes. One hour before transfection, the complete cell medium was replaced with serum-free Dulbecco’s Modified Eagle’s Medium when the cells achieved a confluence of 60%–80%. Cells were transfected with plasmid-named pHAR (constructed in our laboratory25), which contains the human AR gene, using transfection reagent (Vigorous Biotechnology Beijing Co., Ltd, Beijing, People’s Republic of China). In addition, another group of the same cells was transfected with pHAG (constructed in our laboratory25) containing the human AR gene and the EGFP reporter gene – the latter was used for evaluating the transfection efficiency by flow cytometry and fluorescence microscopy. At 24 hours after transfection, the cells were imaged by Olympus IX71 Fluorescence Microscope (Olympus Corporation, Tokyo, Japan), and the transfection efficiency was detected by IHC and flow cytometry.
Cell immunohistochemistry and flow cytometry
The transfected cells were fixed and permeabilized with 4% formaldehyde and 0.1% Triton™ X-100 at room temperature for 10 minutes. After washing with phosphate-buffered saline (PBS) three times, the cells were blocked with 10% goat serum at 37°C for 30 minutes and incubated with AR Ab solution (diluted 1:200 with the Ab diluent) overnight at 4°C. The following steps were performed according to the instructions of the streptavidin (SA)/peroxidase kit used (SP-9002; Beijing Zhongshan Biotechnology Limited Company [ZSBIO], Beijing, People’s Republic of China). Finally, the cells were stained with DAB chromogenic agent (Sigma-Aldrich Co, St Louis, MO, USA). Cells transfected with empty vectors in another parallel experiment were set as the control group.
The cells transfected with pHAG plasmid in 35 mm cell-culture dishes were collected in a centrifuge tube and centrifuged at 1,500 rpm for 5 minutes. Afterwards, the cells were resuspended in PBS, and the expression of EGFP gene and AR gene was detected by flow cytometry (Becton, Dickinson and Company, Franklin Lakes, NJ, USA).
Cell QD immunofluorescence
The procedures before incubating the primary antibodies were the same as those for the cell IHC. After permeabilization, the cells were incubated with QD–anti-AR conjugates (the QD concentration was 10 μg/mL) for 2 hours at 37°C. Finally, cells were stained with 4′,6-diamidino-2-phenylindole (DAPI) that had specific affinity to nuclei for 5 minutes then washed with PBS. The Ab internalization was directly examined under a fluorescence microscope after mounted by 90% glycerin.
Another QD immunofluorescence method was to use quantum dots with an emission wavelength of 605 nm (QDs-605) conjugated to streptavidin (QD–SA; Wuhan Jiayuan Quantum Dot Technological Development Co., Ltd., Wuhan, Hubei, People’s Republic of China) to label cells. Briefly, after permeabilization, the cells were washed with PBS and covered with 10% goat serum for 30 minutes at 37°C. Next, the cells were incubated with AR Ab for 2 hours at 37°C before being washed with PBS, then incubated with biotinylated anti-mouse immunoglobulin G (IgG; 1:400 dilution, Wuhan Jiayuan) for 30 minutes at 37°C. For the QD conjugation, the cells were stained with QD–SA (1:200 dilution) for 30 minutes at 37°C then washed three times with PBS. After staining the nuclei with DAPI, the cells were sealed with 90% glycerin.
The positive signals of the cells were detected with the Olympus IX71 Fluorescence Microscope equipped with an Olympus DP72 camera (Olympus Corporation) and imaged with CCD software.
Diets and STZ-induced DN
Male Sprague Dawley® rats aged 12 weeks old were provided by the Animal Center of the Chinese PLA General Hospital. The animals were acclimatized for 1 week before experiments. Rats were divided into a control group (CON, n=10), fed a standard chow diet (STD, 15% of calories), and a diabetic group (DM, n=7), fed a high-fat diet (HFD, 40% of calories). After 5 weeks on the HFD, the HFD rats received a single injection of 35 mg/kg dose of STZ (Sigma-Aldrich Co) dissolved in citrate buffer. Simultaneously, the control rats received citrate buffer alone. Two days later, random blood glucose was measured in duplicate from tail-vein blood using a glucometer (Roche Holding AG, Basel, Switzerland). Rats with random blood glucose >16.7 mmol/L were considered diabetic. All animals were continuously observed 12 weeks after STZ administration. At the end of experiment, the two groups of animals were anesthetized, and the kidneys were excised and fixed in formaldehyde. After washing in ethanol and xylol several times, the samples were embedded in paraffin wax and 4 μm thick sections were prepared for subsequent analysis.
Hematoxylin and eosin staining
Kidney sections were baked at 80°C in a hot oven for 20 minutes then de-waxed in xylol for 10 minutes three times and rehydrated in gradient alcohol for 5 minutes four times. Sections were stained with hematoxylin solution (Sigma-Aldrich Co) for 5 minutes and eluted with 1% hydrochloric acid in ethanol for 20 seconds, then rinsed with tap water for several minutes until they turned blue. Next, sections were stained with eosin solution (Beijing ZSBIO) for 2 minutes and washed. Finally, after dehydration and mounting, sections were observed by Olympus IX71 microscope using the Olympus DP72 camera.
IHC
Briefly, renal sections were de-waxed and rehydrated in xylol and alcohol solutions at different concentrations. Antigen retrieval of tissue sections was performed by boiling sections in a microwave in citric acid, pH 6.0. Endogenous peroxidase activity was quenched with 3% hydrogen peroxidase. Thereafter, sections were incubated with 10% goat serum to prevent nonspecific binding. The sections were then incubated with mouse AR Ab dilution (1:200), or rabbit TLR4 Ab dilution (1:100) overnight at 4°C. After three rinses with PBS for 3 minutes, the sections were incubated with mouse or rabbit biotinylated IgG kit (Beijing ZSBIO) for 30 minutes at 37°C. Followed by three washes with PBS, sections were successively incubated with SA peroxidase for 30 minutes at 37°C and stained with DAB. Finally, followed by staining the nuclei with hematoxylin, the sections were dehydrated and sealed.
The procedures of QD-IHC were basically as follows. The de-waxing, rehydrating, and antigen retrieval steps were the same as those just described. Then sections were incubated with 10% goat serum for 30 minutes at 37°C but not incubated with 3% hydrogen peroxidase. Another difference was that after incubation with AR Ab dilution (1:200), or TLR4 Ab dilution (1:100) overnight at 4°C and rinsing with PBS, the sections were incubated with corresponding biotinylated IgG (1:400) for 30 minutes at 37°C. Successively, sections were rinsed with PBS and stained with QDs-605 conjugated to SA (1:200 diluted in 2% bovine serum albumin) for 30 minutes at 37°C. Finally sections were washed three times with PBS and sealed with 90% glycerin.
For the QD–Ab conjugate IHC, the steps before incubating the primary Ab were the same as for QD–SA IHC. After incubation with 10% goat serum, sections were incubated with QD–anti-TLR4 conjugates directly. Then the sections were washed three times with PBS and sealed with 90% glycerin.
The concrete steps of the three IHC are listed in Table 1. All sections were photographed with an Olympus IX71 microscope using the Olympus DP72 camera and imaged with CCD software.
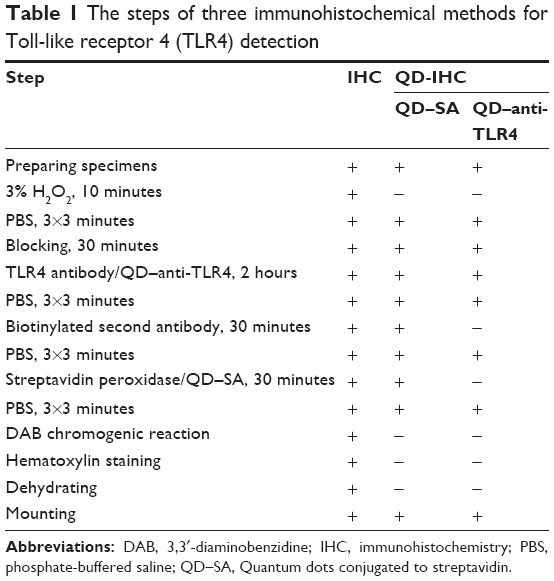 | Table 1 The steps of three immunohistochemical methods for Toll-like receptor 4 (TLR4) detectionAbbreviations: DAB, 3,3′-diaminobenzidine; IHC, immunohistochemistry; PBS, phosphate-buffered saline; QD–SA, Quantum dots conjugated to streptavidin. |
Dual-color immunofluorescent labeling with QDs
The primary antibodies were mouse monoclonal AR Ab and rabbit polyclonal TLR4 Ab. The QDs probes were QDs-605 conjugated anti-mouse IgG and QDs-525 conjugated to SA (QD–SA, Wuhan Jiayuan). For multiplexed QD staining, a mixture of two primary antibodies from two species was used to recognize two antigens in the same tissue section. A mixture of two QD probes was applied to stain the corresponding antibodies for 1 hour at 37°C. The sections were imaged on an Olympus IX71 microscope using the Olympus DP72 camera. The QDs-525 and QDs-605 were excited by ultraviolet light.
Results
Conjugation of QDs-620 with AR Ab and TLR4 Ab
In order to find the optimal conjugate ratio of QDs-620 to Ab, five different QD:Ab ratios from 5:1 to 5:5 were set up. We used agarose gel electrophoresis (Figure 1) to detect the effect of the QD–Ab conjugates. The red fluorescent signals from the QDs show that the QD–Ab conjugates obviously (Lines 2 to 6) lag behind the red bands of the QDs alone (Figure 1Aa and Ba). Meanwhile, the protein bands in gels stained by Coomassie Brilliant Blue (Figure 1Ab and 1Bb) are in the same position as the red fluorescent signals from the QD–Ab conjugates (Figure 1Aa and 1Bb). The results suggest that the QDs-620 were successfully conjugated with AR and TLR4 antibodies. Moreover, for the five different QD:AR ratios (Figure 1Aa), we can see the red bands in Line 2 (QD:AR =5:1) and Line 3 (QD:AR =5:2) are less intensive and more diffuse than in Lines 4 to 6. This indicates that there were unconjugated QDs in the QD–anti-AR conjugates at 5:1 and 5:2 ratios. As a result, a QD:AR ratio of 5:3 was chosen as the optimal conjugate ratio for the conjugation of QDs-620 with AR Ab. Similarly, the QD:TLR4 ratio of 5:2 was the optimal conjugate ratio for the conjugation of QDs-620 with TLR4 Ab.
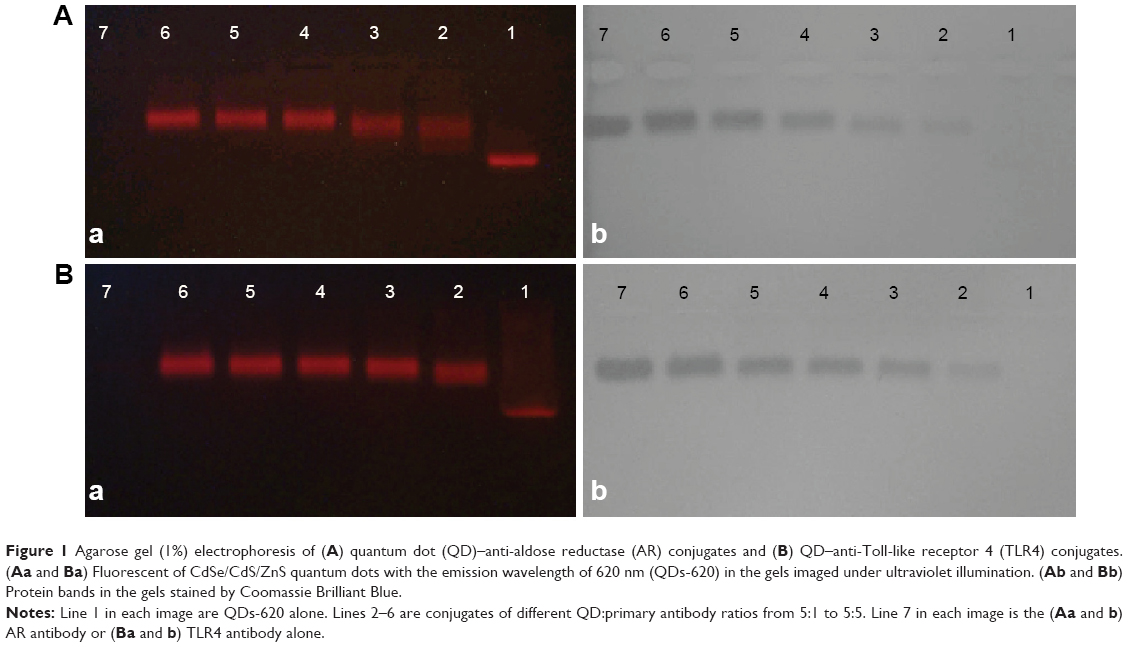 |
Figure 1 Agarose gel (1%) electrophoresis of (A) quantum dot (QD)–anti-aldose reductase (AR) conjugates and (B) QD–anti-Toll-like receptor 4 (TLR4) conjugates. (Aa and Ba) Fluorescent of CdSe/CdS/ZnS quantum dots with the emission wavelength of 620 nm (QDs-620) in the gels imaged under ultraviolet illumination. (Ab and Bb) Protein bands in the gels stained by Coomassie Brilliant Blue. |
Expression of AR labeled with QDs in living cells
In this study, we constructed a cell model with high expression of AR through transfecting plasmid pHAR into COS-7 cells. The brown positive signals in Figure 2A show the expression of AR in transfected cells. In contrast, no positive signal was detected in the control group transfected with the empty vector (Figure 2B). In order to visually assess the transfection efficiency of plasmid pHAR more directly, another group of the same cells was transfected with plasmid pHAG containing AR gene and EGFP fusion gene. The rich green fluorescent signals in cells which transfected with pHAG can be observed in Figure 2C. Moreover, with flow cytometry analysis, the gene transfection efficiency was measured to be 53.73%. On the whole, the results suggest that a high AR expression cell model was successfully constructed.
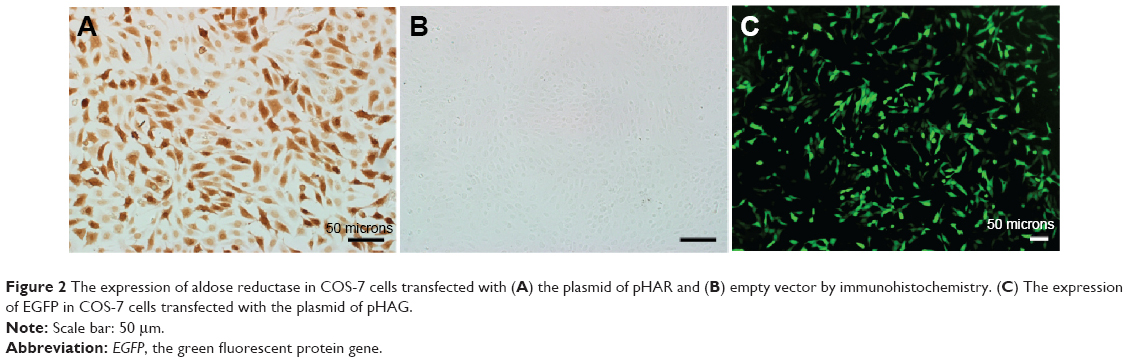 |
Figure 2 The expression of aldose reductase in COS-7 cells transfected with (A) the plasmid of pHAR and (B) empty vector by immunohistochemistry. (C) The expression of EGFP in COS-7 cells transfected with the plasmid of pHAG. |
Figure 3 compares two different QD-based immunofluorescence methods used to label the AR expression in cells, where two different QD conjugates, QDs-605 conjugated to streptavidin (QD–SA, Figure 3A) and QD620 conjugated to anti-AR (QD–anti-AR, Figure 3B), were used. The red signals in Figure 3A and B not only show high expression of AR in the cells, but also reveal its expression located in the cells’ cytoplasm and membrane, while there are no red signals in Figure 3C. In addition, the red signals distributed in Figure 3A are more uniform than the red signals in Figure 3B. As a comparison, the technological process of QD–SA requires a longer time and more steps than that of the QD–anti-AR conjugates, but has better specificity and labeling effect.
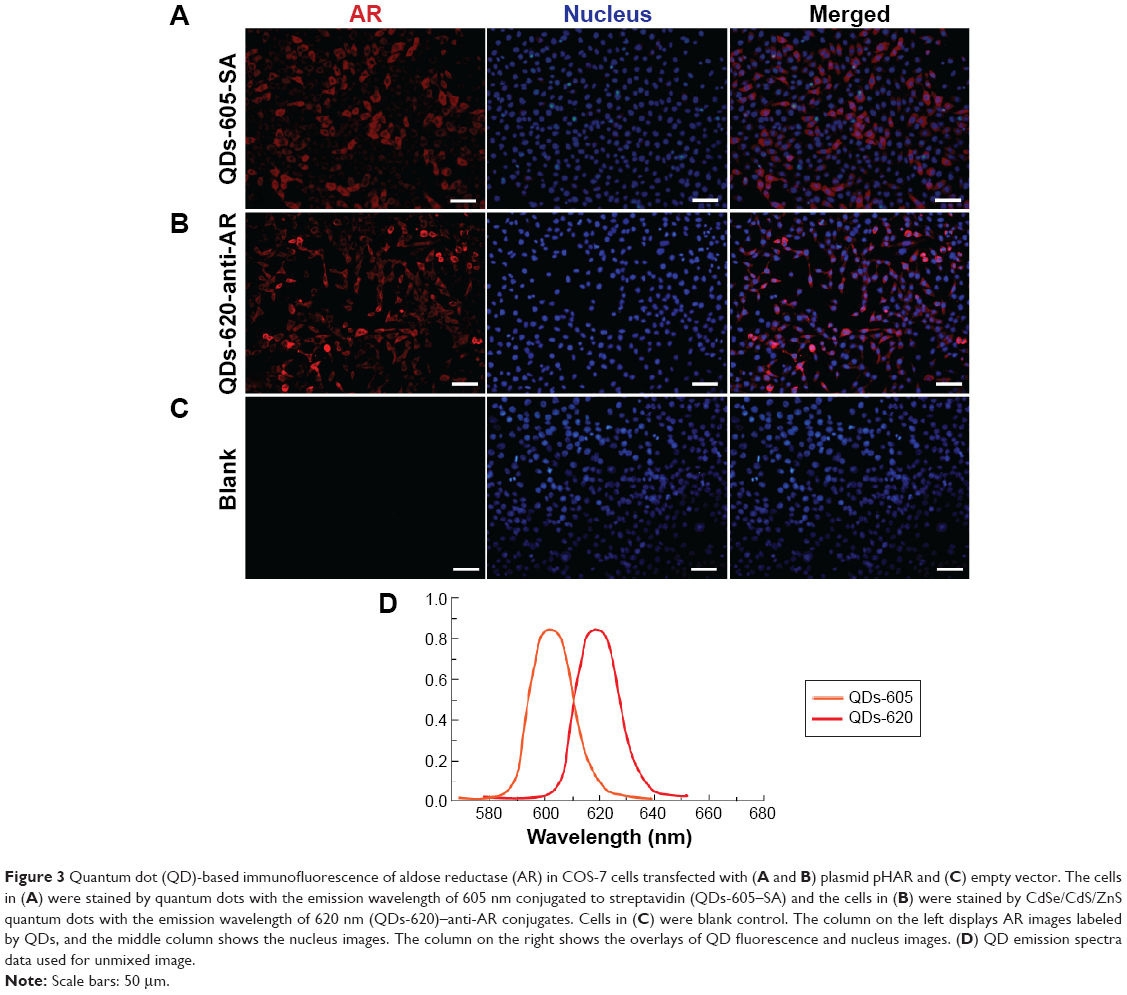 |
Figure 3 Quantum dot (QD)-based immunofluorescence of aldose reductase (AR) in COS-7 cells transfected with (A and B) plasmid pHAR and (C) empty vector. The cells in (A) were stained by quantum dots with the emission wavelength of 605 nm conjugated to streptavidin (QDs-605–SA) and the cells in (B) were stained by CdSe/CdS/ZnS quantum dots with the emission wavelength of 620 nm (QDs-620)–anti-AR conjugates. Cells in (C) were blank control. The column on the left displays AR images labeled by QDs, and the middle column shows the nucleus images. The column on the right shows the overlays of QD fluorescence and nucleus images. (D) QD emission spectra data used for unmixed image. |
Expression of TLR4 and AR in renal tissues of rats
In order to explore the pathogenesis of DN, a type 2 diabetes mellitus rat model was established by feeding rats a HFD and administering them a low-dose STZ injection. The general conditions (blood glucose, weight, proteinuria, and so on) of rats and the renal pathological changes were detected to verify whether the model succeeded or not. Compared with the normal control rats, higher blood glucose, lower weight, and severe proteinuria were observed in the HFD–STZ-induced diabetic rats. Moreover, as shown in Figure 4, the diabetic rats exhibited glomerular enlargement (Figure 4A, red arrow) and mesangial matrix expansion – notably, the most obvious change was the tubules which experienced swelling and extensive vacuolar degeneration (Figure 4B, black arrow). This indicates that the diabetic rat model was established successfully and early renal pathological changes could be found in the diabetic rats.
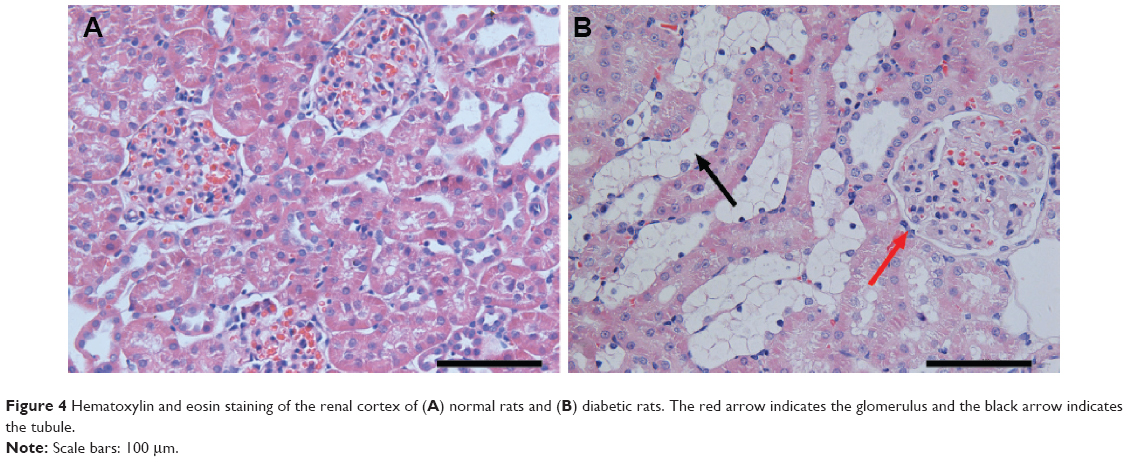 | Figure 4 Hematoxylin and eosin staining of the renal cortex of (A) normal rats and (B) diabetic rats. The red arrow indicates the glomerulus and the black arrow indicates the tubule. |
TLR4 expression was examined in some paraffin-embedded sections of rats’ renal tissues by conventional IHC and QD immunofluorescence. Strong brown positive signals of TLR4 in the renal cortex tubules, predominantly in the tubules which experienced swelling and extensive vacuolar degeneration, were detected in tissues from diabetic rats (Figure 5D), but little staining was observed in tissues from the control group (Figure 5A). In order to verify the labeling effect of QD immunofluorescence intuitively, renal tissue sections from the same rats were assessed for the expression of TLR4 by IHC staining with DAB, QD–SA, and QD–anti-TLR4 conjugates. In addition, the same visual fields of the renal tissue sections stained using the different three methods were selected for imaging evaluations. The results show that the expression of TLR4 stained by both QD–SA (Figure 5B and E) and QD–anti-TLR4 conjugates (Figure 5C and F) were completely consistent with conventional IHC in the expression sites, with similar intensity. These results suggest that the expression level of TLR4 protein in DN was upregulated and the QD-based immunofluorescence displays a satisfying effect, with lower nonspecific staining compared to conventional IHC.
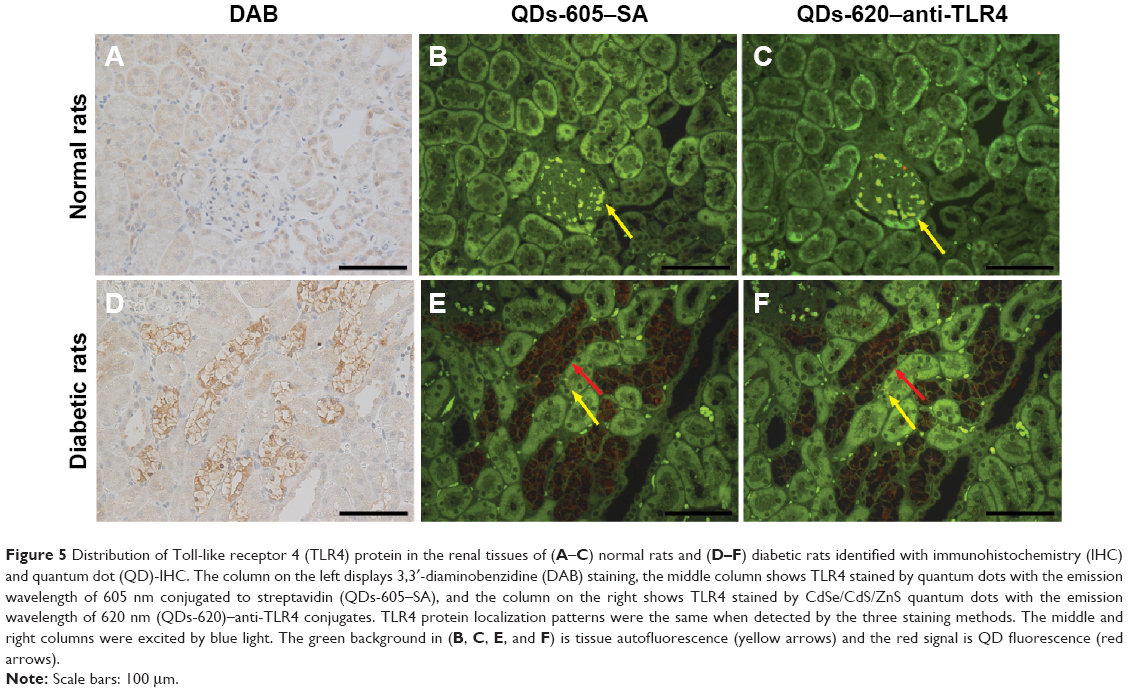 |
Figure 5 Distribution of Toll-like receptor 4 (TLR4) protein in the renal tissues of (A–C) normal rats and (D–F) diabetic rats identified with immunohistochemistry (IHC) and quantum dot (QD)-IHC. The column on the left displays 3,3′-diaminobenzidine (DAB) staining, the middle column shows TLR4 stained by quantum dots with the emission wavelength of 605 nm conjugated to streptavidin (QDs-605–SA), and the column on the right shows TLR4 stained by CdSe/CdS/ZnS quantum dots with the emission wavelength of 620 nm (QDs-620)–anti-TLR4 conjugates. TLR4 protein localization patterns were the same when detected by the three staining methods. The middle and right columns were excited by blue light. The green background in (B, C, E, and F) is tissue autofluorescence (yellow arrows) and the red signal is QD fluorescence (red arrows). |
Figure 6 shows the AR expression which was detected in the renal tissues of the rats by conventional IHC and QD immunofluorescence. The strong brown positive signals from conventional IHC were consistent with the bright red signals of QD–SA immunofluorescence representing AR expression in the renal tissues of diabetic rats. The staining was mainly located in the glomerular capillary (Figure 6C and G) and the interstitial capillary (Figure 6D and H). As a comparison, weak brown positive signals of AR expression were observed in normal rats. This indicates the expression level of AR was upregulated in the renal capillary of the diabetic rats.
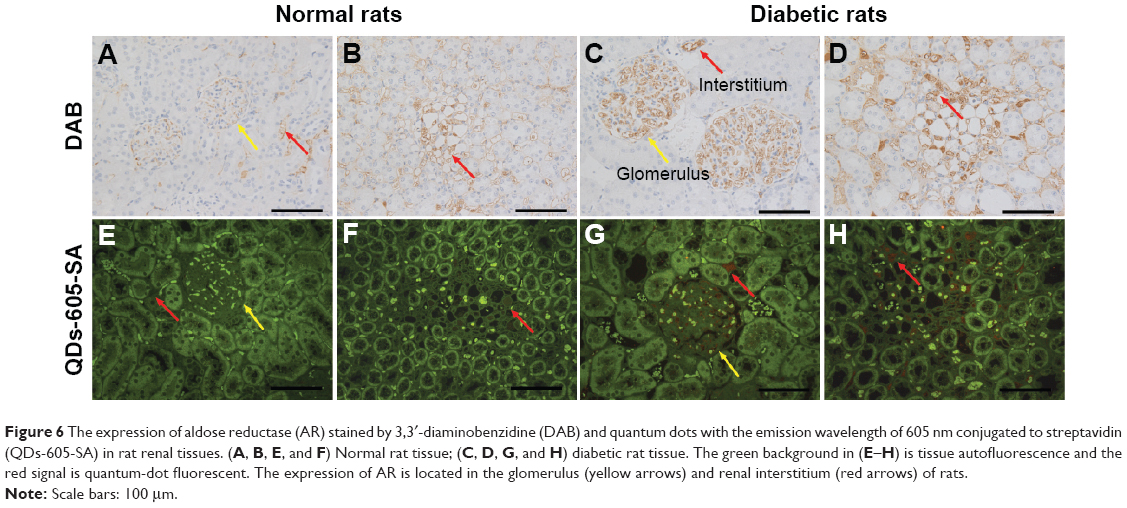 |
Figure 6 The expression of aldose reductase (AR) stained by 3,3′-diaminobenzidine (DAB) and quantum dots with the emission wavelength of 605 nm conjugated to streptavidin (QDs-605-SA) in rat renal tissues. (A, B, E, and F) Normal rat tissue; (C, D, G, and H) diabetic rat tissue. The green background in (E–H) is tissue autofluorescence and the red signal is quantum-dot fluorescent. The expression of AR is located in the glomerulus (yellow arrows) and renal interstitium (red arrows) of rats. |
For the detection of protein in tissue slides, conventional IHC is the most common method. However, research on the application of nanomaterials in molecular diagnosis is gradually increasing. As shown in Table 2, the three IHC methods have their own characteristics and advantages. The labeling effects of the three methods are all highly efficient in staining protein expression. Compared with conventional IHC, QD-IHC omits several steps, such as DAB coloration, counterstaining, and transparence of the tissue slides, saving a lot of time. In addition, although the labeling effects of QD–Ab conjugates IHC depend on the conjugated efficiency between QDs and the primary Ab, it is the simplest and most quick labeling method, based on our study. This suggests that the QD-IHC methods possess wide potential application prospects.
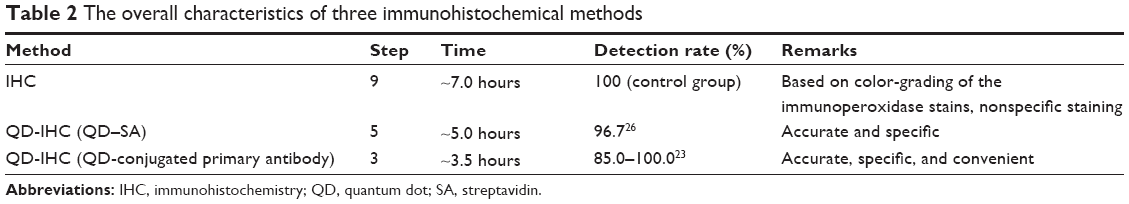 | Table 2 The overall characteristics of three immunohistochemical methods |
Multiplexed QD imaging
For visualizing the two proteins in DN kidney tissues simultaneously and gaining new insights into the complex interaction between AR and TLR4, we established a multiplexed QD imaging method (Figure 7). Two colors of QDs could be simultaneously excited by ultraviolet light and there was no spectral overlapping for spectrum analysis (Figure 7C). The green signals (green arrows) and the red signals (red arrows) show that the AR and TLR4 proteins were upregulated simultaneously in the renal tissues of diabetic rats. The AR overexpressed in the renal glomerular capillary and interstitial capillary while the TLR4 protein highly expressed in the vacuoles and degenerated the tubules of the diabetic rats. Further, the locations of the two proteins with the multiplexed QD imaging method were completely consistent with the locations which detected by the monochrome imaging method. In contrast, there were no simultaneous green and red signals in the normal control rats. In brief, the positive signals of AR and TLR4 in diabetic kidney tissues were first observed simultaneously by a multiplexed QD imaging method. The results suggest that there might be some kind of related mechanism between AR and TLR4.
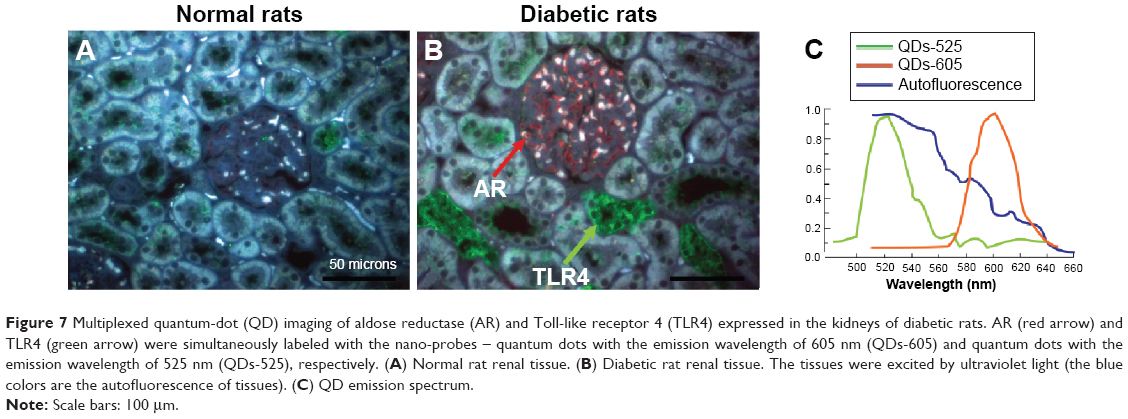 | Figure 7 Multiplexed quantum-dot (QD) imaging of aldose reductase (AR) and Toll-like receptor 4 (TLR4) expressed in the kidneys of diabetic rats. AR (red arrow) and TLR4 (green arrow) were simultaneously labeled with the nano-probes – quantum dots with the emission wavelength of 605 nm (QDs-605) and quantum dots with the emission wavelength of 525 nm (QDs-525), respectively. (A) Normal rat renal tissue. (B) Diabetic rat renal tissue. The tissues were excited by ultraviolet light (the blue colors are the autofluorescence of tissues). (C) QD emission spectrum. |
Discussion
DN is one of the most common chronic complications of diabetes, which is related to various factors, including genetics, abnormal glucose metabolism, and hemodynamic disorders. The pathogenesis of DN is complex and serious. In recent years many studies have indicated that immunologic and inflammatory mechanisms play significant roles in the development and progression of DN.27–29 TLRs are highly involved in the immune and inflammatory reactions and TLR4 plays a crucial role in the signal transduction of mediated inflammatory reaction.13,30 Tuttle27 reported that DN can be viewed as an inflammatory disease triggered by disordered metabolism, including protein kinase C activated by hyperglycemia and associated metabolic disturbances.
AR was first found to be involved in the development of diabetes through the polyol pathway.4 The overexpressed AR in blood causes sorbitol accumulation and the reduction of NADPH in cells by activating the polyol pathway, which results in cell damage and induces the occurrence of chronic diabetic complications. Vedantham et al31 utilized immunofluorescence and Western blotting to detect the expression of AR in the aortic arch of mice, carotid artery specimens from humans, and AR+ murine aortic endothelial cells. To explore the treatment of diabetes against AR, we constructed eukaryotic expression vectors containing the human AR gene and the subsequently developed cell model can be used for aldose reductase inhibitor (ARI) screening.25 Although we know AR has an important role in the development of diabetes, studies on the intuitive expression and distribution of AR in renal tissues of diabetes are quite limited.
AR and TLR4 as biomarkers of diabetes may be involved in the development of DN influenced by inflammatory reaction in varying degrees. So it is worth studying whether there is some relation between AR and TLR4. In this study, we established the modeling of diabetic rats intraperitoneally injected with STZ solution for further exploration of pathogenesis by detecting the expression of proteins (AR and TLR4) in renal tissues. We attempted to establish a new visual strategy to achieve the detection of AR and TLR4 simultaneously. We found that TLR4 was upregulated in the renal tubules of diabetic rats, and, notably, that renal vacuoles degenerated the tubules; that is to say, the proinflammatory role of TLR4 was implicated in diabetes and DN. In addition, Lin et al12 and Liu et al14 also reported through conventional IHC that TLR4 was overexpressed in diabetic renal tubule. It indicates that there is a high positive correlation between TLR4 activation and diabetic renal tubular injury, while TLR4 might be a promising therapeutic target in DN.
Meanwhile, we identified for the first time, as far as we are aware, the overexpression of AR in the renal tissues of diabetic rats through IHC. The results show that AR was mainly upregulated in the glomerulus vascules and renal interstitium vascules in the kidneys of diabetic rats. Previously we evaluated the activity of erythrocyte AR on the blood of diabetic rats by fluorometry and the results suggested that the AR activity was increased in diabetic groups and with an increasing tendency during the course of diabetes development.32 As the glomerular and renal interstitial tissues are rich in blood vessels, we speculate that the overexpression of AR in renal tissues is related to the high activity of AR in the blood of diabetic rats.
There are few technologies for detecting AR. Most previous studies on the detection of AR relied on the activity assay or Western blotting for qualitative or quantitative analysis,25,33 while the present study reveals an intuitive impression of the localization of AR in cells and tissues with QD immunofluorescence. Since Bruchez et al34 and Chan and Nie35 first reported the use of QDs in biomedical research in 1998, the applications of QDs have increased rapidly. Nowadays, due to their unique optical properties, QDs have been successfully used as novel fluorescent tools for the immunofluorescent labeling of cells or tissues24,36,37 and other bio-analytical purposes.38 Wu et al36 used QDs linked to IgG and SA to label the breast-cancer marker Her2 on fixed cancer cells. They showed that, compared with conventional organic dyes, QDs offered more intense fluorescent signals and were considerably more photostable. Some studies which used QD conjugates to label biomarkers had satisfying results.39 Our study shows that the probe QDs linked to primary Ab (AR/TLR4 Ab) can image the expression of AR and TLR4 clearly and accurately. The approach of QD conjugated with Ab is various and complex40,41 and there are various ways of identifying the conjugates, including mass spectrometry, capillary electrophoresis, and so on.42 In this study, we set up QD-primary Ab probes with simple steps, omitting ultrafiltration and purification. In addition, the conjugating efficiency of the probes could be detected by agarose gel electrophoresis, providing a more convenient and effective way of using QD immunofluorescence in cellular imaging and tissue staining.
QDs have a broad absorption spectrum and narrow emission spectrum, and different colors of QDs can be simultaneously excited by a single light source and minimal spectral overlapping, which provides a valuable reference for the multiplexed detection of targets.43,44 Based on this, in the present study we developed a QD dual-color strategy to simultaneously image AR and TLR4 in the renal tissues of rats, through which we have explored their roles and relationship in the occurrence and development of DN. The results provide direct morphological evidence to show that the expression of AR and TLR4 are indeed observed synchronously in the renal tissues of diabetic rats, indicating that AR and TLR4 may jointly participate in the development of DN through a particular pathway such as inflammation. Ramana45 provided extensive research during recent years suggesting that AR plays a major role in the mediation of oxidative stress-induced inflammatory signals. Our results suggest that ARIs may be used to treat inflammation, but more evidence is needed to confirm this hypothesis. Therefore, to further study the co-expression pathway of the two biomarkers and the effective targeted therapy may be of great help in the prevention and treatment of diabetes and inflammatory diseases. Multiplexed QD imaging shows not only the visualization of targets, but also the relationships between biomarkers and the processes of diseases.
Conclusion
In this study, we found that AR was upregulated in the glomerulus vascules and renal interstitium vascules of renal tissues of diabetic rats. It provides evidence for exploring the pathogenesis of DN. Moreover, we observed that AR and TLR4 were simultaneously upregulated in the renal tissues of diabetic rats through a QD-based dual-color labeling strategy, which indicated AR and TLR4 jointly participated in the occurrence and development of DN. ARIs may have therapeutic potential for inflammatory diseases. The QD-based multiplexed imaging technology provides a new insight into the mechanism study on the correlation among biological factors as well as the diagnosis and treatment of diseases.
Acknowledgments
This work was supported by grants from the National Natural Science Foundation of China (51371197, 21071150, and 61107017); the Singapore Ministry of Education, under Tier 2 Research Grant MOE2010-T2-2-010 (4020020.040 ARC2/11); the A*STAR Science and Engineering Research Council, under research grant M4070176.040.703142; and Nanyang Institute of Technology in Health and Medicine, under research grant M4061202.040.
Disclosure
The authors report no conflicts of interest in this work.
References
van der Pols-Vijlbrief R, Dekker JM, Stehouwer CD, et al. Symptom burden and its association with change in glucose metabolism status over a 7-year period: the Hoorn Study. Diabet Med. 2014;31(6):747–753. | ||
Zimmet P, Alberti KG, Shaw J. Global and societal implications of the diabetes epidemic. Nature. 2001;414(6865):782–787. | ||
Cumbie BC, Hermayer KL. Current concepts in targeted therapies for the pathophysiology of diabetic microvascular complications. Vasc Health Risk Manag. 2007;3(6):823–832. | ||
Petrash JM. All in the family: aldose reductase and closely related aldo-keto reductases. Cell Mol Life Sci. 2004;61(7–8):737–749. | ||
Barski OA, Tipparaju SM, Bhatnagar A. The aldo-keto reductase superfamily and its role in drug metabolism and detoxification. Drug Metab Rev. 2008;40(4):553–624. | ||
Samuels IS, Lee CA, Petrash JM, Peachey NS, Kern TS. Exclusion of aldose reductase as a mediator of ERG deficits in a mouse model of diabetic eye disease. Vis Neurosci. 2012;29(6):267–274. | ||
Lee AY, Chung SS. Contributions of polyol pathway to oxidative stress in diabetic cataract. FASEB J. 1999;13(1):23–30. | ||
Obrosova IG. Increased sorbitol pathway activity generates oxidative stress in tissue sites for diabetic complications. Antioxid Redox Signal. 2005;7(11–12):1543–1552. | ||
Gabbay KH. The sorbitol pathway and the complications of diabetes. N Engl J Med. 1973;288:831–836. | ||
Kawai T, Akira S. The role of pattern-recognition receptors in innate immunity: update on Toll-like receptors. Nat Immunol. 2010;11(5): 373–384. | ||
Alexopoulou L, Holt AC, Medzhitov R, Flavell RA. Recognition of double-stranded RNA and activation of NF-kappaB by Toll-like receptor 3. Nature. 2001;413(6857):732–738. | ||
Lin M, Yiu WH, Wu HJ, et al. Toll-like receptor 4 promotes tubular inflammation in diabetic nephropathy. J Am Soc Nephrol. 2012;23(1):86–102. | ||
Kuwabara T, Mori K, Mukoyama M, et al. Exacerbation of diabetic nephropathy by hyperlipidaemia is mediated by Toll-like receptor 4 in mice. Diabetologia. 2012;55(8):2256–2266. | ||
Liu SY, Nie XZ, Zhou WY, Chen J. Expression and effect of TLR4 in rats with diabetic nephropathy. Asian Pac J Trop Med. 2013;6(8):635–639. | ||
Chen H, Xue J, Zhang Y, Zhu X, Gao J, Yu B. Comparison of quantum dots immunofluorescence histochemistry and conventional immunohistochemistry for the detection of caveolin-1 and PCNA in the lung cancer tissue microarray. J Mol Histol. 2009;40(4):261–268. | ||
Gonda K, Miyashita M, Watanabe M, et al. Development of a quantitative diagnostic method of estrogen receptor expression levels by immunohistochemistry using organic fluorescent material-assembled nanoparticles. Biochem Biophys Res Commun. 2012;426(3): 409–414. | ||
Smith AM, Duan H, Mohs AM, Nie S. Bioconjugated quantum dots for in vivo molecular and cellular imaging. Adv Drug Deliv Rev. 2008;60(11):1226–1240. | ||
Wu Y, Campos SK, Lopez GP, Ozbun MA, Sklar LA, Buranda T. The development of quantum dot calibration beads and quantitative multicolor bioassays in flow cytometry and microscopy. Anal Biochem. 2007;364(2):180–192. | ||
Bostick RM, Kong KY, Ahearn TU, Chaudry Q, Cohen V, Wang MD. Detecting and quantifying biomarkers of risk for colorectal cancer using quantum dots and novel image analysis algorithms. Conf Proc IEEE Eng Med Biol Soc. 2006;1:3313–3316. | ||
Fountaine TJ, Wincovitch SM, Geho DH, Garfield SH, Pittaluga S. Multispectral imaging of clinically relevant cellular targets in tonsil and lymphoid tissue using semiconductor quantum dots. Mod Pathol. 2006;19(9):1181–1191. | ||
Jaiswal JK, Mattoussi H, Mauro JM, Simon SM. Long-term multiple color imaging of live cells using quantum dot bioconjugates. Nat Biotechnol. 2003;21(1):47–51. | ||
Liu J, Lau SK, Varma VA, Kairdolf BA, Nie S. Multiplexed detection and characterization of rare tumor cells in Hodgkin’s lymphoma with multicolor quantum dots. Anal Chem. 2010;82(14):6237–6243. | ||
Xing Y, Chaudry Q, Shen C, et al. Bioconjugated quantum dots for multiplexed and quantitative immunohistochemistry. Nat Protoc. 2007;2(5):1152–1165. | ||
Qian J, Yong KT, Roy I, et al. Imaging pancreatic cancer using surface-functionalized quantum dots. J Phys Chem B. 2007;111(25):6969–6972. | ||
Du MM LJ, Zhai B YL. Construction and function study of a drug-screening model based on aldose reductase gene and its inhibitors. Chinese Pharmacological Bulletin. 2009;(04):552–555. Chinese. | ||
Chen C, Peng J, Xia HS, et al. Quantum dots-based immunofluorescence technology for the quantitative determination of HER2 expression in breast cancer. Biomaterials. 2009;30(15):2912–2918. | ||
Tuttle KR. Linking metabolism and immunology: diabetic nephropathy is an inflammatory disease. J Am Soc Nephrol. 2005;16(6):1537–1538. | ||
Navarro JF, Mora C. Role of inflammation in diabetic complications. Nephrol Dial Transplant. 2005;20(12):2601–2604. | ||
Mora C, Navarro JF. Inflammation and diabetic nephropathy. Curr Diab Rep. 2006;6(6):463–468. | ||
Lv J, Jia R, Yang D, Zhu J, Ding G. Candesartan attenuates Angiotensin II-induced mesangial cell apoptosis via TLR4/MyD88 pathway. Biochem Biophys Res Commun. 2009;380(1):81–86. | ||
Vedantham S, Noh H, Ananthakrishnan R, et al. Human aldose reductase expression accelerates atherosclerosis in diabetic apolipoprotein E-/- mice. Arterioscler Thromb Vasc Biol. 2011;31(8):1805–1813. | ||
Zhang ZH YL, Liu JW LJ. Dynamic observation of blood aldose reductase activity on diabetic rats by the fluorimetry method. Chinese Journal of Gerontology. 2005;(04):426–428. Chinese. | ||
Reddy GB, Satyanarayana A, Balakrishna N, et al. Erythrocyte aldose reductase activity and sorbitol levels in diabetic retinopathy. Mol Vis. 2008;14:593–601. | ||
Bruchez M Jr, Moronne M, Gin P, Weiss S, Alivisatos AP. Semiconductor nanocrystals as fluorescent biological labels. Science. 1998;281(5385):2013–2016. | ||
Chan WC, Nie S. Quantum dot bioconjugates for ultrasensitive nonisotopic detection. Science. 1998;281(5385):2016–2018. | ||
Wu X, Liu H, Liu J, et al. Immunofluorescent labeling of cancer marker Her2 and other cellular targets with semiconductor quantum dots. Nat Biotechnol. 2003;21(1):41–46. | ||
Peng CW, Liu XL, Chen C, et al. Patterns of cancer invasion revealed by QDs-based quantitative multiplexed imaging of tumor microenvironment. Biomaterials. 2011;32(11):2907–2917. | ||
Wang C, Gao X, Su X. In vitro and in vivo imaging with quantum dots. Anal Bioanal Chem. 2010;397(4):1397–1415. | ||
Li J, Wu D, Miao Z, et al. Preparation of quantum dot bioconjugates and their applications in bio-imaging. Curr Pharm Biotechnol. 2010,11(6):662–671. Chinese. | ||
Mahmoud W, Rousserie G, Reveil B, et al. Advanced procedures for labeling of antibodies with quantum dots. Anal Biochem. 2011;416(2):180–185. | ||
Liu TC, Wang JH, Wang HQ, et al. Bioconjugate recognition molecules to quantum dots as tumor probes. J Biomed Mater Res A. 2007;83(4):1209–1216. | ||
Janu L, Stanisavljevic M, Krizkova S, et al. Electrophoretic study of peptide-mediated quantum dot-human immunoglobulin bioconjugation. Electrophoresis. 2013;34(18):2725–2732. | ||
Michalet X, Pinaud FF, Bentolila LA, et al. Quantum dots for live cells, in vivo imaging, and diagnostics. Science. 2005;307(5709):538–544. | ||
Ornberg RL, Liu H. Immunofluorescent labeling of proteins in cultured cells with quantum dot secondary antibody conjugates. Methods Mol Biol. 2007;374:3–10. | ||
Ramana KV. ALDOSE REDUCTASE: New Insights for an Old Enzyme. Biomol Concepts. 2011;2(1–2):103–114. |
 © 2015 The Author(s). This work is published and licensed by Dove Medical Press Limited. The full terms of this license are available at https://www.dovepress.com/terms.php and incorporate the Creative Commons Attribution - Non Commercial (unported, v3.0) License.
By accessing the work you hereby accept the Terms. Non-commercial uses of the work are permitted without any further permission from Dove Medical Press Limited, provided the work is properly attributed. For permission for commercial use of this work, please see paragraphs 4.2 and 5 of our Terms.
© 2015 The Author(s). This work is published and licensed by Dove Medical Press Limited. The full terms of this license are available at https://www.dovepress.com/terms.php and incorporate the Creative Commons Attribution - Non Commercial (unported, v3.0) License.
By accessing the work you hereby accept the Terms. Non-commercial uses of the work are permitted without any further permission from Dove Medical Press Limited, provided the work is properly attributed. For permission for commercial use of this work, please see paragraphs 4.2 and 5 of our Terms.