")
Back to Journals » Neuropsychiatric Disease and Treatment » Volume 10
Diagnostic and therapeutic utility of neuroimaging in depression: an overview
Authors Wise T, Cleare A, Herane A , Young A , Arnone D
Received 16 April 2014
Accepted for publication 22 May 2014
Published 19 August 2014 Volume 2014:10 Pages 1509—1522
DOI https://doi.org/10.2147/NDT.S50156
Checked for plagiarism Yes
Review by Single anonymous peer review
Peer reviewer comments 3
Toby Wise,1 Anthony J Cleare,1 Andrés Herane,1,2 Allan H Young,1 Danilo Arnone1
1King’s College London, Institute of Psychiatry, Department of Psychological Medicine, Centre for Affective Disorders, London, United Kingdom; 2Clínica Psiquiátrica Universitaria, Universidad de Chile, Santiago, Chile
Abstract: A growing number of studies have used neuroimaging to further our understanding of how brain structure and function are altered in major depression. More recently, these techniques have begun to show promise for the diagnosis and treatment of depression, both as aids to conventional methods and as methods in their own right. In this review, we describe recent neuroimaging findings in the field that might aid diagnosis and improve treatment accuracy. Overall, major depression is associated with numerous structural and functional differences in neural systems involved in emotion processing and mood regulation. Furthermore, several studies have shown that the structure and function of these systems is changed by pharmacological and psychological treatments of the condition and that these changes in candidate brain regions might predict clinical response. More recently, “machine learning” methods have used neuroimaging data to categorize individual patients according to their diagnostic status and predict treatment response. Despite being mostly limited to group-level comparisons at present, with the introduction of new methods and more naturalistic studies, neuroimaging has the potential to become part of the clinical armamentarium and may improve diagnostic accuracy and inform treatment choice at the patient level.
Keywords: depression, mood disorder, neuroimaging, diagnosis, treatment
Introduction
Major depressive disorder (MDD) is a common condition with a significant effect on quality of life,1 and considerable interest has been devoted to understanding the biological underpinnings of mood dysregulation as a way of improving syndromic detection and treatment outcomes. In affective disorders, the intrinsic complexity of brain neuroanatomy and its functional connectivity is further complicated by the considerable heterogeneity of these conditions and the effects of treatment on the brain, which makes advancement of knowledge particularly challenging. The introduction of magnetic resonance imaging (MRI) in both its structural and functional capacity has proved to be a crucial turning point, providing the necessary tools for investigating affective disorders. The number of structural and functional studies has exponentially increased since the introduction of MRI-based techniques, and these studies have provided a growing body of evidence supporting brain abnormalities in MDD. It has also become evident that, different from gross brain pathology, abnormalities in affective disorders are likely to be of a much smaller magnitude and markedly influenced by study design characteristics and a range of clinical and demographic factors. Nevertheless, sufficient knowledge about MDD has accumulated in the last few decades that it is now possible to postulate neurobiological circuits of mood dysregulation, which might guide the diagnosis of MDD and target candidate biomarker brain regions for clinical response. This is an increasingly important research area because of growing concern about progress in the development of novel treatments,2 which has led to intensified efforts to understand how to maximize the efficacy of existing interventions.3 In this selective review, we focus on recent structural and functional neuroimaging findings in MDD. We aim to provide a concise overview of recent advances in the development of models of the circuitry of mood dysregulation in depression, with an emphasis on MRI-based techniques developed as an aid to improve diagnosis and guide clinical response.
Methods
Relevant articles were identified from searches in Pubmed, Embase, and Scopus. Search terms included the following: “depress*,” “neuroimaging,” “PET,” “MRI,” “magnetic resonance,” “fMRI,” “DTI,” “diffusion tensor,” and “neurofeedback,” both in isolation and in combination. Articles’ citation lists were also cross-referenced for inclusiveness. We identified studies that examined differences in brain structure and function between individuals with MDD and healthy controls. We also aimed to identify articles that investigated the relationship between these measures and response to treatment. Studies that tested the efficacy of MRI-based treatments were also identified. This work reports a selective narrative description of the identified studies.
Structural MRI
Many studies have used structural MRI to look for differences in brain volume and shape between patients with MDD and healthy controls (HCs) with both a region-of-interest approach and at the whole-brain level, using voxel-based morphometry (VBM). According to structural MRI and in contrast with bipolar disorder (BD), MDD is believed not to be characterized by global brain volumetric reduction.4,5 A summary of the main findings from these studies are shown in Table 1. However, hundreds of case control studies to date have identified morphometric reductions in candidate regions in the medial systems of the prefrontal cortex (eg, orbitofrontal cortex, ventromedial prefrontal cortex, and anterior cingulate cortex),6–10 as well as lateral prefrontal systems (eg, ventrolateral prefrontal cortex and dorsolateral prefrontal cortex).7,8,11,12 Although recent meta-analyses have supported the view that frontal gray matter differences in these regions are important in MDD,13,14 it should be noted that there is some inconsistency in results, with several null findings in these areas.15–18
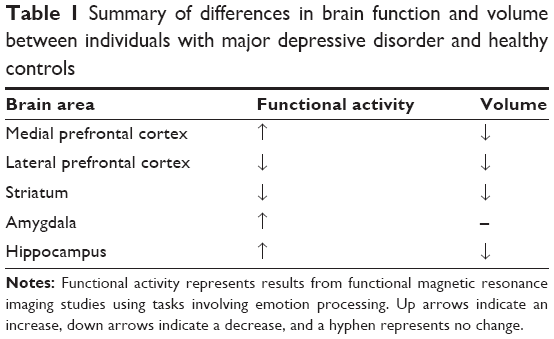 | Table 1 Summary of differences in brain function and volume bet3/31/2015ween individuals with major depressive disorder and healthy controls |
Volumetric reductions have also been identified in subcortical systems implicated in affective regulation. These regions include the striatum (caudate and putamen),16,18 the hippocampus,19–22 and in some studies, the amygdala,23,24 largely reflecting aberrant neurocircuitry shown in postmortem studies.25,26 Volumetric reduction in the hippocampus remains, to date, the most replicated finding in MDD, as highlighted by several meta-analyses,5,27,28 and is complemented by findings of altered shape,29 whereas there are inconsistencies in reports of volumetric differences in the amygdala (the second most researched area).5 Incongruences in the results can be explained in the light of significant heterogeneity in the patients included in these studies and the methods applied to measure differences.5,27 Bora et al for instance, found evidence of amygdala morphometric reduction in MDD when comorbid anxiety was present.13 Although prefrontal volumetric reduction has also been described in BD,4 a recent meta-analysis calculated cumulative effect sizes of studies comparing bipolar and depressed patients versus healthy controls and found greater hippocampal reduction in MDD.27 However, hippocampal volume reduction has been found in healthy individuals with a family history of depression,30 indicating this may not be specific to current depression and may instead reflect underlying genetic risk.
In longitudinal studies investigating candidate brain regions as putative biomarkers for treatment response, the hippocampus has been shown to be reduced in depression and sensitive to volumetric increase after pharmacologic treatment and clinical improvement.31 Thus, Arnone et al32 in a VBM study, demonstrated bilateral volumetric gain in the hippocampus after a course of the antidepressant citalopram. This is in agreement with Frodl et al’s23 finding that greater hippocampal volume in depressed patients at baseline is associated with better clinical response at follow-up, suggesting that baseline hippocampal volumes might predict treatment response in MDD. Consistent with this finding, Vakili et al33 demonstrated greater hippocampal volumes in responders in comparison with nonresponders, and in another study, lower hippocampal volumes at first presentation identified participants who became treatment nonresponders.34 Similarly, Sämann et al35 in a VBM study that investigated a large sample of 140 patients, identified a number of brain areas whose pretreatment volumes correlated with response to antidepressant treatment. These regions included the left hippocampal complex, the superior temporal gyrus, and the middle temporal gyrus.
However, these findings are not always consistent across studies. For example, another VBM study36 found that the volumes of a number of areas were associated with treatment response to fluoxetine, but these were largely distinct from those identified by Sämann et al and notably did not include the hippocampus. Another recent study did not find any significant association between gray matter volume and treatment response,37 although given the small size of this study, this null finding may be a result of inadequate statistical power. In addition, Lai and Hsu found no effect of 6 weeks’ treatment with duloxetine on gray matter density in the hippocampus in a sample of depressed patients with comorbid panic disorder.38
Functional magnetic resonance imaging
In addition to structural findings, neuroimaging has provided invaluable insights into the functional pathophysiology of MDD through functional MRI (fMRI). A summary of the main findings in this area is provided in Table 1. As with structural findings, both medial and lateral prefrontal systems have been implicated. During negative affective processing tasks such as viewing sad or fearful faces, dorsolateral prefrontal areas reliably show reduced activation compared with controls,39–41 whereas the anterior cingulate cortex (ACC) shows increased activation.42–45 Functional alterations while processing negative stimuli have also been demonstrated in limbic regions, most notably in the amygdala, where exaggerated responses to negative stimuli are seen,40,43,46–49 whereas processing of positive stimuli such as monetary gains is associated with reduced activity in areas associated with reward processing such as the striatum.50–52
There is some evidence this pattern of activation in response to emotional stimuli may be specific to MDD. Recent studies comparing BD patients with those with MDD have shown that BD is associated with elevated amygdala responses to positive stimuli, in comparison with increased responses to negative stimuli in MDD.53,54 In addition, elevated amygdala responses to sad faces appear to be specific to a depressed state,5 indicating this might differentiate between currently depressed individuals and those with a history of MDD.
These functional abnormalities have also been associated with treatment response. In particular, heightened reactivity to negative stimuli is normalized after treatment with antidepressant medication in the amygdala,43,46,55 whereas reduced lateral prefrontal activity increases;56,57 findings in keeping with theories positing that the effects of these drugs depend on the amelioration of excessive negative information processing.58,59 It has also been shown that amygdala reactivity to positive emotions increases after treatment with antidepressant medication,49 although this is not as consistently demonstrated.46,60,61 Similarly, psychological therapies have been shown to normalize heighted amygdala responses to negative emotional stimuli,62,63 and also to increase striatal responses to rewards,64 suggesting psychological treatments might share similar mechanisms of action.
Fewer studies have looked at the prognostic value of functional measures, but some have shown that baseline ACC activity predicts response to pharmacological treatment. For example, Roy et al65 used an emotional image-viewing task in a sample of MDD patients before 8 weeks’ treatment with citalopram and found a positive correlation between ACC response to emotional pictures and response to treatment. This echoes findings from an earlier study that found that higher anterior cingulate activity while viewing negative pictures was associated with a larger treatment response after 8 weeks of treatment with venlafaxine,66 as well as a more recent study that found that higher anterior cingulate and caudate activity while viewing sad faces was associated with greater improvement in symptoms with fluoxetine treatment.36 Similar results have been found in other tasks; for example, tasks involving working memory67 and response inhibition,68 suggesting ACC activity may predict treatment response regardless of context.
However, some studies have failed to find associations between ACC activity and treatment response,69–71 despite showing activity in other areas that correlated with treatment response. Furthermore, one recent study found that patients with higher baseline activity in the ACC while viewing emotional words was associated with poorer response to treatment,72 contradicting findings from previous studies. Although there are some inconsistencies in findings, these are likely a result of confounding factors such as differences in sample characteristics and the type of intervention used. There are also numerous confounds that are problems in much of this research, reviewed in the “Discussion”, but overall, ACC activity does appear to be a relatively reliable predictor of response to antidepressant treatment.
With regard to prediction of response to cognitive behavioral therapy, a number of studies of the anterior cingulate have found the opposite pattern from studies looking at antidepressant response, with higher activity in response to sad faces at baseline associated with poorer treatment response.62,73,74 Notably, using logistic regression, Fu et al62 were able to individually classify patients as either responders or nonresponders on the basis of their baseline anterior cingulate activity while viewing sad faces with 87.5% accuracy, providing evidence that functional alterations in emotion processing systems can differentiate between patients and controls at an individual level. In addition, the contrast with findings in studies using antidepressants suggests that if this could be shown to be generalizable to real-world patient populations, it could be used to personalize patients’ care such that they receive the most beneficial form of treatment from the outset, thus optimizing the overall treatment response.
Studies have also identified alterations in resting state activity in MDD, mostly showing increases in connectivity within the “default mode network,”75,76 which has been suggested to reflect the excessive rumination seen in MDD.77 Findings in other networks such as the “affective network” have been less consistent, with both increased76 and decreased78,79 connectivity reported. Taken together, these findings suggest dysfunction in networks involved in self-directed thought and emotion processing, which is consistent with the dysfunctional emotion processing shown in task-based MRI studies.
More recently, research has begun to build on these findings by using resting-state measures to differentiate between MDD patients and healthy controls at an individual level. One recent study80 suggested that “regional homogeneity,” a measure of correlations between nearby voxels, could be used to distinguish between groups with relatively high accuracy. However, circular analysis and failure to correct for multiple comparisons limits the conclusions that can be drawn from this study. Nevertheless, on the basis of the consistency of resting-state differences between MDD patients and healthy controls, this is a subject deserving of further research, perhaps using more reliable measures.
Antidepressant treatment has also been found to have effects on resting-state abnormalities in MDD. Li et al81 found that after 12 weeks of antidepressant treatment, connectivity in the dorsal component of the default mode network was normalized, whereas increased connectivity in the anterior subnetwork persisted. In addition, studies have shown that treatment is associated with increased connectivity between cortical and subcortical areas involved in affect generation and regulation.82
Resting-state fMRI has also been used to predict treatment response in MDD. Lui et al83 scanned patients who were subsequently prescribed a range of antidepressant medications and found that patients who responded to treatment showed decreased connectivity among the left amygdala, ACC, right insula, and precuneus relative to nonresponders. Many of these areas are part of the “affective network,” in which abnormalities have been reported,76,78,79 suggesting that dysfunction in this network at rest may be important in treatment response, as well having predictive power. To date, no studies have examined whether “default mode network” activity predicts treatment response, but given the number of studies reporting baseline dysfunction as well as changes with treatment, this may be a fruitful avenue for future research.
Positron emission tomography
Much like research using fMRI, studies of brain function before and after treatment by measuring blood flow and glucose metabolism using positron emission tomography have demonstrated that brain function changes after treatment. These studies have found similar results to fMRI studies, identifying hyperactivity in the medial prefrontal cortex in the presence of depressive symptoms. Antidepressant and psychotherapy intervention studies indicate that increased metabolism in prefrontal areas before treatment decreases after treatment and “normalizes” to levels of activity measured in healthy controls. In some other studies, however, metabolic rate after treatment decreased below normal levels.84–87 Conversely, metabolic hyperactivity persists where there has been a lack of response to treatment.84,87–89 Changes have also been measured in limbic and paralimbic areas, including posterior cingulate cortex, insula, hippocampus, and amygdala, with conflicting findings of decreased or increased metabolism or neural activity, depending on the study.43,61,84–87,90
Taken together, these findings add to the evidence for a functional deficit in mood regulation systems in MDD, which is related to treatment response. More recently, a study by McGrath et al91 showed that insula hypometabolism was associated with remission to cognitive behavior therapy and poor response to escitalopram, whereas insula hypermetabolism was associated with remission to escitalopram and poor response to cognitive behavior therapy. Although this finding requires replication in future studies, it does suggest the insula might be a biomarker to predict a preferential response to different modes of treatment.
Furthermore, positron emission tomography has been used to measure serotonin 1A (5-HT1A) receptor binding, with the aim of understanding the nature of neurochemical changes in MDD and how these relate to treatment response. However, findings from these studies are contradictory, with both increases and decreases in 5-HT1A receptor binding reported in MDD.92,93 As noted by a recent review,94 the inconsistency in findings is likely to be a result of methodological differences, and the field would benefit from gaining a better understanding of how different analysis methods can produce such contrasting results. The most important difference between studies is the choice of reference tissue, which is used to normalize radioligand binding in the region of interest. Results can vary greatly, depending on the choice of reference, and there is no agreement on which is the optimal method (see Shrestha et al94 for a detailed review of this and further issues in these studies).
Similarly, there are inconsistencies in studies looking at changes in 5-HT1A receptor binding after antidepressant treatment95,96 and in studies exploring the ability of pretreatment binding potential to predict response.92,96 In sum, there is far too much variability in finding for this method to provide any useful information in relation to the diagnosis and treatment of MDD at present. However, further research focusing on the methodological differences responsible for these inconsistencies may help in this regard.
Diffusion tensor imaging
A more recent development in MRI is diffusion tensor imaging (DTI), which has allowed differences in white matter microstructure to be characterized in MDD. Many studies have reported reduced fractional anisotropy (FA), a measure of white matter integrity, in a number of pathways, including the superior longitudinal fasciculus97,98 and genu of the corpus callosum.99,100 However, findings are inconsistent, likely because of differences in sample characteristics and methods of analysis, and a number of studies have found no significant differences between patients and controls.101–103 Given the evidence for frontolimbic dysfunction provided by functional and structural studies, it is surprising that only a few studies104,105 have reported decreased FA in the uncinate fasciculus, a white matter pathway connecting these regions. Nevertheless, taken together, and despite the inconsistencies, these studies indicate that white matter microstructural abnormalities are present in MDD.
To date, only one study has examined the effect of psychological therapy on white matter integrity.106 It found that after 4 weeks of guided imagery therapy, FA was increased in the supplementary motor area and decreased in the angular gyrus. Similarly, few studies have looked at the ability of DTI to predict response with pharmacological treatments in MDD. Alexopoulos et al107 found that high pretreatment FA in an area close to the ACC was associated with remission when treated with antidepressants in a sample of 13 patients with late-life depression. However, a more recent study in older adults found the opposite pattern of results,108 with higher values in patients who did not respond to treatment. Only two studies looking at pretreatment DTI measures of response to pharmacological treatment have been reported in younger adults.109,110 In contrast to the finding in late-life depression, no difference in FA was found between treatment-responsive and treatment-nonresponsive patients in the anterior cingulate in either study. However Zhou et al109 found decreased FA in the hippocampus of patients refractory to treatment, whereas Delorenzo et al110 found that those who did not remit had lower FA in tracts connecting the raphe nuclei with the amygdala than those who remitted.
Further studies in adults have compared FA measurements in relation to treatment refractoriness after a course of antidepressant treatment in MDD. One recent study found reduced FA in the ventromedial prefrontal cortex of patients with chronic treatment-resistant depression compared with those with recurrent but remitted and first-episode depression and healthy controls.111 Similarly, another study found reduced FA in the ventromedial prefrontal cortex of individuals with treatment-resistant depression versus healthy controls,112 along with reduced values in the uncus and cerebellum. Findings from these studies are limited by differences in illness duration, treatment responsiveness, and other clinical differences; thus, generalization of findings might be difficult in relation to response prediction. Despite these limitations, the evidence supports the presence of differences in white matter integrity between patients who respond to antidepressant treatment and those who do not, although the exact nature of these differences needs further clarification. Further pretreatment DTI studies, particularly in younger samples, would be highly beneficial.
Machine learning and structural magnetic resonance imaging
Neuroimaging studies focused on individual-level analysis of data are necessary to be clinically useful for diagnosis and treatment prediction. Recent work has implemented “machine learning” techniques to explore the potential for neuroimaging to confirm clinical diagnosis based on neurobiological abnormalities (diagnostic biomarkers) and to assign individuals to diagnostic or therapeutic response categories at an individual level. Key to these techniques is a multivariate approach that allows identification of distributed patterns of activity in the brain and takes advantage of the large amount of data available in neuroimaging datasets.
Combining machine learning techniques with structural data has provided promising results in both diagnosis and prediction of treatment response. Recent studies using “support vector machine” (SVM) and “relevance vector machine” methods have been able to successfully discriminate between patients and controls with accuracies ranging from 67.3% to 90.3%.113–115 In these studies, the areas with the highest contributions to classification are mostly medial and lateral frontal structures and limbic structures such as the hippocampus, replicating findings from other structural MRI studies showing structural differences between MDD patients and HCs. However, it should be noted that some of these patients had been taking antidepressant medications either before or at the time of scanning, which are known to affect gray and white matter volumes116,117 and would need to be accounted for in the findings. In addition, sensitivity reached 93.3% in one study115 but was around 70% in the other two studies, indicating a high risk of false-positives.
Studies have also used machine learning classification techniques to predict response to antidepressant treatment.113,114,118 In these studies, participants were split into responders and nonresponders after treatment, and machine learning techniques were used to allocate patients to either category according to their pretreatment structural images. Gong et al114 achieved a classification accuracy of 69.5% using gray matter images, whereas Costafreda et al113 were able to classify patients with 88.9% accuracy. Using “transductive conformal predictors,” a method that produces confidence measures for classification, Nouretdinov et al118 were able to predict response to antidepressant treatment with 83.3% accuracy while also providing confidence measures for these predictions. Interestingly, unlike other treatment prediction studies, none of these found that differences in hippocampal gray matter contributed to classification. However, two studies found that the anterior cingulate contributed significantly,113,118 echoing findings from fMRI studies of treatment response prediction.
These methods have also been applied to the prediction of response to psychological therapies, with mixed results. Costafreda et al113 were unable to distinguish between those who did and those who did not respond to cognitive behavioral therapy, whereas another study119 was able to successfully categorize patients according to their response to psychological treatment, albeit with a relatively low sensitivity of 71%.
Machine learning and fMRI
Machine learning classification methods have also been applied to data from task-based fMRI experiments, and results suggest this also has some potential as a diagnostic biomarker for MDD. Building on previous studies using univariate analysis, Fu et al120 used SVM classifiers to attempt to distinguish between MDD and HC participants on the basis of blood oxygen level dependent activity while viewing sad faces. Although this method was successful in discriminating patients from controls, using whole-brain activation maps, this was achieved with a low rate of accuracy (68%) in comparison with “resting state” data121 and structural data.115
Some research suggests a superior diagnostic accuracy might be obtained by combining multiple classifiers. Hahn et al122 trained Gaussian process classifiers on activity during three separate tasks involving emotional and reward processing and integrated their predictions using a decision tree algorithm. This method resulted in a classification accuracy of 83% by combining all of the classifiers together. This indicates that optimal classification might be achieved through the integration of several neuroimaging measures, which could be a point of interest for future research. Moreover, even greater accuracy might be produced by methods combining both functional and structural data.
Importantly, these methods have also begun to be used to address the problem of symptomatic overlap between depression and other conditions. A major challenge in the diagnosis of depression is differentiating it from BD, a condition characterized by periods of depression but with the addition of manic or hypomanic episodes, and any neuroimaging-based diagnostic biomarker for MDD would need to discriminate between these two conditions. Recent studies have used machine learning classification methods to analyze data from facial emotion processing tasks in MDD and BD patients54,123 and found that the two disorders can be accurately distinguished from one another with 80%–90% accuracy. Although there are some limitations in this research, such as the differences in medication between groups, that could contribute to the classification success, findings suggest that machine learning-based diagnostic classification could successfully distinguish individuals with MDD from those with other conditions.
There are also indications that machine learning analysis of task-based fMRI data may be useful in predicting response to treatment. Costafreda et al119 applied SVM analysis to data from an emotional face processing task and found that participants could be classified as responders or nonresponders to cognitive behavioral therapy, based on baseline scans with a sensitivity of 71% and specificity of 86%, although the study used a relatively small sample of 16 participants. Studies applying these methods to predict response to medication have found less-promising results, with one study using the same face-processing task finding nonsignificant classification results.120 Nonetheless, this is still a relatively unexplored area that may still provide some interesting insights, especially given the success seen in diagnostic classification studies.
Some studies have also used SVM classifiers with resting state functional connectivity data and have shown that medication-free patients and controls can be distinguished with around 95% accuracy.121,124 The most highly discriminative regions were the amygdala and frontal regions, including the ACC, complementing findings from other structural and functional studies in MDD. Furthermore, using an unsupervised classifier, which attempts to categorize cases purely on their intrinsic characteristics, rather than fitting cases into categories defined by the experimenter, Zeng et al125 showed that the resting state connectivity of the ACC allowed individuals to be grouped with 92.5% consistency with their diagnostic labels, providing further evidence there are distinct patterns of functionality at rest that characterize MDD. Indeed, it is possible that in the future, these techniques might form the basis for the division of MDD into neurobiologically distinct subtypes that could further improve diagnosis and treatment.
Machine learning and diffusion tensor imaging
Machine learning techniques have also begun to be used in conjunction with DTI to identify patterns of white matter deficits that can distinguish between patients and HCs. Korgaonkar et al126 applied linear discriminant analysis to multiple DTI measures from medication-free MDD patients and controls and were able to classify individuals with an accuracy of 96%. Similarly, Fang et al127 used machine learning in combination with whole-brain structural connectivity maps derived from DTI to classify individuals as either patients or controls, according to the strength of connectivity between different brain regions. This method achieved an accuracy of 91.7%, indicating that machine learning techniques combined with DTI data can correctly distinguish patients from controls with a high degree of accuracy and providing further evidence for white matter microstructural differences in MDD.
Neurofeedback and neuroimaging-based treatments
Recent developments in fMRI have enabled researchers to explore its potential for use as a treatment itself, rather than simply aiding treatment with psychological or pharmacological therapies. A number of recent studies have shown that when provided with real-time feedback of blood oxygen level – dependent signals while in the scanner, healthy participants are able to regulate the activity and connectivity of brain structures involved in emotion processing, many of which have been implicated in MDD.128–131 Building on this, it has been proposed that neurofeedback may be able to correct functional abnormalities seen in these networks in MDD132 by allowing patients to learn how to regulate activity, thereby correcting the impaired regulation present in the disorder. One recent small-scale pilot study of this therapy has shown promising results.133 Patients were instructed to increase activity in areas involved in positive affect by recalling positive memories, and after four sessions, a significant reduction in depressive symptoms was seen in comparison with members of a control group, who performed a similar positive memory recall task without neurofeedback. However, it is important to note the significant limitations of this study, such as the out-of-scanner control task, which may have led to an overestimation of the effect of the treatment, and the inclusion of an entirely male sample, which limits generalizability.
Another recent study used a similar procedure but included an active control condition in which participants were given feedback from an area not thought to be involved in emotion processing, the intraparietal sulcus.134 Regulation of the left amygdala while remembering positive memories resulted in an increase of self-reported happiness immediately after the session, but the longer-term effects of this procedure were not assessed.
Evidence for the efficacy of neurofeedback is very limited at present and larger-scale, blinded, randomized-controlled trials will be required to evaluate its potential for clinical use. Furthermore, it will be important to determine an optimal control intervention for these trials and the most effective aspect of brain function to target. Nevertheless, these early studies indicate it may be a promising candidate for a neuroimaging-based treatment for MDD.
Conclusion
Integrative pathways of mood regulation as diagnostic biomarkers
Neuroimaging research suggests that abnormalities in depression occur in a number of functionally interactive cortical and subcortical brain regions (please see Phillips et al135,136 for a comprehensive review). Subcortical areas that include thalamus and ventral striatum are implicated in the processing of novel emotional and nonemotional information, whereas limbic regions such as the amygdala and the hippocampus complex play an important role in mood monitoring.137,138 These two regions functionally interact, and neuroimaging studies have demonstrated that amygdala activation correlates with emotional memory.139,140 Moreover, the hippocampus has been shown to be susceptible to emotional experiences and to contribute to emotional recognition.141,142 For example, enhanced neural responses to emotionally valenced stimuli have been found in the amygdala and hippocampus.143,144
Prefrontal regions, and particularly medial cortical areas, exercise active cognitive control and conscious appraisal of emotional state.145 The prefrontal cortex is particularly important in top-down emotional control over limbic regions, especially when stimulus-outcome contingencies are important146 and the medial part of the prefrontal cortex, which includes orbitofrontal cortex (OFC), dorsomedial prefrontal cortex, and the ACC, is pivotal in controlling emotional behaviors via extensive subcortical connections.136,147 The lateral prefrontal cortical areas, which include the dorsolateral and ventrolateral prefrontal cortices, are known to coordinate higher cortical functions involved in top-down voluntary modulation of positive and negative emotions.136,148,149 Feedback neuronal connections coordinate communication between the lateral prefrontal areas and the ventromedial prefrontal cortex136,147 and between the dorsolateral prefrontal cortex and cortical associative areas, OFC, and subcortical structures involved in emotion regulation, such as the thalamus, hippocampus, and dorsal striatum.136,150
In depression, abnormalities in these functional networks have been demonstrated relatively consistently across studies, as shown by several recent meta-analyses,151–153 and have been interpreted as reflecting dysfunctional regulation of subcortical activity by frontal areas during emotion processing, leading to suboptimal maintenance of affective states.154 This view is further supported by fMRI studies showing impaired connectivity between frontal and limbic regions,155–157 although DTI studies do not provide strong evidence of impaired structural connectivity between these areas.
These functional and structural changes in mood regulation systems have the potential for use as diagnostic biomarkers for MDD, as well as for future neurobiology-based classification and diagnostic systems. The growing amount of evidence reviewed here shows that machine learning methods can allow individual-level discrimination of MDD patients from healthy controls, according to structural and functional differences in regions involved in mood regulation, and may also be able to distinguish MDD from similar conditions such as BD. To date, there have been no attempts to diagnose MDD on the basis of combined data from multiple imaging modalities. This may be an area of interest for future research, as combining information from multiple sources may provide greater accuracy than data from any one source alone.
Neuroimaging and candidate biomarkers of response to treatment
A morphometric reduction in the hippocampus is to date the most replicated structural finding linked to prediction of treatment response and to greater volumetric loss in the hippocampus associated with poorer treatment response.34,158 With regard to functional findings, hyperactivity in the ACC has been associated with response to treatment, normalizing after a course of treatment. Persistence of hyperactivity in this region has been shown to help identify poor treatment responders. Amygdala hyperactivity in response to negative emotions has been demonstrated to be characteristic of a depressed state and is sensitive to clinical improvement after a course of antidepressant treatment.46 These findings suggest that structural and functional neuroimaging could contribute to the prediction of treatment response, and recent studies using machine learning methods indicate it is possible to predict treatment response at an individual level with a high degree of accuracy.
Another intriguing development is the possibility of determining differential treatment effectiveness for a given individual, based on neuroimaging measures. The results of McGrath et al91 are revealing in this respect by suggesting the baseline metabolism in the insula may help determine whether a patient is likely to respond preferentially to pharmacological or psychological interventions. fMRI studies also suggest that ACC activity differentially predicts response to pharmacological and psychological treatment, although this needs further validation in future studies prospectively evaluating clinical benefits on larger naturalistic samples.
Limitations
The role of neuroimaging is likely to expand in the future to improve diagnostic specificity and help predict treatment response. At present, neuroimaging is unlikely to benefit patients at an individual level, to predict transition to a full syndrome in an “at-risk” mental state, or to help clarifying diagnostic uncertainty. With reference to cross-diagnostic validity, this is one of the greatest challenges faced by biological models of psychiatric disorders at present,159–161 with a paucity of studies allowing cross-diagnostic comparisons. As a result, there are no neuroimaging-based biomarkers that can aid in the differential diagnosis of MDD, and this is a major challenge that will need to be overcome if they are to ever be clinically useful.
By far the main limitation is the relatively limited replicability of most findings, which questions the generalizability of neurobiological models and limits their diagnostic use. Discrepancies can result from heterogeneity of depressive disorders, inclusion/exclusion of comorbidity, sample size, methodological differences, clinical differences in the patients included (eg, number of episodes, length of illness, degree of treatment resistance, presence and length of pharmacological treatment), and analysis techniques. In the case of fMRI, it is also possible that different interventions modulate brain circuitry differently, depending on which component they act on in the context of the hypothesis tested and in relation to task requirement. Some of these issues could be ameliorated by the use of larger samples, encompassing a range of MDD presentations, or by comparing subtypes of MDD and different treatments to understand the factors underlying the observed heterogeneity in results. Moreover, the field would greatly benefit from a degree of standardization of techniques across research groups and collaborative alliances, resulting in much larger numbers of participants available for analysis.
Of particular interest, participants in these studies tend to be highly selected individuals who differ from patients seen in the clinic with potentially milder severity of illness and absence of comorbidities, and therefore are not necessarily fully representative of the condition. In this context, and from a pragmatic perspective, naturalistic studies in larger samples might be better suited to identifying biomarkers that reflect conventional clinical populations.
Furthermore, there is little research using neuroimaging in people at high risk for depression. Some findings suggest that some of the structural and functional differences seen in MDD patients may also be present in healthy individuals at genetic risk of developing the condition.30 This is an important issue, as it is likely that diagnostic biomarkers based on these differences could mistakenly diagnose these individuals as patients, despite being healthy. Conversely, individuals with MDD who do not have particular genetic variants associated with altered brain function and structure may be incorrectly diagnosed as healthy because of their reliance on trait, rather than state markers of MDD.
Although machine learning methods have been able to produce results at the level of individual patients, the accuracy of these methods is currently not high enough to permit their use in practice. In particular, most diagnostic studies do not achieve specificities close to 100%. Given the relatively low proportion of the population that has MDD, this would result in a large number of false-positives (see Lalkhen and McCluskey162 for further discussion on this issue). This is less of a concern with regard to prognosis because of the relatively high number of patients who will respond to a given intervention. In addition, even a test with high but not perfect sensitivity and specificity would arguably be an improvement on the current system of prescription or choice of therapeutic modality based solely on clinicians’ judgment.
Finally, an important issue in the development of any biomarker for the prediction of treatment response is whether it predicts response to treatment specifically or is predictive of prognosis, independent of the treatment being tested. In depression, factors such as spontaneous remission may account for a large proportion of improvement seen with treatment,163 and it is impossible to tell whether predictive biomarkers are, in fact, predicting improvement because of treatment. This problem could potentially be avoided by including placebo treatment groups, although this is often not possible because of ethical considerations. Alternatively, this could be addressed, as shown by a recent study,164 by integrating neuroimaging protocols into future clinical trials. Comparisons of predictive biomarkers for multiple treatments also might allow markers that are specific to individual treatments to be distinguished from those that are predictive of general improvement.
Acknowledgments
TW and AJC receive funding support from the National Institute for Health Research Mental Health Biomedical Research Centre at South London and Maudsley National Health Service Foundation Trust and King’s College London. DA is a National Institute for Health Research clinical lecturer, and his research is supported by the Academy of Medical Sciences. AH is funded by the Advanced Human Capital Programme of the National Commission for Scientific and Technological Research (CONICYT) Bicentennial Becas-Chile Scholarship. The views expressed are those of the authors and not necessarily those of the National Health Service, the National Institute for Health Research, the Academy of Medical Sciences, the Department of Health, or CONICYT.
Disclosure
Within the last 3 years, AJC has received honoraria for speaking from AstraZeneca and Pfizer and received research grant support from Lundbeck. AHY is employed by King’s College London and South London and Maudsley NHS Foundation Trust; has given paid lectures and sits on advisory boards for all major pharmaceutical companies with drugs used in affective and related disorders; is lead investigator for the EMBOLDEN study, BCI Neuroplasticity study, and Aripiprazole Mania Study and investigator-initiated studies from AstraZeneca, Eli Lilly, Lundbeck, and Wyeth; has received grant funding from the National Institute of Mental Health, the Canadian Institutes of Health Research, the Brain and Behavior Research Foundation, the Stanley Medical Research Institute, the Medical Research Council, the Wellcome Trust, the Royal College of Physicians, the British Medical Association; UBC-VGH Foundation, the Western Economic Diversification Canada, CCS Depression Research Fund, and the Michael Smith Foundation for Health Research, National Institute for Health Research. DA has received travel grants from Janssen-Cilag and Servier. TW and AH report no conflicts of interest in this work.
References
Kessler RC, Berglund P, Demler O, et al; National Comorbidity Survey Replication. The epidemiology of major depressive disorder: results from the National Comorbidity Survey Replication (NCS-R). JAMA. 2003;289(23):3095–3105. | ||
Insel TR, Voon V, Nye JS, et al. Innovative solutions to novel drug development in mental health. Neurosci Biobehav Rev. 2013;37(10 Pt 1):2438–2444. | ||
Leuchter AF, Cook IA, Hamilton SP, et al. Biomarkers to predict antidepressant response. Curr Psychiatry Rep. 2010;12(6):553–562. | ||
Arnone D, Cavanagh J, Gerber D, Lawrie SM, Ebmeier KP, McIntosh AM. Magnetic resonance imaging studies in bipolar disorder and schizophrenia: meta-analysis. Br J Psychiatry. 2009;195(3):194–201. | ||
Arnone D, McIntosh AM, Ebmeier KP, Munafò MR, Anderson IM. Magnetic resonance imaging studies in unipolar depression: systematic review and meta-regression analyses. Eur Neuropsychopharmacol. 2012;22(1):1–16. | ||
Abe O, Yamasue H, Kasai K, et al. Voxel-based analyses of gray/white matter volume and diffusion tensor data in major depression. Psychiatry Res. 2010;181(1):64–70. | ||
Salvadore G, Nugent AC, Lemaitre H, et al. Prefrontal cortical abnormalities in currently depressed versus currently remitted patients with major depressive disorder. Neuroimage. 2011;54(4):2643–2651. | ||
van Tol M-J, van der Wee NJA, van den Heuvel OA, et al. Regional brain volume in depression and anxiety disorders. Arch Gen Psychiatry. 2010;67(10):1002–1011. | ||
Botteron KN, Raichle ME, Drevets WC, Heath AC, Todd RD. Volumetric reduction in left subgenual prefrontal cortex in early onset depression. Biol Psychiatry. 2002;51(4):342–344. | ||
Ballmaier M, Toga AW, Blanton RE, et al. Anterior cingulate, gyrus rectus, and orbitofrontal abnormalities in elderly depressed patients: an MRI-based parcellation of the prefrontal cortex. Am J Psychiatry. 2004;161(1):99–108. | ||
Serra-Blasco M, Portella MJ, Gómez-Ansón B, et al. Effects of illness duration and treatment resistance on grey matter abnormalities in major depression. Br J Psychiatry. 2013;202(6):434–440. | ||
Shah PJ, Glabus MF, Goodwin GM, Ebmeier KP. Chronic, treatment-resistant depression and right fronto-striatal atrophy. Br J Psychiatry. 2002;180(5):434–440. | ||
Bora E, Fornito A, Pantelis C, Yücel M. Gray matter abnormalities in Major Depressive Disorder: a meta-analysis of voxel based morphometry studies. J Affect Disord. 2012;138(1–2):9–18. | ||
Lai C-H. Gray matter volume in major depressive disorder: a meta-analysis of voxel-based morphometry studies. Psychiatry Res. 2013;211(1):37–46. | ||
Soriano-Mas C, Hernández-Ribas R, Pujol J, et al. Cross-sectional and longitudinal assessment of structural brain alterations in melancholic depression. Biol Psychiatry. 2011;69(4):318–325. | ||
Ma C, Ding J, Li J, et al. Resting-state functional connectivity bias of middle temporal gyrus and caudate with altered gray matter volume in major depression. PLoS ONE. 2012;7(9):e45263. | ||
Zou K, Deng W, Li T, et al. Changes of brain morphometry in first-episode, drug-naïve, non-late-life adult patients with major depression: an optimized voxel-based morphometry study. Biol Psychiatry. 2010;67(2):186–188. | ||
Kim MJ, Hamilton JP, Gotlib IH. Reduced caudate gray matter volume in women with major depressive disorder. Psychiatry Res. 2008;164(2): 114–122. | ||
Sheline YI, Gado MH, Kraemer HC. Untreated depression and hippocampal volume loss. Am J Psychiatry. 2003;160(8):1516–1518. | ||
Bremner JD, Narayan M, Anderson ER, Staib LH, Miller HL, Charney DS. Hippocampal volume reduction in major depression. Am J Psychiatry. 2000;157(1):115–118. | ||
Frodl T, Meisenzahl EM, Zetzsche T, et al. Hippocampal changes in patients with a first episode of major depression. Am J Psychiatry. 2002;159(7):1112–1118. | ||
Neumeister A, Wood S, Bonne O, et al. Reduced hippocampal volume in unmedicated, remitted patients with major depression versus control subjects. Biol Psychiatry. 2005;57(8):935–937. | ||
Frodl T, Meisenzahl EM, Zetzsche T, et al. Hippocampal and amygdala changes in patients with major depressive disorder and healthy controls during a 1-year follow-up. J Clin Psychiatry. 2004;65(4):492–499. | ||
Frodl T, Meisenzahl E, Zetzsche T, et al. Enlargement of the amygdala in patients with a first episode of major depression. Biol Psychiatry. 2002;51(9):708–714. | ||
Harrison PJ. The neuropathology of primary mood disorder. Brain. 2002;125(Pt 7):1428–1449. | ||
Stockmeier CA, Mahajan GJ, Konick LC, et al. Cellular changes in the postmortem hippocampus in major depression. Biol Psychiatry. 2004;56(9):640–650. | ||
Kempton MJ, Salvador Z, Munafò MR, et al. Structural neuroimaging studies in major depressive disorder. Meta-analysis and comparison with bipolar disorder. Arch Gen Psychiatry. 2011;68(7):675–690. | ||
Videbech P, Ravnkilde B. Hippocampal volume and depression: a meta-analysis of MRI studies. Am J Psychiatry. 2004;161(11):1957–1966. | ||
Posener JA, Wang L, Price JL, et al. High-dimensional mapping of the hippocampus in depression. Am J Psychiatry. 2003;160(1):83–89. | ||
Amico F, Meisenzahl E, Koutsouleris N, Reiser M, Möller H-J, Frodl T. Structural MRI correlates for vulnerability and resilience to major depressive disorder. J Psychiatry Neurosci. 2011;36(1):15–22. | ||
MacQueen G, Frodl T. The hippocampus in major depression: evidence for the convergence of the bench and bedside in psychiatric research? Mol Psychiatry. 2011;16(3):252–264. | ||
Arnone D, McKie S, Elliott R, et al. State-dependent changes in hippocampal grey matter in depression. Mol Psychiatry. 2013;18(12): 1265–1272. | ||
Vakili K, Pillay SS, Lafer B, et al. Hippocampal volume in primary unipolar major depression: a magnetic resonance imaging study. Biol Psychiatry. 2000;47(12):1087–1090. | ||
MacQueen GM, Yucel K, Taylor VH, Macdonald K, Joffe R. Posterior hippocampal volumes are associated with remission rates in patients with major depressive disorder. Biol Psychiatry. 2008;64(10):880–883. | ||
Sämann PG, Höhn D, Chechko N, et al. Prediction of antidepressant treatment response from gray matter volume across diagnostic categories. Eur Neuropsychopharmacol. 2013;23(11):1503–1515. | ||
Chen C-H, Ridler K, Suckling J, et al. Brain imaging correlates of depressive symptom severity and predictors of symptom improvement after antidepressant treatment. Biol Psychiatry. 2007;62(5):407–414. | ||
Toki S, Okamoto Y, Onoda K, et al. Hippocampal activation during associative encoding of word pairs and its relation to symptomatic improvement in depression: a functional and volumetric MRI study. J Affect Disord. 2014;152–154:462–467. | ||
Lai C-H, Hsu Y-Y. A subtle grey-matter increase in first-episode, drug-naive major depressive disorder with panic disorder after 6 weeks’ duloxetine therapy. Int J Neuropsychopharmacol. 2011;14(2):225–235. | ||
Lawrence NS, Williams AM, Surguladze S, et al. Subcortical and ventral prefrontal cortical neural responses to facial expressions distinguish patients with bipolar disorder and major depression. Biol Psychiatry. 2004;55(6):578–587. | ||
Siegle GJ, Thompson W, Carter CS, Steinhauer SR, Thase ME. Increased amygdala and decreased dorsolateral prefrontal BOLD responses in unipolar depression: related and independent features. Biol Psychiatry. 2007;61(2):198–209. | ||
Kerestes R, Bhagwagar Z, Nathan PJ, et al. Prefrontal cortical response to emotional faces in individuals with major depressive disorder in remission. Psychiatry Res. 2012;202(1):30–37. | ||
Yoshimura S, Okamoto Y, Onoda K, et al. Rostral anterior cingulate cortex activity mediates the relationship between the depressive symptoms and the medial prefrontal cortex activity. J Affect Disord. 2010;122(1–2):76–85. | ||
Fu CHY, Williams SCR, Cleare AJ, et al. Attenuation of the neural response to sad faces in major depression by antidepressant treatment: a prospective, event-related functional magnetic resonance imaging study. Arch Gen Psychiatry. 2004;61(9):877–889. | ||
Gotlib IH, Sivers H, Gabrieli JDE, et al. Subgenual anterior cingulate activation to valenced emotional stimuli in major depression. Neuroreport. 2005;16(16):1731–1734. | ||
Mitterschiffthaler MT, Williams SCR, Walsh ND, et al. Neural basis of the emotional Stroop interference effect in major depression. Psychol Med. 2008;38(2):247–256. | ||
Arnone D, McKie S, Elliott R, et al. Increased amygdala responses to sad but not fearful faces in major depression: relation to mood state and pharmacological treatment. Am J Psychiatry. 2012;169(8):841–850. | ||
Abler B, Erk S, Herwig U, Walter H. Anticipation of aversive stimuli activates extended amygdala in unipolar depression. J Psychiatr Res. 2007;41(6):511–522. | ||
Peluso MAM, Glahn DC, Matsuo K, et al. Amygdala hyperactivation in untreated depressed individuals. Psychiatry Res. 2009;173(2):158–161. | ||
Victor TA, Furey ML, Fromm SJ, Ohman A, Drevets WC. Relationship between amygdala responses to masked faces and mood state and treatment in major depressive disorder. Arch Gen Psychiatry. 2010;67(11):1128–1138. | ||
Pizzagalli DA, Holmes AJ, Dillon DG, et al. Reduced caudate and nucleus accumbens response to rewards in unmedicated individuals with major depressive disorder. Am J Psychiatry. 2009;166(6):702–710. | ||
McCabe C, Cowen PJ, Harmer CJ. Neural representation of reward in recovered depressed patients. Psychopharmacology (Berl). 2009;205(4):667–677. | ||
Robinson OJ, Cools R, Carlisi CO, Sahakian BJ, Drevets WC. Ventral striatum response during reward and punishment reversal learning in unmedicated major depressive disorder. Am J Psychiatry. 2012;169(2):152–159. | ||
Diler RS, de Almeida JRC, Ladouceur C, Birmaher B, Axelson D, Phillips M. Neural activity to intense positive versus negative stimuli can help differentiate bipolar disorder from unipolar major depressive disorder in depressed adolescents: a pilot fMRI study. Psychiatry Res. 2013;214(3):277–284. | ||
Grotegerd D, Stuhrmann A, Kugel H, et al. Amygdala excitability to subliminally presented emotional faces distinguishes unipolar and bipolar depression: An fMRI and pattern classification study. Hum Brain Mapp. 2014;35(7):2995–3007. | ||
Anand A, Li Y, Wang Y, Gardner K, Lowe MJ. Reciprocal effects of antidepressant treatment on activity and connectivity of the mood regulating circuit: an FMRI study. J Neuropsychiatry Clin Neurosci. 2007;19(3):274–282. | ||
Keedwell P, Drapier D, Surguladze S, Giampietro V, Brammer M, Phillips M. Neural markers of symptomatic improvement during antidepressant therapy in severe depression: subgenual cingulate and visual cortical responses to sad, but not happy, facial stimuli are correlated with changes in symptom score. J Psychopharmacol. 2009;23(7):775–788. | ||
Fales CL, Barch DM, Rundle MM, et al. Antidepressant treatment normalizes hypoactivity in dorsolateral prefrontal cortex during emotional interference processing in major depression. J Affect Disord. 2009;112(1–3):206–211. | ||
Harmer CJ, Goodwin GM, Cowen PJ. Why do antidepressants take so long to work? A cognitive neuropsychological model of antidepressant drug action. Br J Psychiatry. 2009;195(2):102–108. | ||
Pringle A, Browning M, Cowen PJ, Harmer CJ. A cognitive neuropsychological model of antidepressant drug action. Prog Neuropsychopharmacol Biol Psychiatry. 2011;35(7):1586–1592. | ||
Ruhé HG, Booij J, Veltman DJ, Michel MC, Schene AH. Successful pharmacologic treatment of major depressive disorder attenuates amygdala activation to negative facial expressions: a functional magnetic resonance imaging study. J Clin Psychiatry. 2012;73(4):451–459. | ||
Fu CH, Williams SC, Brammer MJ, et al. Neural responses to happy facial expressions in major depression following antidepressant treatment. Am J Psychiatry. 2007;164(4):599–607. | ||
Fu CHY, Williams SCR, Cleare AJ, et al. Neural responses to sad facial expressions in major depression following cognitive behavioral therapy. Biol Psychiatry. 2008;64(6):505–512. | ||
Ritchey M, Dolcos F, Eddington KM, Strauman TJ, Cabeza R. Neural correlates of emotional processing in depression: changes with cognitive behavioral therapy and predictors of treatment response. J Psychiatr Res. 2011;45(5):577–587. | ||
Dichter GS, Felder JN, Petty C, Bizzell J, Ernst M, Smoski MJ. The effects of psychotherapy on neural responses to rewards in major depression. Biol Psychiatry. 2009;66(9):886–897. | ||
Roy M, Harvey P-O, Berlim MT, et al. Medial prefrontal cortex activity during memory encoding of pictures and its relation to symptomatic improvement after citalopram treatment in patients with major depression. J Psychiatry Neurosci. 2010;35(3):152–162. | ||
Davidson RJ, Irwin W, Anderle MJ, Kalin NH. The neural substrates of affective processing in depressed patients treated with venlafaxine. Am J Psychiatry. 2003;160(1):64–75. | ||
Walsh ND, Williams SCR, Brammer MJ, et al. A longitudinal functional magnetic resonance imaging study of verbal working memory in depression after antidepressant therapy. Biol Psychiatry. 2007;62(11):1236–1243. | ||
Langenecker SA, Kennedy SE, Guidotti LM, et al. Frontal and limbic activation during inhibitory control predicts treatment response in major depressive disorder. Biol Psychiatry. 2007;62(11):1272–1280. | ||
Frodl T, Scheuerecker J, Schoepf V, et al. Different effects of mirtazapine and venlafaxine on brain activation: an open randomized controlled fMRI study. J Clin Psychiatry. 2011;72(4):448–457. | ||
Samson AC, Meisenzahl E, Scheuerecker J, et al. Brain activation predicts treatment improvement in patients with major depressive disorder. J Psychiatr Res. 2011;45(9):1214–1222. | ||
Wagner G, Koch K, Schachtzabel C, et al. Differential effects of serotonergic and noradrenergic antidepressants on brain activity during a cognitive control task and neurofunctional prediction of treatment outcome in patients with depression. J Psychiatry Neurosci. 2010;35(4):247–257. | ||
Miller JM, Schneck N, Siegle GJ, et al. fMRI response to negative words and SSRI treatment outcome in major depressive disorder: a preliminary study. Psychiatry Res. 2013;214(3):296–305. | ||
Siegle GJ, Thompson WK, Collier A, et al. Toward clinically useful neuroimaging in depression treatment: prognostic utility of subgenual cingulate activity for determining depression outcome in cognitive therapy across studies, scanners, and patient characteristics. Arch Gen Psychiatry. 2012;69(9):913–924. | ||
Siegle GJ, Carter CS, Thase ME. Use of fMRI to predict recovery from unipolar depression with cognitive behavior therapy. Am J Psychiatry. 2006;163(4):735–738. | ||
Greicius MD, Flores BH, Menon V, et al. Resting-state functional connectivity in major depression: abnormally increased contributions from subgenual cingulate cortex and thalamus. Biol Psychiatry. 2007;62(5):429–437. | ||
Sheline YI, Price JL, Yan Z, Mintun MA. Resting-state functional MRI in depression unmasks increased connectivity between networks via the dorsal nexus. Proc Natl Acad Sci U S A. 2010;107(24):11020–11025. | ||
Marchetti I, Koster EHW, Sonuga-Barke EJ, De Raedt R. The default mode network and recurrent depression: a neurobiological model of cognitive risk factors. Neuropsychol Rev. 2012;22(3):229–251. | ||
Zhang X, Zhu X, Wang X, et al. First-episode medication-naive major depressive disorder is associated with altered resting brain function in the affective network. PLoS ONE. 2014;9(1):e85241. | ||
Veer IM, Beckmann CF, van Tol M-J, et al. Whole brain resting-state analysis reveals decreased functional connectivity in major depression. Front Syst Neurosci. 2010;4:41. | ||
Liu C-H, Ma X, Wu X, et al. Regional homogeneity of resting-state brain abnormalities in bipolar and unipolar depression. Prog Neuropsychopharmacol Biol Psychiatry. 2013;41:52–59. | ||
Li B, Liu L, Friston KJ, et al. A treatment-resistant default mode subnetwork in major depression. Biol Psychiatry. 2013;74(1):48–54. | ||
Anand A, Li Y, Wang Y, et al. Antidepressant effect on connectivity of the mood-regulating circuit: an fMRI study. Neuropsychopharmacology. 2005;30(7):1334–1344. | ||
Lui S, Wu Q, Qiu L, et al. Resting-state functional connectivity in treatment-resistant depression. Am J Psychiatry. 2011;168(6):642–648. | ||
Goldapple K, Segal Z, Garson C, et al. Modulation of cortical-limbic pathways in major depression: treatment-specific effects of cognitive behavior therapy. Arch Gen Psychiatry. 2004;61(1):34–41. | ||
Kennedy SH, Evans KR, Krüger S, et al. Changes in regional brain glucose metabolism measured with positron emission tomography after paroxetine treatment of major depression. Am J Psychiatry. 2001;158(6):899–905. | ||
Kennedy SH, Konarski JZ, Segal ZV, et al. Differences in brain glucose metabolism between responders to CBT and venlafaxine in a 16-week randomized controlled trial. Am J Psychiatry. 2007;164(5):778–788. | ||
Mayberg HS, Brannan SK, Tekell JL, et al. Regional metabolic effects of fluoxetine in major depression: serial changes and relationship to clinical response. Biol Psychiatry. 2000;48(8):830–843. | ||
Mayberg HS. Modulating limbic-cortical circuits in depression: targets of antidepressant treatments. Semin Clin Neuropsychiatry. 2002;7(4):255–268. | ||
Nobler MS, Oquendo MA, Kegeles LS, et al. Decreased regional brain metabolism after ect. Am J Psychiatry. 2001;158(2):305–308. | ||
Sheline YI, Barch DM, Donnelly JM, Ollinger JM, Snyder AZ, Mintun MA. Increased amygdala response to masked emotional faces in depressed subjects resolves with antidepressant treatment: an fMRI study. Biol Psychiatry. 2001;50(9):651–658. | ||
McGrath CL, Kelley ME, Holtzheimer PE, et al. Toward a neuroimaging treatment selection biomarker for major depressive disorder. JAMA Psychiatry. 2013;70(8):821–829. | ||
Miller JM, Hesselgrave N, Ogden RT, et al. Brain serotonin 1A receptor binding as a predictor of treatment outcome in major depressive disorder. Biol Psychiatry. 2013;74(10):760–767. | ||
Drevets WC, Thase ME, Moses-Kolko EL, et al. Serotonin-1A receptor imaging in recurrent depression: replication and literature review. Nucl Med Biol. 2007;34(7):865–877. | ||
Shrestha S, Hirvonen J, Hines CS, et al. Serotonin-1A receptors in major depression quantified using PET: controversies, confounds, and recommendations. Neuroimage. 2012;59(4):3243–3251. | ||
Lothe A, Saoud M, Bouvard S, Redouté J, Lerond J, Ryvlin P. 5-HT(1A) receptor binding changes in patients with major depressive disorder before and after antidepressant treatment: a pilot [18F]MPPF positron emission tomography study. Psychiatry Res. 2012;203(1):103–104. | ||
Moses-Kolko EL, Price JC, Thase ME, et al. Measurement of 5-HT1A receptor binding in depressed adults before and after antidepressant drug treatment using positron emission tomography and [11C]WAY-100635. Synapse. 2007;61(7):523–530. | ||
Wu F, Tang Y, Xu K, et al. White matter abnormalities in medication-naive subjects with a single short-duration episode of major depressive disorder. Psychiatry Res. 2011;191(1):80–83. | ||
Zou K, Huang X, Li T, et al. Alterations of white matter integrity in adults with major depressive disorder: a magnetic resonance imaging study. J Psychiatry Neurosci. 2008;33(6):525–530. | ||
Guo WB, Liu F, Chen JD, et al. Altered white matter integrity of forebrain in treatment-resistant depression: a diffusion tensor imaging study with tract-based spatial statistics. Prog Neuropsychopharmacol Biol Psychiatry. 2012;38(2):201–206. | ||
Murphy ML, Carballedo A, Fagan AJ, et al. Neurotrophic tyrosine kinase polymorphism impacts white matter connections in patients with major depressive disorder. Biol Psychiatry. 2012;72(8):663–670. | ||
Choi KS, Holtzheimer PE, Franco AR, et al. Reconciling variable findings of white matter integrity in major depressive disorder. Neuropsychopharmacology. 2014;39(6):1332–1339. | ||
Korgaonkar MS, Grieve SM, Koslow SH, Gabrieli JDE, Gordon E, Williams LM. Loss of white matter integrity in major depressive disorder: evidence using tract-based spatial statistical analysis of diffusion tensor imaging. Hum Brain Mapp. 2011;32(12):2161–2171. | ||
Dalby RB, Frandsen J, Chakravarty MM, et al. Depression severity is correlated to the integrity of white matter fiber tracts in late-onset major depression. Psychiatry Res. 2010;184(1):38–48. | ||
Zhang A, Leow A, Ajilore O, et al. Quantitative tract-specific measures of uncinate and cingulum in major depression using diffusion tensor imaging. Neuropsychopharmacology. 2012;37(4):959–967. | ||
Taylor WD, MacFall JR, Gerig G, Krishnan RR. Structural integrity of the uncinate fasciculus in geriatric depression: Relationship with age of onset. Neuropsychiatr Dis Treat. 2007;3(5):669–674. | ||
Wang T, Huang X, Huang P, et al. Early-stage psychotherapy produces elevated frontal white matter integrity in adult major depressive disorder. PLoS ONE. 2013;8(4):e63081. | ||
Alexopoulos GS, Kiosses DN, Choi SJ, Murphy CF, Lim KO. Frontal white matter microstructure and treatment response of late-life depression: a preliminary study. Am J Psychiatry. 2002;159(11):1929–1932. | ||
Taylor WD, Kuchibhatla M, Payne ME, et al. Frontal white matter anisotropy and antidepressant remission in late-life depression. PLoS ONE. 2008;3(9):e3267. | ||
Zhou Y, Qin LD, Chen J, et al. Brain microstructural abnormalities revealed by diffusion tensor images in patients with treatment-resistant depression compared with major depressive disorder before treatment. Eur J Radiol. 2011;80(2):450–454. | ||
Delorenzo C, Delaparte L, Thapa-Chhetry B, Miller JM, Mann JJ, Parsey RV. Prediction of selective serotonin reuptake inhibitor response using diffusion-weighted MRI. Front Psychiatry. 2013;4:5. | ||
de Diego-Adeliño J, Pires P, Gómez-Ansón B, et al. Microstructural white-matter abnormalities associated with treatment resistance, severity and duration of illness in major depression. Psychol Med. 2013;44(06):1–12. | ||
Peng HJ, Zheng HR, Ning YP, et al. Abnormalities of cortical-limbic-cerebellar white matter networks may contribute to treatment-resistant depression: a diffusion tensor imaging study. BMC Psychiatry. 2013;13(1):72. | ||
Costafreda SG, Chu C, Ashburner J, Fu CHY. Prognostic and diagnostic potential of the structural neuroanatomy of depression. PLoS ONE. 2009;4(7):e6353. | ||
Gong Q, Wu Q, Scarpazza C, et al. Prognostic prediction of therapeutic response in depression using high-field MR imaging. Neuroimage. 2011;55(4):1497–1503. | ||
Mwangi B, Ebmeier KP, Matthews K, Steele JD. Multi-centre diagnostic classification of individual structural neuroimaging scans from patients with major depressive disorder. Brain. 2012;135(Pt 5):1508–1521. | ||
Smith R, Chen K, Baxter L, Fort C, Lane RD. Antidepressant effects of sertraline associated with volume increases in dorsolateral prefrontal cortex. J Affect Disord. 2013;146(3):414–419. | ||
Zeng L-L, Liu L, Liu Y, Shen H, Li Y, Hu D. Antidepressant treatment normalizes white matter volume in patients with major depression. PLoS ONE. 2012;7(8):e44248. | ||
Nouretdinov I, Costafreda SG, Gammerman A, et al. Machine learning classification with confidence: application of transductive conformal predictors to MRI-based diagnostic and prognostic markers in depression. Neuroimage. 2011;56(2):809–813. | ||
Costafreda S, Khanna A, Mourao-Miranda J, Fu C. Neural correlates of sad faces predict clinical remission to cognitive behavioural therapy in depression. Neuroreport. 2009;20(7):637–641. | ||
Fu CHY, Mourao-Miranda J, Costafreda SG, et al. Pattern classification of sad facial processing: toward the development of neurobiological markers in depression. Biol Psychiatry. 2008;63(7):656–662. | ||
Zeng L-L, Shen H, Liu L, et al. Identifying major depression using whole-brain functional connectivity: a multivariate pattern analysis. Brain. 2012;135(Pt 5):1498–1507. | ||
Hahn T, Marquand AF, Ehlis A-C, et al. Integrating neurobiological markers of depression. Arch Gen Psychiatry. 2011;68(4):361–368. | ||
Grotegerd D, Suslow T, Bauer J, et al. Discriminating unipolar and bipolar depression by means of fMRI and pattern classification: a pilot study. Eur Arch Psychiatry Clin Neurosci. 2013;263(2):119–131. | ||
Craddock RC, Holtzheimer PE III, Hu XP, Mayberg HS. Disease state prediction from resting state functional connectivity. Magn Reson Med. 2009;62(6):1619–1628. | ||
Zeng L-L, Shen H, Liu L, Hu D. Unsupervised classification of major depression using functional connectivity MRI. Hum Brain Mapp. 2014;35(4):1630–1641. | ||
Korgaonkar MS, Cooper NJ, Williams LM, Grieve SM. Mapping inter-regional connectivity of the entire cortex to characterize major depressive disorder: a whole-brain diffusion tensor imaging tractography study. Neuroreport. 2012;23(9):566–571. | ||
Fang P, Zeng L-L, Shen H, et al. Increased cortical-limbic anatomical network connectivity in major depression revealed by diffusion tensor imaging. PLoS ONE. 2012;7(9):e45972. | ||
Hamilton JP, Glover GH, Hsu J-J, Johnson RF, Gotlib IH. Modulation of subgenual anterior cingulate cortex activity with real-time neurofeedback. Hum Brain Mapp. 2011;32(1):22–31. | ||
Johnston SJ, Boehm SG, Healy D, Goebel R, Linden DEJ. Neurofeedback: A promising tool for the self-regulation of emotion networks. Neuroimage. 2010;49(1):1066–1072. | ||
Johnston S, Linden DEJ, Healy D, Goebel R, Habes I, Boehm SG. Upregulation of emotion areas through neurofeedback with a focus on positive mood. Cogn Affect Behav Neurosci. 2011;11(1):44–51. | ||
Zotev V, Phillips R, Young KD, Drevets WC, Bodurka J. Prefrontal control of the amygdala during real-time fMRI neurofeedback training of emotion regulation. PLoS ONE. 2013;8(11):e79184. | ||
Sulzer J, Haller S, Scharnowski F, et al. Real-time fMRI neurofeedback: progress and challenges. Neuroimage. 2013;76:386–399. | ||
Linden DEJ, Habes I, Johnston SJ, et al. Real-time self-regulation of emotion networks in patients with depression. PLoS ONE. 2012;7(6):e38115. | ||
Young KD, Zotev V, Phillips R, et al. Real-time fMRI neurofeedback training of amygdala activity in patients with major depressive disorder. PLoS ONE. 2014;9(2):e88785. | ||
Phillips ML, Drevets WC, Rauch SL, Lane R. Neurobiology of emotion perception I: The neural basis of normal emotion perception. Biol Psychiatry. 2003;54(5):504–514. | ||
Phillips ML, Ladouceur CD, Drevets WC. A neural model of voluntary and automatic emotion regulation: implications for understanding the pathophysiology and neurodevelopment of bipolar disorder. Mol Psychiatry. 2008;13(9):829, 833–857. | ||
Mayberg HS. Targeted electrode-based modulation of neural circuits for depression. J Clin Invest. 2009;119(4):717–725. | ||
Mayberg HS, Brannan SK, Mahurin RK, et al. Cingulate function in depression: a potential predictor of treatment response. Neuroreport. 1997;8(4):1057–1061. | ||
Cahill L, Haier RJ, Fallon J, et al. Amygdala activity at encoding correlated with long-term, free recall of emotional information. Proc Natl Acad Sci U S A. 1996;93(15):8016–8021. | ||
Hamann SB, Ely TD, Grafton ST, Kilts CD. Amygdala activity related to enhanced memory for pleasant and aversive stimuli. Nat Neurosci. 1999;2(3):289–293. | ||
McGaugh JL. The amygdala modulates the consolidation of memories of emotionally arousing experiences. Annu Rev Neurosci. 2004;27(1):1–28. | ||
Chavez CM, McGaugh JL, Weinberger NM. The basolateral amygdala modulates specific sensory memory representations in the cerebral cortex. Neurobiol Learn Mem. 2009;91(4):382–392. | ||
Canli T, Zhao Z, Brewer J, Gabrieli JDE, Cahill L. Event-related activation in the human amygdala associates with later memory for individual emotional experience. J Neurosci. 2000;20(19):RC99–RC99. | ||
Gur RC, Schroeder L, Turner T, et al. Brain activation during facial emotion processing. Neuroimage. 2002;16(3 Pt 1)(3, Part A):651–662. | ||
Adolphs R. Neural systems for recognizing emotion. Curr Opin Neurobiol. 2002;12(2):169–177. | ||
Gottfried JA, Dolan RJ. The nose smells what the eye sees: crossmodal visual facilitation of human olfactory perception. Neuron. 2003;39(2):375–386. | ||
Ongür D, Price JL. The organization of networks within the orbital and medial prefrontal cortex of rats, monkeys and humans. Cereb Cortex. 2000;10(3):206–219. | ||
Beauregard M, Lévesque J, Bourgouin P. Neural correlates of conscious self-regulation of emotion. J Neurosci. 2001;21(18):RC165. | ||
Lévesque J, Eugène F, Joanette Y, et al. Neural circuitry underlying voluntary suppression of sadness. Biol Psychiatry. 2003;53(6):502–510. | ||
Procyk E, Goldman-Rakic PS. Modulation of dorsolateral prefrontal delay activity during self-organized behavior. J Neurosci. 2006;26(44):11313–11323. | ||
Delvecchio G, Fossati P, Boyer P, et al. Common and distinct neural correlates of emotional processing in Bipolar Disorder and Major Depressive Disorder: a voxel-based meta-analysis of functional magnetic resonance imaging studies. Eur Neuropsychopharmacol. 2012;22(2):100–113. | ||
Groenewold NA, Opmeer EM, de Jonge P, Aleman A, Costafreda SG. Emotional valence modulates brain functional abnormalities in depression: evidence from a meta-analysis of fMRI studies. Neurosci Biobehav Rev. 2013;37(2):152–163. | ||
Hamilton JP, Etkin A, Furman DJ, Lemus MG, Johnson RF, Gotlib IH. Functional neuroimaging of major depressive disorder: a meta-analysis and new integration of base line activation and neural response data. Am J Psychiatry. 2012;169(7):693–703. | ||
Rive MM, van Rooijen G, Veltman DJ, Phillips ML, Schene AH, Ruhé HG. Neural correlates of dysfunctional emotion regulation in major depressive disorder. A systematic review of neuroimaging studies. Neurosci Biobehav Rev. 2013;37(10 Pt 2):2529–2553. | ||
Almeida JR, Kronhaus DM, Sibille EL, et al. Abnormal left-sided orbitomedial prefrontal cortical-amygdala connectivity during happy and fear face processing: a potential neural mechanism of female MDD. Front Psychiatry. 2011;2:69. | ||
Anand A, Li Y, Wang Y, et al. Activity and connectivity of brain mood regulating circuit in depression: a functional magnetic resonance study. Biol Psychiatry. 2005;57(10):1079–1088. | ||
Heller AS, Johnstone T, Shackman AJ, et al. Reduced capacity to sustain positive emotion in major depression reflects diminished maintenance of fronto-striatal brain activation. Proc Natl Acad Sci U S A. 2009;106(52):22445–22450. | ||
Hsieh M-H, McQuoid DR, Levy RM, Payne ME, MacFall JR, Steffens DC. Hippocampal volume and antidepressant response in geriatric depression. Int J Geriatr Psychiatry. 2002;17(6):519–525. | ||
Hiller W, Zaudig M, von Bose M. The overlap between depression and anxiety on different levels of psychopathology. J Affect Disord. 1989;16(2–3):223–231. | ||
Akiskal HS, Bourgeois ML, Angst J, Post R, Möller H, Hirschfeld R. Re-evaluating the prevalence of and diagnostic composition within the broad clinical spectrum of bipolar disorders. J Affect Disord. 2000;59(suppl 1):S5–S30. | ||
Brown TA, Di Nardo PA, Lehman CL, Campbell LA. Reliability of DSM-IV anxiety and mood disorders: implications for the classification of emotional disorders. J Abnorm Psychol. 2001;110(1):49–58. | ||
Lalkhen AG, McCluskey A. Clinical tests: sensitivity and specificity. Contin Educ Anaesth Crit Care Pain. 2008;8(6):221–223. | ||
Andrews G. Placebo response in depression: bane of research, boon to therapy. Br J Psychiatry. 2001;178(3):192–194. | ||
Posner J, Hellerstein DJ, Gat I, et al. Antidepressants normalize the default mode network in patients with dysthymia. JAMA Psychiatry. 2013;70(4):373–382. |
 © 2014 The Author(s). This work is published and licensed by Dove Medical Press Limited. The full terms of this license are available at https://www.dovepress.com/terms.php and incorporate the Creative Commons Attribution - Non Commercial (unported, v3.0) License.
By accessing the work you hereby accept the Terms. Non-commercial uses of the work are permitted without any further permission from Dove Medical Press Limited, provided the work is properly attributed. For permission for commercial use of this work, please see paragraphs 4.2 and 5 of our Terms.
© 2014 The Author(s). This work is published and licensed by Dove Medical Press Limited. The full terms of this license are available at https://www.dovepress.com/terms.php and incorporate the Creative Commons Attribution - Non Commercial (unported, v3.0) License.
By accessing the work you hereby accept the Terms. Non-commercial uses of the work are permitted without any further permission from Dove Medical Press Limited, provided the work is properly attributed. For permission for commercial use of this work, please see paragraphs 4.2 and 5 of our Terms.