")
Back to Journals » International Journal of Nanomedicine » Volume 10 » Issue 1
Development and molecular characterization of polymeric micro-nanofibrous scaffold of a defined 3-D niche for in vitro chemosensitivity analysis against acute myeloid leukemia cells
Authors Nair MS, Mony U, Menon D, Koyakutty M, Sidharthan N, Pavithran K, Nair SV, Menon K , Jojo A
Received 6 January 2015
Accepted for publication 15 February 2015
Published 15 May 2015 Volume 2015:10(1) Pages 3603—3622
DOI https://doi.org/10.2147/IJN.S80397
Checked for plagiarism Yes
Review by Single anonymous peer review
Peer reviewer comments 3
Editor who approved publication: Dr Thomas Webster
Maya S Nair,1 Ullas Mony,1 Deepthy Menon,1 Manzoor Koyakutty,1 Neeraj Sidharthan,2 Keechilat Pavithran,2 Shantikumar V Nair,1 Krishnakumar N Menon1
1Amrita Centre for Nanosciences and Molecular Medicine, 2Department of Oncology, Amrita Institute of Medical Sciences and Research Centre, Amrita Vishwa Vidyapeetham University, Kerala, India
Abstract: Standard in vitro drug testing employs 2-D tissue culture plate systems to test anti-leukemic drugs against cell adhesion-mediated drug-resistant leukemic cells that harbor in 3-D bone marrow microenvironments. This drawback necessitates the fabrication of 3-D scaffolds that have cell adhesion-mediated drug-resistant properties similar to in vivo niches. We therefore aimed at exploiting the known property of polyurethane (PU)/poly-L-lactic acid (PLLA) in forming a micro-nanofibrous structure to fabricate unique, not presented before, as far as we are aware, 3-D micro-nanofibrous scaffold composites using a thermally induced phase separation technique. Among the different combinations of PU/PLLA composites generated, the unique PU/PLLA 60:40 composite displayed micro-nanofibrous morphology similar to decellularized bone marrow with increased protein and fibronectin adsorption. Culturing of acute myeloid leukemia (AML) KG1a cells in FN-coated PU/PLLA 60:40 shows increased cell adhesion and cell adhesion-mediated drug resistance to the drugs cytarabine and daunorubicin without changing the original CD34+/CD38-/CD33- phenotype for 168 hours compared to fibronectin tissue culture plate systems. Molecularly, as seen in vivo, increased chemoresistance is associated with the upregulation of anti-apoptotic Bcl2 and the cell cycle regulatory protein p27Kip1leading to cell growth arrest. Abrogation of Bcl2 activity by the Bcl2-specific inhibitor ABT 737 led to cell death in the presence of both cytarabine and daunorubicin, demonstrating that the cell adhesion-mediated drug resistance induced by Bcl2 and p27Kip1in the scaffold was similar to that seen in vivo. These results thus show the utility of a platform technology, wherein drug testing can be performed before administering to patients without the necessity for stromal cells.
Keywords: daunorubicin, cytarabine, Bcl2, p27Kip1, cell adhesion-mediated drug resistance
Introduction
Hematological malignancy of acute myeloid leukemia (AML) type is highly heterogeneous with a high incidence of relapse averaging 30%–50% in less than 5 years due to drug resistance, even though 70%–80% patients undergo remission following induction chemotherapy.1–3 Inability to clear the entire population of AML cells following drug treatment has been attributed to the microenvironmental cell adhesion-mediated drug-resistance (CAMDR) cues provided by the bone marrow 3-D structure to AML cells.4 Differential interactions of AML cells with neighboring cells or with extracellular matrix (ECM) proteins in the bone marrow microenvironment have been shown to impart CAMDR to AML cells.5–10 In this crucial scenario, the interaction of very late antigen 4 (VLA 4) expressed by AML cells with stromal fibronectin (FN) plays a major role in CAMDR.1,11 Thus, cell adhesion to a 3-D matrix could be effectively exploited to cultivate these drug-resistant cells toward testing different experimental drugs for better therapy. Although 2-D systems do support cell adhesion of AML cells in the presence of FN, prolonged culture is not possible as it is in a 3-D environment.12,13 Two-dimensional systems cannot reproduce the microenvironmental complexity of a 3-D architecture and can only support the growth of cells for few days due to failure of the culture system that supports growth.12,13 Perhaps the absence of microenvironmental cues hampered the growth and survival of cells in tissue culture plate systems (TCPSs), pointing to the limitations associated with drug-screening studies using in vitro 2-D systems.12,13 Indeed, the residential 3-D microenvironmental organization of the bone marrow niche and its interactions with AML cells governs drug resistance as a result of the interaction between AML cells with the niche cellular proteins/cells.14,15 For example, interaction with FN has been shown to play a critical role in CAMDR. However, FN-coated 2-D environments versus FN-coated 3-D environments seemingly have different effects, as shown in this study itself. Thus, 3-D cell culture systems could provide a possible solution for this problem if one could simulate the bone marrow niche to a greater extent.4,16,17 There have been attempts to generate 3-D environments using the synthetic polymer polyurethane (PU) for the culture of AML cell lines.12 Similarly, mouse hematopoietic stem cells (HSCs) have been cultured on 3-D polymeric PU scaffold-based ex vivo systems.18 Recently, attempts have been made to culture AML cells using polyglycolic acid/poly-L-lactic acid (PGA/PLLA) 90:10 scaffold containing stromal cells.19 However, neither the similarity to bone marrow architecture nor a molecular characterization of the cells cultured in this scaffold was reported. Blending PU with other biocompatible scaffolding materials such as PLLA has yielded 3-D matrices having improved mechanical properties and cell binding.20–22 However, their closeness to in vivo nanofibrous nature or its molecular mechanism, leading to HSC survival, and CAMDR mechanisms similar to those seen in vivo is not shown.22 Unquestionably, the basic nature of ECM is nanofibrous and that creation of a nanofibrous matrix has potential significance in artificially recreating any aspect of the ECM.23 Thus, we revisited PLLA’s ability to yield nanofibrous structures and PU’s ability to generate micro structures using thermally induced phase separation (TIPS) technology.24–26 Unlike when generating blends, TIPS technology generated a composite with micro-nanofibrous morphology identical to that of decellularized bone marrow niche. Extensive molecular biological characterization of these scaffolds using AML KG1a cells demonstrated that the newly developed 60:40 ratio of PU/PLLA composite created a nanofibrous scaffold with higher protein adsorption and increased cell survival and drug resistance toward commonly used drugs such as cytarabine (Ara C) and daunorubicin (DNR). Importantly, we show here that the molecular mechanisms of cell survival and drug resistance observed in the scaffold were similar to those reported in vivo without altering the phenotype of the AML KG1a cells. Moreover, we show how this resistance can be altered using different drugs. The developed, molecularly characterized PU/PLLA system could serve as a drug-testing platform for different chemotherapeutics against cell adhesion-mediated drug-resistant cells for the characterization of different drugs of clinical significance.
Materials and methods
Tetrahydrofuran (THF) was obtained from Merck Millipore (Billerica, MA, USA), PU was gifted by Dr Jayabalan (Sree Chitra Tirunal Institute for Medical Sciences, Trivandrum, India), and PLLA (molecular weight ~150,000) was from Goodfellow Inc, Wrexham, UK). Fetal bovine serum (FBS), penicillin/streptomycin, and sodium dodecyl sulfate (SDS) were obtained from Thermo Fisher Scientific (Waltham, MA, USA), while FN, 3-[(3-cholamidopropyl)dimethylammonio]-1-propanesulfonate (CHAPS), bicinchoninic acid (BCA) reagent, Iscove’s Modified Dulbecco’s Medium, l-glutamine, alamarBlue®, 4′,6-diamidino-2-phenylindole (DAPI), paraformaldehyde, urea, thiourea, protease inhibitors, Bradford reagent, SDS, Tris-buffered saline and Tween® 20, NaCl, Ara C, DNR, and ABT 737 were all purchased from Sigma-Aldrich Co (St Louis, MO, USA). CD33, CD34, and CD38 antibodies were purchased from BD Biosciences (Franklin Lakes, NJ, USA). Polyvinylidene fluoride (PVDF) membrane and a chemiluminescence system (Luminata™ Forte Western HRP [horseradish peroxidase] Substrate) were obtained from Merck Millipore. Nonfat milk was from Sagar (Kaira District Co-operative Milk Producers Union Ltd, Gujarat, India), mouse p27Kip1 and Bcl2 monoclonal antibodies were both from GeneTex, Inc (Irvine, CA, USA), and mouse monoclonal β actin was from Santa Cruz Biotechnology Inc (Dallas, TX, USA). Anti-mouse HRP-conjugated secondary antibodies were from Calbiochem (San Diego, CA, USA) and Kodak XBT film was obtained from Carestream Health (Rochester, NY, USA).
Scaffold fabrication
The polymers and solvent were used as received. Scaffolds were fabricated by TIPS of polymeric solutions (5% w/v) with subsequent lyophilization.24,27 Briefly, polymer solutions containing different ratios of PU and PLLA (100:0, 80:20, 60:40, 50:50, 40:60, 20:80, and 0:100) were dissolved in THF at 60°C and phase separation was achieved by lowering the temperature to −80°C. THF was extracted from the frozen polymer solution using ice-cold distilled water by changing the water four times a day, as THF is miscible with water. After 3 days, the scaffolds were lyophilized for 24 hours to remove any other remnants of solvent and water.
Scanning electron microscopy
Morphological characterization of PU/PLLA scaffolds was performed using scanning electron microscopy (SEM; JSM-6490LA, JEOL, Tokyo, Japan). Prior to SEM analysis, samples were cut using a surgical blade and sputter coated with gold for 60 seconds using a JEOL auto fine coater (JFC-1600).
To understand the morphology of the decellularized bone marrow ECM, SEM analysis was performed. The bone marrow sample obtained from a patient (having given informed consent as required by the Amrita Institute of Medical Sciences Human Ethics Committee) was initially washed with phosphate-buffered saline (PBS) to remove the blood and subsequently treated with 70% ethanol for 15 minutes followed by dehydration using 80%, 90%, and 100% ethanol.
Fourier transform infrared spectroscopy
Fourier transform infrared (FTIR) spectroscopy measurements were carried out using a Bruker TENSOR™ 27 instrument (Bruker Corporation, Billerica, MA, USA). The samples were analyzed in absorbance mode in the range of 600 to 4,000 cm−1. The functionalities corresponding to each of the absorption bands were analyzed.
Protein adsorption on TCPSs and scaffolds
Since the bone marrow express proteins help in the adhesion of HSCs and leukemic stem cells (LSCs), it was important to coat the 3-D scaffolds with proteins. Protein adsorption was performed by incubating different blends of scaffolds overnight with 20% FBS or with 20 μg/mL FN in PBS. The scaffolds were wetted before protein coating by incubating the scaffolds in 70% ethanol for 1 minute, followed by washing with PBS three times. Subsequently, the scaffolds were incubated in a protein solution for 12 hours and washed twice with PBS by gentle agitation to remove non-adsorbed or weakly adsorbed proteins. The protein-coated scaffolds were then incubated in elution buffer (0.025% SDS and 0.0025% CHAPS) to extract the proteins adsorbed on these scaffolds. To estimate the concentration of total protein adsorbed on the scaffolds, one volume of eluted solution was incubated with eight volumes of BCA reagent for 30 minutes at 37°C. In order to estimate the FN concentration in the extract, the scaffolds were incubated with an equal volume of micro BCA reagent for 2 hours at 37°C. Optical density was recorded at 562 nm using a BioTek PowerWave™ XS plate reader (BioTek Instruments Inc, Winooski, VT, USA).28
AML cell culture
The human erythroid leukemia cell line KG1a (National Centre For Cell Science, Pune, India) was used for the studies due to its high expression of VLA 4 and its CD34+/CD38−/CD33− stem cell-like phenotype.29 The cells were cultured in standard polystyrene tissue culture flasks in Iscove’s Modified Dulbecco’s Medium supplemented with 20% FBS, 1% 200 mM l-glutamine, and 1% penicillin/streptomycin in an incubator at 37°C with an atmosphere of 5% CO2 and a seeding density of 2–4×10⁵ cells/mL. For experiments on scaffolds, the seeding density was 1.5×10⁵ cells/mL and the culture conditions were same as for the cells cultured in flasks.
Cell proliferation and viability studies
Cell proliferation of KG1a on scaffolds was assessed for 24, 72, 120, and 168 hours using alamarBlue. Scaffolds, of a typical size of 4 mm high and 15 mm in diameter (equivalent to the diameter of wells), placed within the wells of a 24-well plate, were used for cell culture. KG1a cells were seeded at a density of 1.5×10⁵ cells/mL on FN-coated well plates or scaffolds. alamarBlue (10%) was added and incubated with the cell-seeded scaffolds for 6 hours in an incubator at 37°C and 5% CO2.30 After incubation, 100 μL of solution was taken from each well and transferred into another 96-well plate for recording the optical density using the BioTek PowerWave XS plate reader at 570 nm and 600 nm.
Measurement of cell attachment and the levels of infiltration of cells into the 3-D scaffold
In order to visualize the cells that remained attached to the scaffold, we used DAPI staining. Scaffolds were seeded with 1.5×10⁵ cells/mL and incubated for 2 hours. For DAPI staining, the scaffolds seeded with cells were washed three times with PBS before and after fixing using 4% paraformaldehyde. Later, the scaffolds were incubated with DAPI (10 mg/mL) for 5 minutes and nuclei were observed under confocal microscope (TCS SP5 II, Leica Microsystems, Wetzlar, Germany). Quantification of the number of cells per unit area was the average of DAPI-stained nuclei from five different acquired images of an area of 750 μm2 for each scaffold. The number of cells was counted by dividing the area into equally sized compartments and counting the nuclei in each compartment. Subsequently, the number of nuclei in each compartment was added to get the total number of DAPI-stained nuclei for each acquired image.
Flow cytometry analysis
In order to analyze whether the cells on scaffold were maintaining the phenotype despite culturing for a week, flow cytometric analysis was performed using markers for stem cells CD33, CD34, and CD38. KG1a cells (1×10⁵ cells/mL) were seeded on FN-coated wells or the experimental scaffolds and the expression of CD33, CD34, and CD38 was analyzed at 48, 120, and 168 hours using the corresponding antibodies. After the respective incubation periods, any nonadherent cells on media were removed by washing with PBS. The cells were treated with 0.05% trypsin to detach them from the wells or the scaffold. Trypsin was neutralized with complete medium and the supernatant containing cells was centrifuged at 1,500 rpm for 5 minutes to pellet down the cells. The cell pellet was then resuspended in PBS and incubated with antibodies for 30 minutes at 37°C. In addition, isotypes were treated the same way as controls. Flow cytometry analysis was performed using a FACSAria™ II (BD Biosciences).
Cell lysate preparation and Western blotting analysis
Cell lysate
Cells at a density of 1×10⁵ were lysed at 4°C in 10 μL of lysis buffer containing 8 M urea and 2 M thiourea with a protease inhibitor cocktail. The cell lysate was further probe-sonicated for three cycles, each for 2 seconds with 3-second intervals. The lysate was later centrifuged at 12,000 rpm for 10 minutes to clear it. Later, the protein content was determined with Bradford assay. A concentration of 50 μg total protein was electrophoretically separated using 12% sodium dodecyl sulfate polyacrylamide gel electrophoresis (SDS-PAGE).
Western blotting
The SDS-PAGE-resolved proteins were transferred from the gels to the PVDF membrane.31 The membranes were blocked with 5% nonfat milk prepared in 0.1% Tris-buffered saline and Tween 20 (TBST; 50 mM Tris-HCl [pH 7.4], 150 mM NaCl, and 0.1% Tween 20) for 1 hour at room temperature. Later, the membranes were incubated with a specific primary antibody overnight at 4°C. Primary antibodies included rabbit polyclonal antibodies against p27Kip1, mouse monoclonal antibody against Bcl2, and mouse monoclonal β actin. The secondary antibodies used were purchased from Calbiochem. The monoclonal antibodies were used at 1:2,000 dilution and the polyclonal antibodies were used at 1:500 dilution. The mouse monoclonal β actin antibody was used at 1:8,000 dilution. The membranes were washed with 0.2% TBST and incubated for 1 hour with HRP-conjugated secondary antibody. The secondary mouse antibody and secondary rabbit antibody were used at 1:10,000 and 1:15,000 dilutions, respectively. After three washes with 0.2% TBST, the membranes were incubated with an enhanced chemiluminescence system according to the manufacturer’s instructions and exposed to Kodak XBT film.
Analysis of chemoresistance of cells cultured on 3-D scaffolds
To characterize further the molecular mechanisms behind the cell growth on FN-coated scaffolds and the scaffolds suitability for drug screening, two candidate chemotherapy drugs – those being, Ara C and DNR – were tested for drug efficacy in inducing cell death at a concentration of 1 μM and 500 nM, respectively, according to what was given for patients in clinic.1 Prior to adding the drugs, 1.5×10⁴ KG1a cells/well were seeded into the FN-coated wells or scaffolds and incubated for 6 hours. Later, the non-adhered cells were removed along with the medium, which was replaced with new medium with or without drugs. For the TCPS culture of KG1a cells, medium with cells was taken out, centrifuged, and, after removing the medium, the cells were re-seeded into the wells prior to adding medium with or without drugs. The removed medium was checked for the presence of cells using trypan blue assay and found to negligible. The drug replacement was repeated every 48 hours and subsequently the readings were taken.
To further analyze the role of Bcl2 specific inhibitor ABT 737 in reversing the chemoresistance observed, we tested the ability of Ara C and DNR in inducing cell death in the presence of Bcl2 specific inhibitor ABT 737, which binds to the BH3 binding groove of Bcl2. The experiments with different drugs as described were repeated with and without ABT 737. The concentration of ABT 737 used was determined in KG1a cells cultured in TCPS (Figure S1). A concentration reducing cell viability by 20% value of 312.5 nM was chosen for further drug-testing experiments, as this did not cause any significant amount of cell death.
Statistical analysis
Analysis of variance and Student’s t-test were used to perform the statistical analysis of the data. All experiments were done in triplicate. Data are represented as the mean ± standard error of three independent experiments. A P-value of less than 0.05 was considered statistically significant.
Results
Evaluation of scaffold morphology
In order to generate a scaffold with micro-nanofibrous morphology similar to that of decellularized bone marrow, we decided to exploit the properties of PU and PLLA using TIPS technology, as PLLA has been successfully used for the creation of nanofibrous morphology using TIPS technology.24,26 Unlike previous studies using PU/PLLA blends, as far as we are aware, no study has been conducted before that has analyzed a composite of PU/PLLA generated using TIPS strategy providing unique micro-nanofibrous morphology similar to decellularized bone marrow niche, as shown in this study.21 Thus, we generated different composites of PU/PLLA using TIPS. While 100% PU scaffolds exhibited a featureless film-like morphology devoid of any fibers (Figure 1A–C), 100% PLLA had a distinct, homogenous, complete nanofibrous structure (Figure 1S–U) throughout. The mixing of PU with varying concentrations of PLLA (20%, 40%, 50%, 60%, 80%, and 100%) resulted in PU/PLLA compositions of varying morphology. At ≤50% PU, the morphology of PU/PLLA composites showed nanofibrous structures with differently sized spherical structures of PU (Figure 1J–R). With the increasing concentration of PU (60% and 80%), the spherical structures got transformed into thick, fibrous structures at −80°C (Figure 1M–R). The morphology of the different composites of scaffolds was compared with an SEM image of human decellularized bone marrow extra cellular matrix (BM-ECM) (Figure 1V). Among the different composites, the PU/PLLA 60:40 scaffold showed indistinguishable similarity with the micro-nanofibrous nature of BM-ECM (Figure 1I vs V).
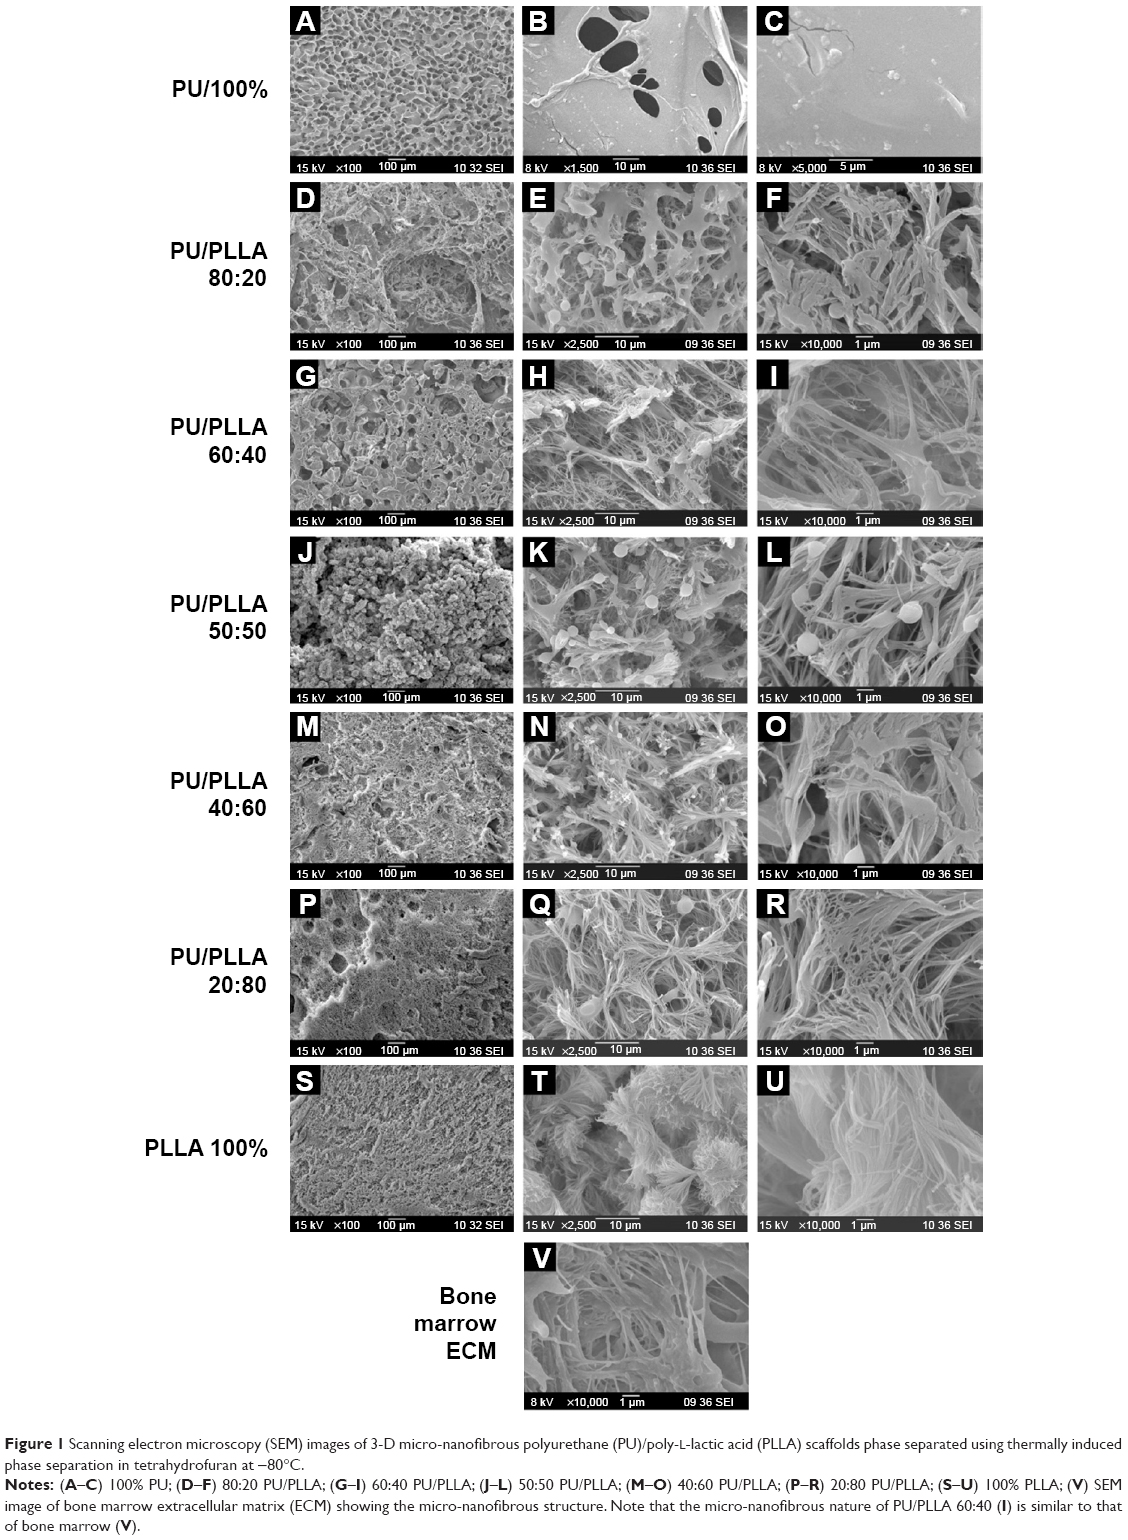 | Figure 1 Scanning electron microscopy (SEM) images of 3-D micro-nanofibrous polyurethane (PU)/poly-L-lactic acid (PLLA) scaffolds phase separated using thermally induced phase separation in tetrahydrofuran at −80°C. |
Fourier transform infrared spectroscopy
FTIR was used to study the molecular construction of the composites. As shown in Figure S2, the FTIR spectrum of phase-separated scaffold of 100% PU showed the characteristic absorption peaks of PU at 3,448 cm−1 (stretching vibration of N-H bond in the urethane segments), 2,927–2,852.76 cm−1 (C-H stretching of alkane) and1,647 cm−1.28 The FTIR spectrum of 100% PLLA nanofibrous scaffold depicted characteristic absorption bands at 2,999 cm−1 (carboxylic acid O-H stretch), and 1,769 cm−1, which represents the characteristic peaks of the ester backbone of PLLA.
The FTIR spectra of the phase-separated scaffolds of PU/PLLA blends of different ratios show a 3,500 cm−1 range band of the N-H bond stretch vibration of urethane, with reduced intensity as the PU concentration was reduced. In PU and PLLA, two bands are visible in the 2,960–2,850 cm−1 range, which represent the C-H stretching of alkane in PU and O-H stretch of PLLA, and both of the bands were seen in PU/PLLA 60:40, PU/PLLA 50:50, PU/PLLA 40:60, and also PU/PLLA 20:80.28 The characteristic peak of PLLA at 1,769 cm−1 was maintained in all the blends but as the percentage of PLLA decreased, the relative strength of the peak also decreased and the peak at 1,647 cm−1 present for PU appeared in the blends with >20% PU concentration.
Cell proliferation/viability on scaffolds
In order to test the efficacy of different PU/PLLA scaffold composites in supporting cell growth, we incubated bare scaffolds with KG1a cells. Following 48 hours’ incubation of KG1a cells in TCPSs and scaffolds, the biocompatibility of the scaffolds was assessed by alamarBlue. As shown in Figure S3, all the different scaffolds did not induce any cell death, demonstrating that they were equally cytocompatible as TCPSs and were able to support the growth of KG1a cells.
Protein adsorption on scaffolds
Based on the biocompatible nature of both PU and PLLA and the micro-nanofibrous scaffold that showed identical morphology to decellularized bone marrow (Figure 1V vs I), we tested the efficacy of PU/PLLA 60:40 toward protein adsorption.12,24 To this end, we used both total serum proteins (FBS) and purified FN as protein sources. As shown in Figure S4A, among the different PU/PLLA composites assessed for protein adsorption, PU/PLLA 60:40 showed the maximum protein adsorption with FBS.
On a similar note, we tested FN, as FN plays a major role in the development of chemoresistance in AML cells under in vivo and in vitro conditions via VLA 4–FN interactions.1,3,5 Incubation of different composites of PU/PLLA scaffolds with FN 20 μg/mL resulted in different levels of FN adsorption on scaffolds (Figure S4B), and the PU/PLLA 60:40 composite scaffold showed maximum adsorption of FN in comparison to all the other scaffolds (P≤0.05 compared to PU/PLLA 50:50; Figure S4B); a result similar to that obtained with total serum proteins of FBS (Figure S4A).
Cell proliferation on different scaffolds
As the PU/PLLA 60:40 composite showing maximum adsorption of proteins compared to other scaffolds, we tested the ability of different FN-coated composites in supporting cell proliferation for a longer period. We compared the proliferation of KG1a cells on a FN-coated tissue cell culture system (FNTCPS), uncoated scaffolds, and FN-coated scaffolds for 168 hours. The extent of cell proliferation/viability was analyzed using alamarBlue reagent.
For the initial 72 hours, the FNTCPS showed maximum cell proliferation/viability compared to the FN-coated scaffolds (Figure 2) and the closest scaffold that showed cell proliferation similar to that with the FNTCPS was the PU/PLLA 60:40 composite scaffold (0.165 in PU/PLLA 60:40 vs 0.195 in FNTCPS). However, with increasing time of the KG1a cells culturing on different scaffold composites, the FN-coated PU/PLLA 60:40 scaffolds demonstrated good proliferation/viability of cells compared to FNTCPS (P≤0.01 for FNTCPS vs PU/PLLA 60:40). Moreover, the FN-coated PU/PLLA 60:40 composite demonstrated maintenance of cells for 168 hours, as indicated by a plateau, and was found to be significantly different from other scaffold composites (Figure 2; P≤0.04 for PU/PLLA 60:40 vs PU/PLLA 40:60, PU/PLLA 60:40, and PU/PLLA 50:50. P≤0.01 for PU/PLLA 60:40 vs PU/PLLA 40:60 and PU/PLLA 60:40 vs PU/PLLA 50:50). Other composites of scaffolds (PU/PLLA 40:60 and 50:50) demonstrated significantly less proliferation/viability of cells compared to PU/PLLA 60:40 at 120 and 168 hours, with the exception of PU/PLLA 50:50 at 168 hours. Note in Figure 2 the significant deterioration in cell proliferation/viability on the FNTCPS after 72 hours.
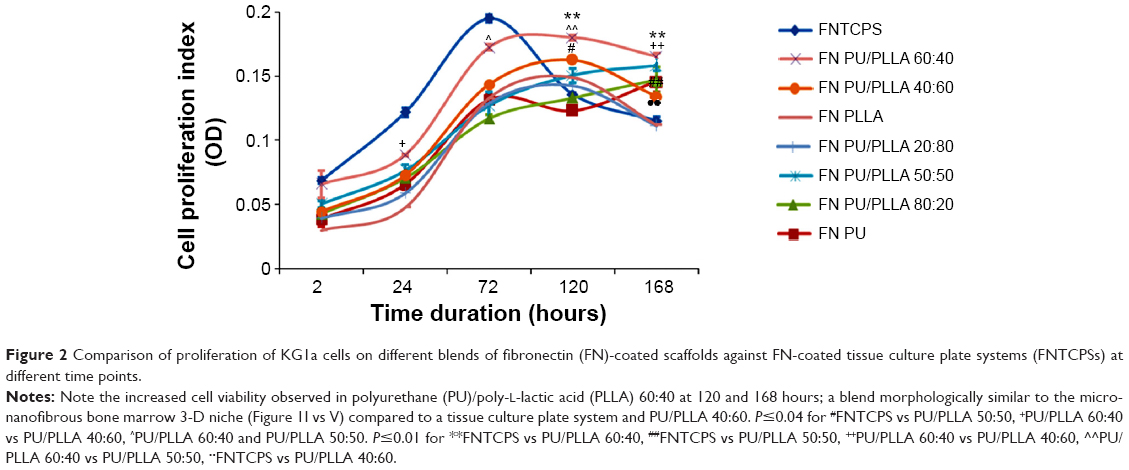 | Figure 2 Comparison of proliferation of KG1a cells on different blends of fibronectin (FN)-coated scaffolds against FN-coated tissue culture plate systems (FNTCPSs) at different time points. |
Cellular phenotype analysis
Though the FN-coated PU/PLLA 60:40 scaffolds were capable of supporting cell proliferation and survival, it is essential to maintain the original phenotype during drug testing. In order to address this issue, the expression of CD33, CD34, and CD38 in KG1a cells cultured in different conditions such as TCPSs, FNTCPSs, and FN-coated PU/PLLA 60:40 were analyzed using fluorescence-activated cell sorting at 48, 120, and 168 hours. The results show that the percentage expression of CD34+/CD33− at the time of seeding (Figure 3A) was maintained for 168 hours of culture on the scaffolds (94.6%; Figure 3A, 168 hours). On the other hand, the cells cultured on an FNTCPS showed a marginal reduction in percentage expression of these cell surface markers, particularly by 168 hours (90.8; Figure 3A). Similarly, the percentage expression of CD34+ and CD38− on the FN-coated scaffolds showed no difference following culturing on FN-coated scaffolds for 168 hours in comparison to on an FNTCPS, which showed again a reduction in CD34+/CD38− (80.9% vs 93.7%; Figure 3B, 168 hours).
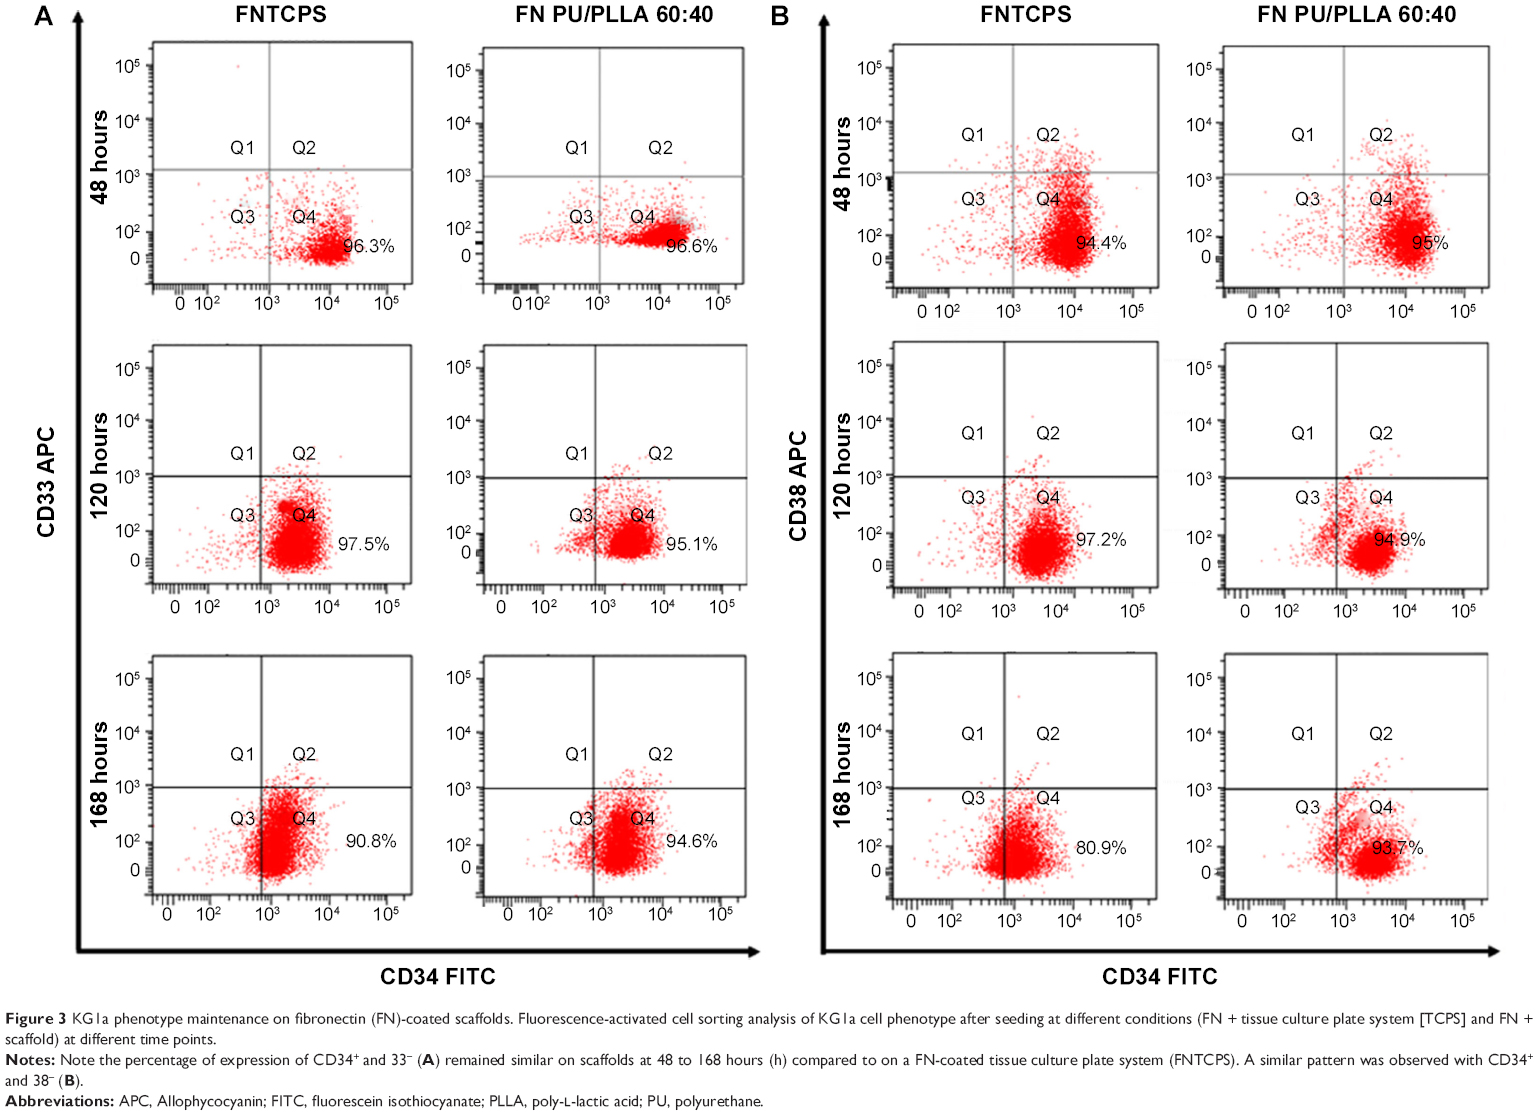 | Figure 3 KG1a phenotype maintenance on fibronectin (FN)-coated scaffolds. Fluorescence-activated cell sorting analysis of KG1a cell phenotype after seeding at different conditions (FN + tissue culture plate system [TCPS] and FN + scaffold) at different time points. |
Effect of drugs on KG1a cells using the PU/PLLA 60:40 3-D scaffolds
Following the generation of an appropriate PU/PLLA composite that supported cell proliferation and survival for a longer period without changing the cell phenotype, the stem-like KG1a cells were used for drug-testing applications. KG1a cells were treated with selected drugs or their combination, as shown in Figure 4. The percentage proliferation/viability of KG1a cells cultured on TCPSs was reduced to 81.68%±1.51%, 66.73%±2.51%, and 59.03%±5.54% following treatment with Ara C for 48, 96, and 144 hours, respectively (Figure 5A, TCPS). A similar pattern was obtained with Ara C on an FNTCPS with proliferation/viability of 83.03%±3%, 80.66%±1.64%, and 62.28%±6.39% at 48, 96, and 144 hours, respectively (Figure 5A, FNTCPS).
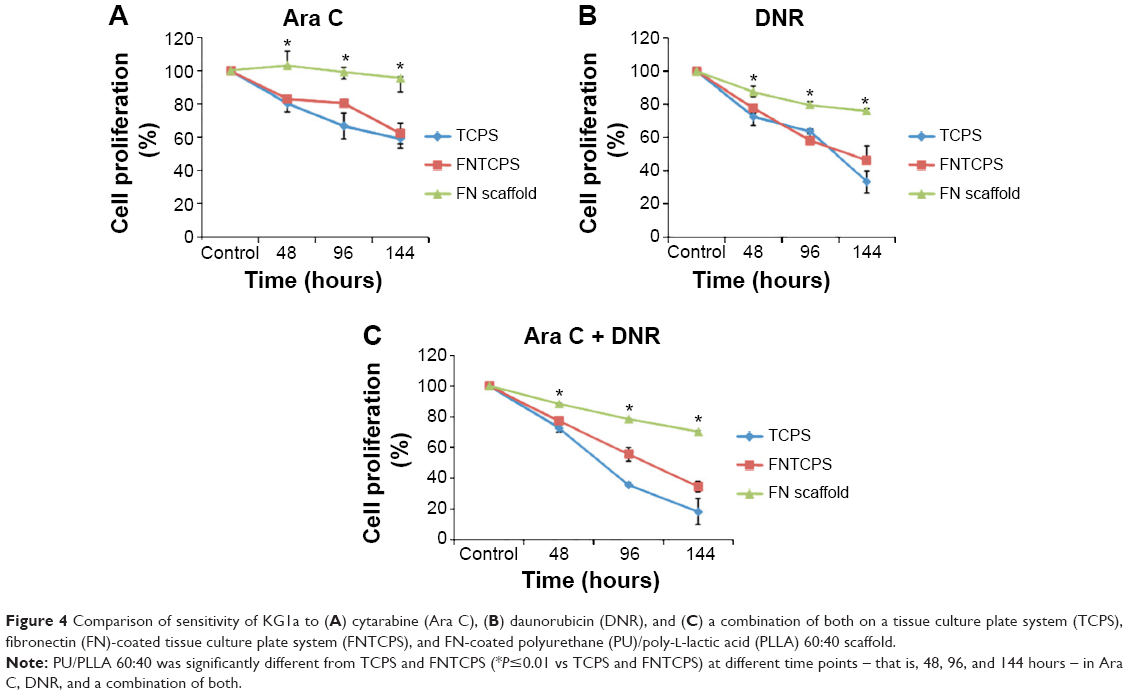 | Figure 4 Comparison of sensitivity of KG1a to (A) cytarabine (Ara C), (B) daunorubicin (DNR), and (C) a combination of both on a tissue culture plate system (TCPS), fibronectin (FN)-coated tissue culture plate system (FNTCPS), and FN-coated polyurethane (PU)/poly-L-lactic acid (PLLA) 60:40 scaffold. |
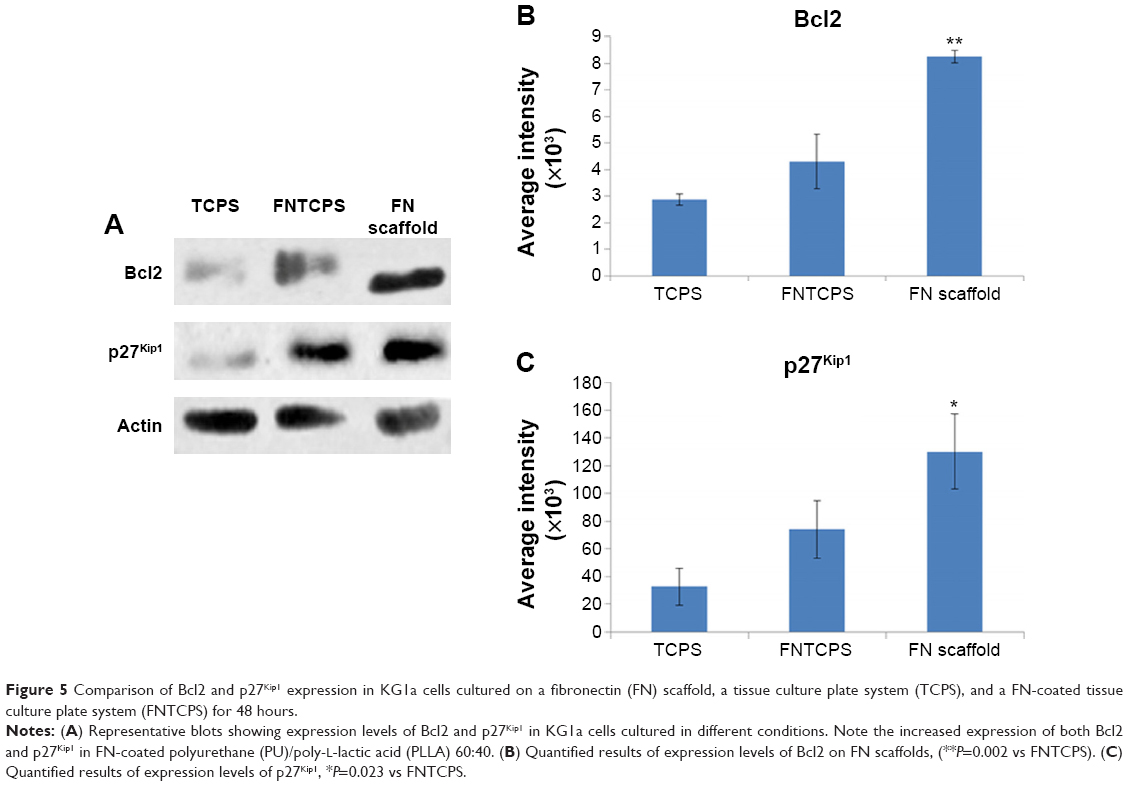 | Figure 5 Comparison of Bcl2 and p27Kip1 expression in KG1a cells cultured on a fibronectin (FN) scaffold, a tissue culture plate system (TCPS), and a FN-coated tissue culture plate system (FNTCPS) for 48 hours. |
On the other hand, cells cultured on FN-coated PU/PLLA 60:40 scaffolds, when treated with Ara C, showed no cell death compared to the control for the whole culture period (Figure 4A, FN scaffold). Interestingly, DNR singly or in combination with Ara C showed almost 80% and 70% KG1a cell death when cultured on FN-coated PU/PLLA 60:40 scaffolds (Figure 4, FN scaffold). Notably, a significant loss of cell proliferation/viability of KG1a cells was seen in both TCPS (35.40%±6.6%) and FNTCPS (43.70%±8.51%) cultures in the presence of DNR when compared to FN-coated PU/PLLA 60:40 scaffolds (76.15%±1.40%) when cultured for 144 hours (Figure 4B, P≤0.01 vs TCPS and FNTCPS). The combination of both drugs also followed the same trend in TCPS (18.35%±8.51%) and FNTCPS cultures (34.40%±3.53%) in comparison to 70.21%±1.01% proliferation/viability on the FN-coated PU/PLLA 60:40 scaffolds after 144 hours ( Figure 4C). In general, when we compared drug efficacy singly or in combination with KG1a cells under three conditions, the cells remained drug resistant for a longer period (up to 144 hours) only on the FN-coated PU/PLLA 60:40 3-D scaffolds and not under any other culture conditions.
Cell survival mechanism in FN-coated PU/PLLA 60:40 scaffolds mediated by overexpression of Bcl2 and p27Kip1
Having shown drug resistance using FN-coated PU/PLLA 60:40 scaffolds, the challenge was to decipher what mechanism gives the cells chemoresistance. It has been shown that one of the ways by which Bcl2 controls the cell cycle is by the upregulation of p27Kip1, a cell cycle inhibitor.32 Thus, we checked whether such mechanisms were at play in our system, leading to the observed chemoresistance with Ara C and DNR. As shown in Figure 5, among the three different culture conditions using KG1a cells cultured for 48 hours, the levels of both Bcl2 and p27Kip1 were highly elevated on the FN-coated PU/PLLA 60:40 scaffolds compared to in the TCPSs or FNTCPSs.
Since we observed the upregulation of Bcl2 and p27Kip1, we analyzed whether Bcl2 inhibition would reverse the drug resistance. Here, we used Bcl2-specific inhibitor ABT 737. As shown in Figure 6, in the presence of ABT 737 alone, the KG1a cells underwent minimal cell death and more than 90% of cells survived, even at 144 hours in culture (Figure 6A). On the contrary, the addition of Ara C and DNR singly or in combination, along with ABT 737, induced significant cell death (Figure 6B–D). Notably, by 144 hours, almost all the cells had been wiped out, in contrast to with ABT 737 alone (Figure 6B–D vs A).
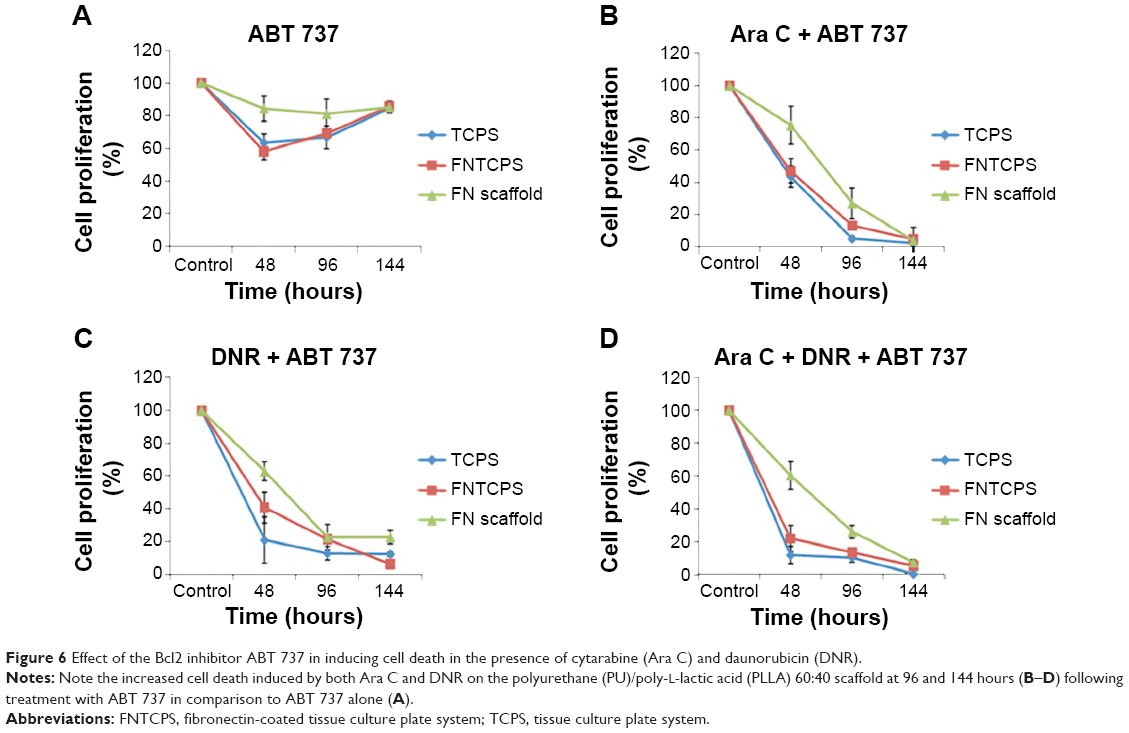 | Figure 6 Effect of the Bcl2 inhibitor ABT 737 in inducing cell death in the presence of cytarabine (Ara C) and daunorubicin (DNR). |
Quantification of AML cell adhesion and levels of infiltration of cells into 3-D scaffolds
One of the fundamental aspects related to the survival of LSCs in the 3-D bone marrow niche is their ability to remain drug resistant by being quiescent in the niche following attachment to FN.1,5,32 Thus, whether such migration and lodging of cells into the depth of scaffold in our developed scaffold composites needed testing. Therefore, to prove that the cells had migrated into the scaffolds, cell adhesion and migration to different depths of the FN-coated polymeric scaffolds was analyzed using DAPI staining using confocal microscopy, as described in “Materials and methods”. As shown in Figure S5 (composite images), and in the images of 10 μm slices of up to a depth of 100 μm of the scaffolds in Figure S6, the FN-coated PU/PLLA 60:40 scaffolds (Figure S5Ac) harbored the maximum number of cells compared to the other scaffolds, as demonstrated by the increased number of DAPI-stained nuclei at different depths of the scaffold (Figure S5A). Quantitative measurement of cells from different confocal slices (Figure S5B) put together shows significantly high numbers of cells in the PU/PLLA 60:40 scaffolds.
Discussion
Drug testing to resolve the efficacy of drugs against specific cells demands an environment closer to the in vivo system where those cells reside. Despite many attempts toward the recreation of an in vivo environment closer to the bone marrow niche in vitro, the success rate has been poor.4,12,32–35 Since the bone marrow niche is a hideout for LSCs, it is pertinent to generate a 3-D environment for drug testing and perhaps ex vivo production of blood cells.5–12 Although there have been attempts toward the fabrication of scaffolds that resemble the bone marrow niche with better cell adhesion and proliferation compared to 2-D matrices, the development of a micro-nanofibrous environment close to the bone marrow niche, without any added stromal cells, showing similar in vivo molecular characteristics to CAMDR has not yet been shown, as far as we are aware.4,12,17,35 Thus, the fabrication of a micro-nanofibrous structure close to the bone marrow niche, as shown in Figure 1V, was envisaged using suitable composites of polymers and TIPS technology for scaffold preparation.
In order to create a micro-nanofibrous structure, we searched for materials that support leukemic/hematopoietic cell growth. In this respect, PU has been shown to support leukemic/hematopoietic cell growth and PLLA to generate excellent nano-textured surfaces.12,24 Thus, different combinations of PU/PLLA were generated for the first time, as far as we are aware, using the technique of TIPS.24,36–39 As shown in Figure 1, scaffolds of varying kinds of micro-nanofibrous structures were generated using different composites of PU/PLLA. These structures could be the result of phase separation due to differences in crystallinity and solubility of the polymers between the polymer blend and THF. As is evident from the SEM images, scaffolds of varying morphology, ranging from those containing completely nanofibrous structures of PLLA (Figure 1S–U) to scaffolds with featureless, film-like morphology devoid of any fibers (Figure 1A–C) of PU were developed by the technique of TIPS (Figure 1A–T). Appropriate composites of the two polymers yielded partially nanofibrous scaffolds (Figure 1D–R). Neither PU nor PLLA alone yielded morphology similar to that of bone marrow ECM (Figure 1V and W). Among these different composites, the PU/PLLA ratio of 60:40 yielded the closest morphology to the in vivo bone marrow niche when compared with an SEM image of decellularized bone marrow niche (Figure 1I vs V), suggesting that the PU/PLLA 60:40 combination may be the best choice from among the different PU/PLLA blends.
The PU/PLLA composites retained the major bands of pure polymers, with the two bands which were visible in the 2,960–2,850 cm−1 range representing the C-H stretching of alkane in PU and O-H stretching of PLLA (Figure S2) that became three bands in PU/PLLA 60:40, PU/PLLA 50:50, PU/PLLA 40:60, and also in PU/PLLA 20:80. This could be due to hydrogen bonding that occurred during the blending of the two polymers. Still, no significant shifting or broadening of the bands was observed, which could be due to the relatively low concentration of intermolecular hydrogen bonds between the two polymers.28
Biological use of the developed polymeric scaffolds demands the matrix be cell-friendly. AML stem cell-like KG1a cells were selected for characterizing our scaffolds for its various cellular interaction properties, because CAMDR stem cells harbor in the bone marrow niche leading to AML relapse. All the scaffolds performed equally well in supporting cell growth in comparison to the cell growth seen in the control TCPS (Figure S3), indicating the nontoxic nature of the biodegradable scaffolds. However, there was no cell attachment on any of the scaffolds (data not shown). In order to study CAMDR, it was necessary to coat the scaffolds with proteins of choice. Adsorption with serum proteins as well as FN separately showed a similar pattern, with maximum protein adsorption seen on the PU/PLLA 60:40 composite (Figure S4A and B), suggesting the ability of PU/PLLA 60:40 in adsorbing maximum amounts of protein, irrespective of the protein used. It is likely that for the same reason the PU/PLLA 60:40 scaffold showed exceptional resemblance to the in vivo micro-nanofibrous decellularized bone marrow niche (Figure 1I vs V), perhaps helping in the maximum adsorption of the secreted FN. None of the other scaffold composites (Figure 1A–H and J–V) showed such similarity with the decellularized bone marrow niche (Figure 1V). The increased adsorption of proteins on PU/PLLA 60:40 composite is highly relevant, because, in vivo, the secreted FN has to adhere and remain in the niche for CAMDR.1,12 Therefore, the development of a scaffold that has high protein adsorption and cytocompatiblity is critical. Indeed, many reports indicate that nanofibrous scaffolds have better protein adsorbtion than flat surfaces.28,40,41
Since PU/PLLA 60:40 showed the maximum FN protein adsorption, we analyzed whether FN coating would support KG1a cell proliferation/survival. Analysis of cell proliferation/viability measured at different time points indicated that the FN-coated micro-nanofibrous scaffold supported significant KG1a cell proliferation/viability when cultured for a longer period such as 120 or 168 hours (Figure 2) in comparison to uncoated scaffolds, FNTCPSs, and FN-coated different blends of scaffold. Though the proliferation of cells for 24 and 72 hours on FNTCPSs was initially higher than that on FN-coated scaffolds, by 120 and 168 hours, the FNTCPSs showed a significant reduction in cell proliferation (Figure 2). The lag in cell proliferation on scaffolds initially compared to that in TCPSs could be attributed to the limited number of cells bound to the surface and the niche of the scaffold at the time of seeding (we seeded 1.5×10³ cells per well on scaffold that was placed in the well) and that, with longer time in culture, these cells divide and migrate more into the scaffold niche and get adapted to the newly introduced niche conditions. On the other hand, this scenario was lacking in the 2-D FNTCPSs, in that, by 120 and 168 hours in culture, the cell proliferation/viability was significantly reduced (Figure 2). The increased cell division could be due to less surface area available for FN adsorption, resulting in less area for cell attachment, thereby decreasing the number of cells remaining quiescent and then those non-adhered cells divide actively, overpopulate, and die. This observation indicates that for long-term culture of AML cells, FN-coated scaffolds are better suited than normal FNTCPSs, as shown by different studies.12,42 Notably, following 72 hours of culture on FN-coated scaffolds, the cell proliferation/viability remained at a plateau on the PU/PLLA 60:40 scaffolds until the 168th hour analyzed, indicating that the cells were not proliferating and might be arrested from entering the cell cycle (Figure 2). This made us question whether the prolonged survival of KG1a cells observed as a plateau was due to a change in phenotype of the KG1a cells. This is because KG1a cells possess the CD34+/CD38−/CD33− phenotype similar to that of LSCs with a hierarchy in differentiation and the cells have the ability to differentiate into a CD38+ phenotype under in vitro conditions.40 Despite culturing KG1a cells for a period of 168 hours, the original phenotype of KG1a cells (CD34+ CD38− CD33−) was retained on the newly engineered FN-coated PU/PLLA 60:40 scaffolds (94.6% and 93.7% at 168 hours, compared to 48 hours on the same scaffold, Figure 3A and B). Notably, the percentage of CD34+/CD38−/CD33− KG1a cells was decreased in FNTCPSs (90.8% and 80.9% at 168 hours compared to 48 hours on the same scaffold, Figure 3A and B). These results strongly suggest that PU/PLLA 60:40 scaffolds not only have the ability to support cell survival and growth for a longer period but also do not change the phenotype, a characteristic important in studies pertaining to LSCs and HSCs. This property of PU/PLLA 60:40 scaffolds may be due to an identical morphology similar to bone marrow ECM (Figure 1I vs V) as well as maintenance of biochemical parameters that helps the survival of cells on the PU/PLLA 60:40 blend for a longer period. It has been reported that p27Kip1 participates in the cell survival of multiple myeloma cells via adhesion of cells to FN and the increased expression of p27Kip1 keeps the cells in the quiescent state of G0.27,32 Most importantly, the anti-apoptotic molecule Bcl2 plays an important role in the CAMDR-related pathway leading to cell survival.1,29 In support, studies on fibroblasts have shown that an increase in Bcl2 expression resulted in a concomitant increase in the expression of p27Kip1 which later resulted in cell cycle delay and even block.27 Thus, we analyzed the levels of Bcl2 and p27Kip1 in the three culture conditions. The expression levels of Bcl2 and p27Kip1 in cells cultured on the FN-coated scaffold PU/PLLA 60:40 composite were found to be significantly higher than those of cells cultured in FNTCPSs (Figure 5) suggesting that the increased expression of Bcl2 and p27Kip1 in the cells cultured on FN-coated scaffolds could be the possible reason behind the increased cell survival seen in this system when compared to the other two systems (ie, FNTCPS and TCPS).
Based on these observations, we further explored the ability of Ara C and DNR in inducing cell death, as these drugs interfere with the S-phase of DNA synthesis. Indeed, the treatment of KG1a cells cultured on FN-coated PU/PLLA 60:40 scaffolds with Ara C or DNR or their combination until the 144th hour demonstrated low sensitivity compared to the significantly reduced viability of KG1a cells cultured in TCPSs and FNTCPSs (Figures 4 and 7). This result is in support of the increased Bcl2-p27Kip1-mediated mechanism leading to arrest of the cell cycle shown by us (Figures 5 and 7) and reported by Vairo et al.43 Moreover, AML cells, while in the bone marrow, secrete survival factors such as interleukin (IL)-3, IL-6, and stromal cell factor (SCF), and elevated levels of IL-3 and IL-6 have been shown to increase Bcl2 levels.43,44 Thus, we hypothesize that the AML cells while in the bone marrow niche as a result of cell adhesion with FN supported by the secreted IL-3, IL-6, and SCF together could increase Bcl2 expression which in turn increases p27Kip1 expression (Figure 5) in the AML cells harboring in the 3-D niche of the scaffold.
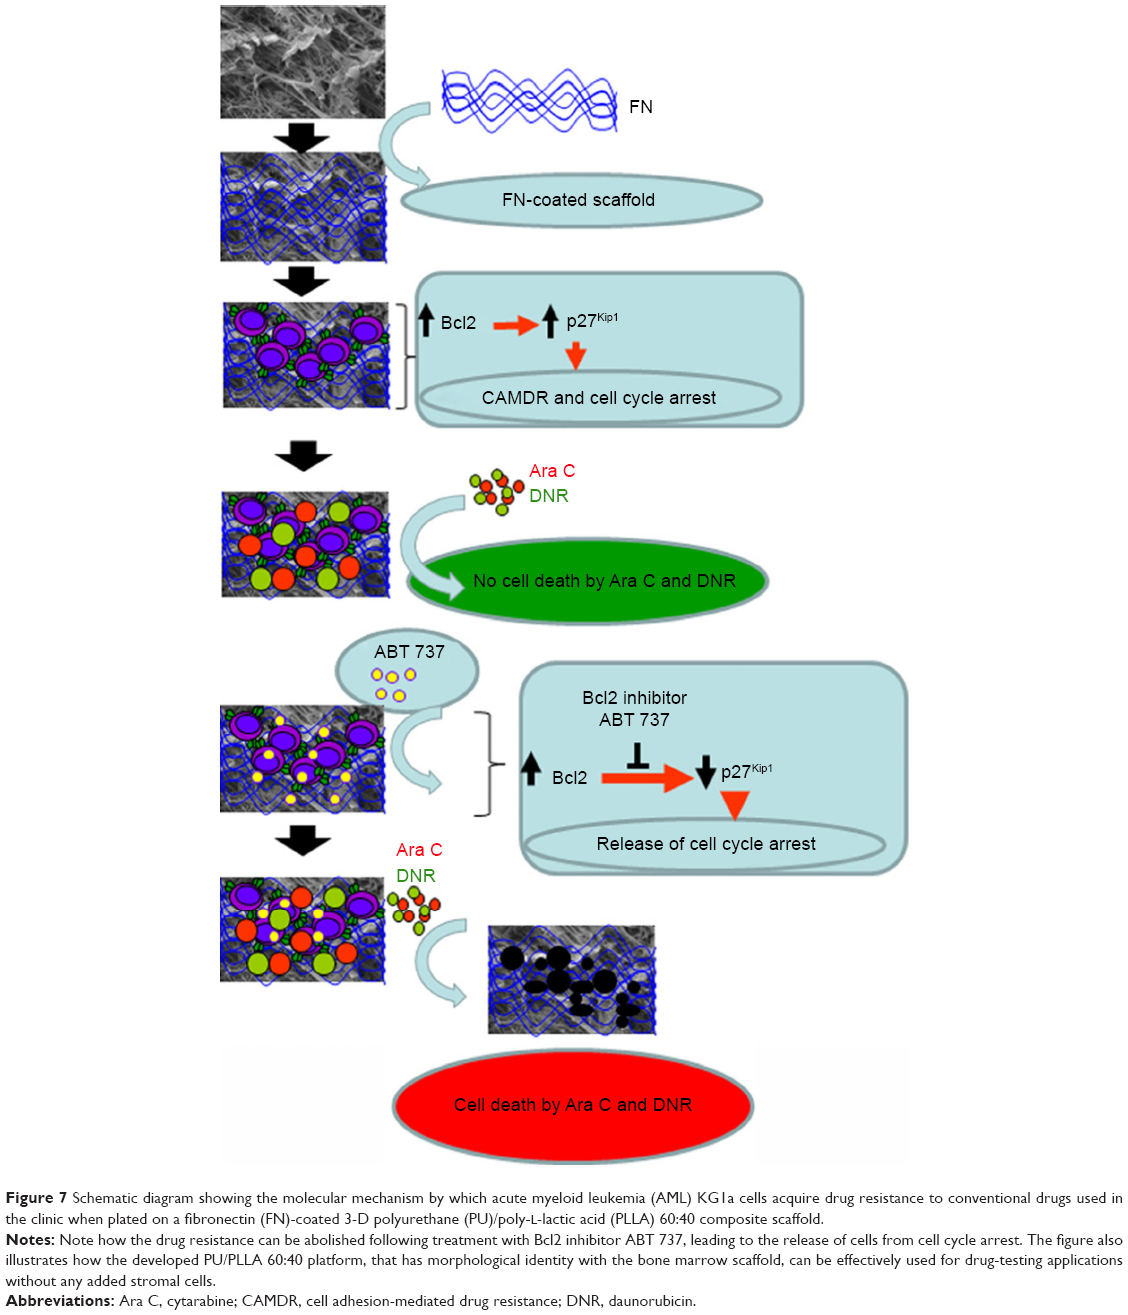 | Figure 7 Schematic diagram showing the molecular mechanism by which acute myeloid leukemia (AML) KG1a cells acquire drug resistance to conventional drugs used in the clinic when plated on a fibronectin (FN)-coated 3-D polyurethane (PU)/poly-L-lactic acid (PLLA) 60:40 composite scaffold. |
To confirm further whether the Bcl2-p27Kip1-mediated mechanism was operating in our FN-coated PU/PLLA 60:40 scaffolds, we decided to inhibit Bcl2, as Bcl2 inhibition could result in decreased p27Kip1 levels leading to release of the cells from the block held by p27Kip1, making the cells commit to S-phase, thereby allowing Ara C and DNR to have their effect. Thus, we again cultured KG1a cells under the three different conditions of TCPS, FNTCPS, and FN-coated PU/PLLA 60:40 scaffold in the presence of Bcl2-specific inhibitor ABT 737. As shown in Figures 6 and 7, in the presence of Bcl2 inhibitor ABT 737, significant cell death was noticed on the FN-coated PU/PLLA 60:40 scaffolds at IC20 value of 312.5 nM (Figure S1). This observation validates the mentioned hypothesis that p27Kip1 levels could have been reduced and the cells were released from the quiescent stage. As the cells move into the S-phase, the drugs AraC and DNR interferes with the DNA synthesis leading to cell death. Indeed, in the presence of ABT 737, low levels of p27Kip1 have been observed (data not shown). These results together indicate that the developed FN-coated PU/PLLA 60:40 3-D system supports drug resistance to Ara C, DNR, or both and operates through the Bcl2-mediated p27Kip1 mechanism, recapitulating at least in part the drug resistance seen in the in vivo condition.1,11,44 It is well-known that the bone marrow 3-D niche aspirated from patients contains the IL-3, IL-6, and SCF secreted by AML cells and that these factors have been shown to upregulate Bcl2.44,45 Thus 3-D architecture is also important in providing the resistance. In fact, we verified the ability of KG1a cells to penetrate the PU/PLLA 60:40 scaffolds using confocal microscopy. Our results demonstrate that, as shown in Figure S5, there was considerable penetrance of these cells to different depths of the scaffolds (measured up to a scaffold depth of 100 μm, as shown in 10 μm confocal slices [Figure S6]), suggesting that the niche environment was supporting the survival of these cells. This could be attributed to the observed morphological identity of the PU/PLLA 60:40 scaffolds to decellularized bone marrow and the increased FN adsorption, as FN helps in promoting CAMDR via VLA 4.1,11
Further studies are essential for a deep insight into the intricate biochemical mechanisms behind the drugs resistance in the 3-D environment. A major observation in this study was that even in the absence of any stromal cells, as seen in vivo, we could show similar biochemical mechanisms operating in the FN-coated PU/PLLA 60:40 scaffolds.
Conclusion
In this study, we developed a new PU/PLLA 60:40 biocompatible scaffold composite that is morphologically identical to bone marrow niche and capable of supporting the growth and survival of a stem-like population of KG1a cells for longer period without changing the phenotype. We have also shown that, as seen in vivo, the biochemical mechanisms of cell survival observed, even in the presence of commonly used drugs such as Ara C and DNR, are via the Bcl2–p27Kip1 pathway of cell cycle control resulting in cell survival (Figures 5 and 6) even in the absence of stromal cells. This mechanism helps in significant resistance to commonly used drugs for hematological malignancies such as Ara C and DNR. Moreover, apart from the essential nature of FN for the adhesion of cells, the study clearly demonstrates the importance of a 3-D-like microenvironment in supporting the LSCs’ survival and growth for longer period without changing the phenotype, a characteristic important in studies pertaining to drug testing using LSCs. We suggest that the re-creation of a bone marrow niche-like environment with the capability of culturing leukemic cells for a longer period will be useful to assay the effect of various drugs on LSCs under “niche-like” condition and has immense potential in drug screening.
Acknowledgments
This research work was financially supported by the Centre for Nanotechnology (implants, tissue engineering, stem cell research) grant from the Department of Science and Technology and Indian Council of Medical Research, Government of India. The student scholarship to the first author was from University Grants Commission (20-6/2008[ii]EU-IV). We are grateful to Amrita Vishwa Vidyapeetham (Deemed University) for providing all infrastructural support for the research work.
Disclosure
The authors confirm that they have no conflicts of interest in this work.
References
Matsunaga T, Takemoto N, Sato T, et al. Interaction between leukemic-cell VLA-4 and stromal fibronectin is a decisive factor for minimal residual disease of acute myelogenous leukemia. Nat Med. 2003;9(5):1158–1165. | ||
Baer MR, Bloomfield CD. Multidrug resistance in acute myeloid leukemia. J Natl Cancer Inst. 1991;83(10):663–665. | ||
Mony U, Jawad M, Seedhouse C, Russell N, Pallis M. Resistance to FLT3 inhibition in an in vitro model of primary AML cells with a stem cell phenotype in a defined microenvironment. Leukemia. 2006;22(7):1395–1401. | ||
Panoskaltsis N, Mantalaris A, Wu JH. Engineering a mimicry of bone marrow tissue ex vivo. J Biosci Bioeng. 2005;100(1):28–35. | ||
Becker PS. Dependence of acute myeloid leukemia on adhesion within the bone marrow microenvironment. Scientific World Journal. 2012;2012:856467. | ||
Meads MB, Hazlehurst LA, Dalton WS. The bone marrow microenvironment as a tumor sanctuary and contributor to drug resistance. Clin Cancer Res. 2008;14(9):2519–2526. | ||
Li ZW, Dalton WS. Tumor microenvironment and drug resistance in hematologic malignancies. Blood Rev. 2006;20(6):333–342. | ||
Ishikawa F, Yoshida S, Saito Y, et al. Chemotherapy-resistant human AML stem cells home to and engraft within the bone-marrow endosteal region. Nat Biotechnol. 2007;25(11):1315–1321. | ||
Lane SW, Scadden DT, Gilliland DG. The leukemic stem cell niche: current concepts and therapeutic opportunities. Blood. 2009;114(6):1150–1157. | ||
Bissell MJ, Labarge MA. Context, tissue plasticity, and cancer: are tumor stem cells also regulated by the microenvironment? Cancer Cell. 2005;7(1):17–23. | ||
Matsunaga T, Fukai F, Miura S, et al. Combination therapy of an anticancer drug with the FNIII14 peptide of fibronectin effectively overcomes cell adhesion-mediated drug resistance of acute myelogenous leukemia. Leukemia. 2008;22(2):353–360. | ||
Blanco TM, Mantalaris A, Bismarck A, Panoskaltsis N. The development of a three-dimensional scaffold for ex vivo biomimicry of human acute myeloid leukemia. Biomaterials. 2010;31(8):2243–2251. | ||
Kunz-Schughart LA, Freyer JP, Hofstaedter F, Ebner R. The use of 3-D cultures for high-throughput screening: the multicellular spheroid model. J Biomol Screen. 2004;9(4):273–275. | ||
Sison EA, Brown P. The bone marrow microenvironment and leukemia: biology and therapeutic targeting. Expert Rev Hematol. 2011;4(3):271–283. | ||
Konopleva MY, Jordan CT. Leukemia stem cells and microenvironment: biology and therapeutic targeting. J Clin Oncol. 2011;29(5):1–9. | ||
Smalley KS, Lioni M, Herlyn M. Life isn’t flat: taking cancer biology to the next dimension. In Vitro Cell Dev Biol Anim. 2006;42(8–9):242–247. | ||
Cheng K, Lai Y, Kisaalita WS. Three-dimensional polymer scaffolds for high throughput cell-based assay systems. Biomaterials. 2008;29(18):2802–2812. | ||
Miyoshi H, Murao M, Ohshima N, Tun T. Three-dimensional culture of mouse bone marrow cells within a porous polymer scaffold: effects of oxygen concentration and stromal layer on expansion of haematopoietic progenitor cells. J Tissue Eng Regen Med. 2011;5(2):112–118. | ||
Aljitawi OS, Li D, Xiao Y, et al. A novel three-dimensional stromal-based model for in vitro chemotherapy sensitivity testing of leukemia cells. Leuk Lymphoma. 2014;55(2):378–381. | ||
Han JJ, Huang HX. Preparation and characterization of biodegradable polylactide/thermoplastic polyurethane elastomer blends. J Appl Polym Sci. 2011;120(6):3217–3223. | ||
Feng F, Ye L. Morphologies and mechanical properties of polylactide/thermoplastic polyurethane elastomer blends. J Appl Polym Sci. 2011;119(5):2778–2783. | ||
Rowlands AS, Lim SA, Martin D, Cooper-White JJ. Polyurethane/poly(lactic-co-glycolic) acid composite scaffolds fabricated by thermally induced phase separation. Biomaterials. 2007;28(12):2109–2121 | ||
Dvir T, Timko BP, Kohane DS, Langer R. Nanotechnological strategies for engineering complex tissues. Nat Nanotechnol. 2011;6(1):13–22. | ||
Wei G, Ma PX. Partially nanofibrous architecture of 3D tissue engineering scaffolds. Biomaterials. 2009;30(32):6426–6434. | ||
Carfí-Pavia F, Turturici G, Geraci F, et al. Porous poly(l-lactic acid) scaffolds are optimal substrates for internal colonization by A6 mesoangioblasts and immunocytochemical analyses. J Biosci. 2009;34(6):873–879. | ||
Hu J, Liu X, Ma PX. Induction of osteoblast differentiation phenotype on poly(l-lactic acid) nanofibrous matrix. Biomaterials. 2008;29(28):3815–3821. | ||
Tao M, Li B, Nayini J, et al. SCF, IL-1beta, IL-1ra and GM-CSF in the bone marrow and serum of normal individuals and of AML and CML patients. Cytokine. 2000;12(6):699–707. | ||
Mi HY, Salick MR, Jing X, et al. Characterization of thermoplastic polyurethane/polylactic acid (TPU/PLA) tissue engineering scaffolds fabricated by microcellular injection molding. Mater Sci Eng C Mater Biol Appl. 2013;33(8):4767–4776. | ||
She M, Niu X, Chen X, et al. Resistance of leukemic stem-like cells in AML cell line KG1a to natural killer cell-mediated cytotoxicity. Cancer Lett. 2012;318(2):173–179. | ||
Perumcherry SR, Chennazhi KP, Nair SV, Menon D, Afeesh R. A novel method for the fabrication of fibrin-based electrospun nanofibrous scaffold for tissue-engineering applications. Tissue Eng Part C Methods. 2011;17(11):1121–1130. | ||
Menon K, Rasband MN, Taylor CM, Brophy P, Bansal R, Pfeiffer SE. The myelin-axolemmal complex: biochemical dissection and the role of galactosphingolipids. J Neurochem. 2003;87(4):995–999. | ||
Hazlehurst LA, Damiano JS, Buyuksal I, Pledger WJ, Dalton WS. Adhesion to fibronectin via beta1 integrins regulates p27kip1 levels and contributes to cell adhesion mediated drug resistance (CAM-DR). Oncogene. 2000;19(38):4319–4327. | ||
Dainiak MB, Savina IN, Musolino I, Kumar A, Mattiasson B, Galaev IG. Biomimetic macroporous hydrogel scaffolds in a high-throughput screening format for cell-based assays. Biotechnol Prog. 2008;24(6):1373–1383. | ||
Mantalaris A, Keng P, Bourne P, Chang AY, Wu JH. Engineering a human bone marrow model: a case study on ex vivo erythropoiesis. Biotechnol Prog. 1998;14(1):126–133. | ||
Mantalaris A, Bourne P, Wu JH. Production of human osteoclasts in a three-dimensional bone marrow culture system. Biochem Eng J. 2004; 20(2–3):189–196. | ||
Ma PX. Biomimetic materials for tissue engineering. Adv Drug Deliv Rev. 2008;60(2):184–198. | ||
Wei G, Ma PX. Nanostructured biomaterials for regeneration. Adv Funct Mater. 2008;18(22):3566–3572. | ||
Beachley V, Wen X. Polymer nanofibrous structures: Fabrication, biofunctionalization, and cell interactions. Prog Polym Sci. 2010;35(7): 868–892. | ||
Baker BM, Handorf AM, Ionescu LC, Li WJ, Mauck RL. New directions in nanofibrous scaffolds for soft tissue engineering and regeneration. Expert Rev Med Devices. 2009;6(5):515–532. | ||
Ekblad T, Liedberg B. Protein adsorption and surface patterning. Curr Opin Colloid Interface Sci. 2010;15(6)499–509. | ||
Dellatore SM, Garcia AS, Miller WM. Mimicking stem cell niches to increase stem cell expansion. Curr Opin Biotechnol. 2008;19(5):534–540. | ||
Feng Q, Chai C, Jiang XS, Leong KW, Mao HQ. Expansion of engrafting human hematopoietic stem/progenitor cells in three-dimensional scaffolds with surface-immobilized fibronectin. J Biomed Mater Res A. 2006;78(4):781–791. | ||
Vairo G, Soos TJ, Upton TM, et al. Bcl-2 retards cell cycle entry through p27(Kip1), pRB relative p130, and altered E2F regulation. Mol Cell Biol. 2000;20(13):4745–4753. | ||
Sepúlveda P, Encabo A, Carbonell-Uberos F, Miñana MD. BCL-2 expression is mainly regulated by JAK/STAT3 pathway in human CD34+ hematopoietic cells. Cell Death Differ. 2007;14(2):378–380. |
Supplementary materials
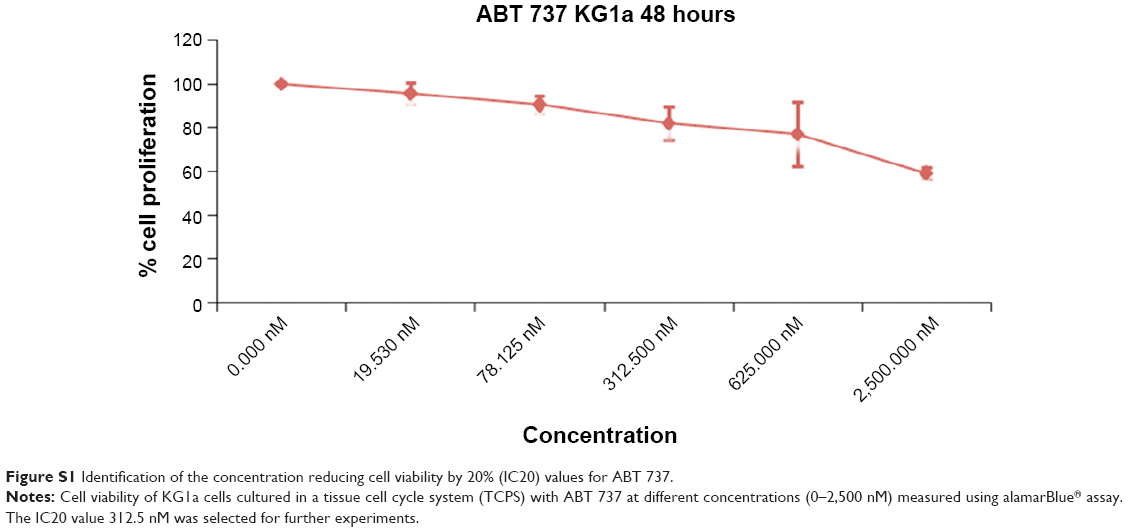 | Figure S1 Identification of the concentration reducing cell viability by 20% (IC20) values for ABT 737. |
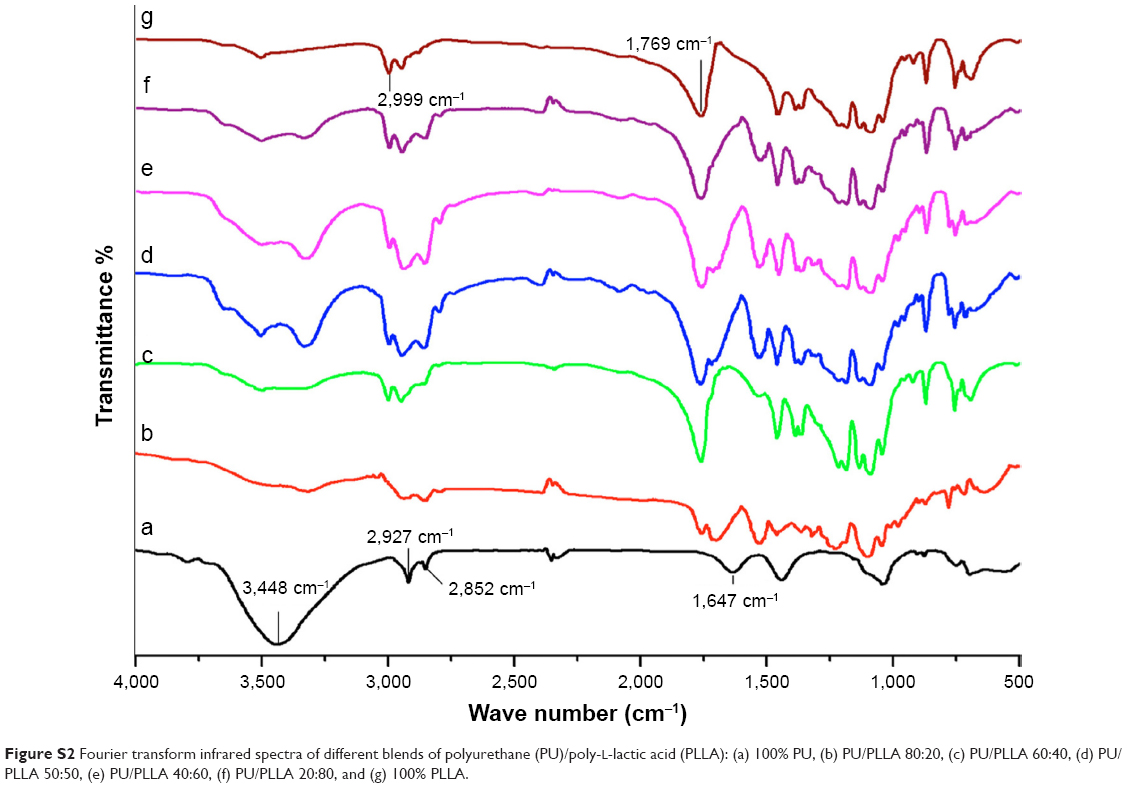 | Figure S2 Fourier transform infrared spectra of different blends of polyurethane (PU)/poly-l-lactic acid (PLLA): (a) 100% PU, (b) PU/PLLA 80:20, (c) PU/PLLA 60:40, (d) PU/PLLA 50:50, (e) PU/PLLA 40:60, (f) PU/PLLA 20:80, and (g) 100% PLLA. |
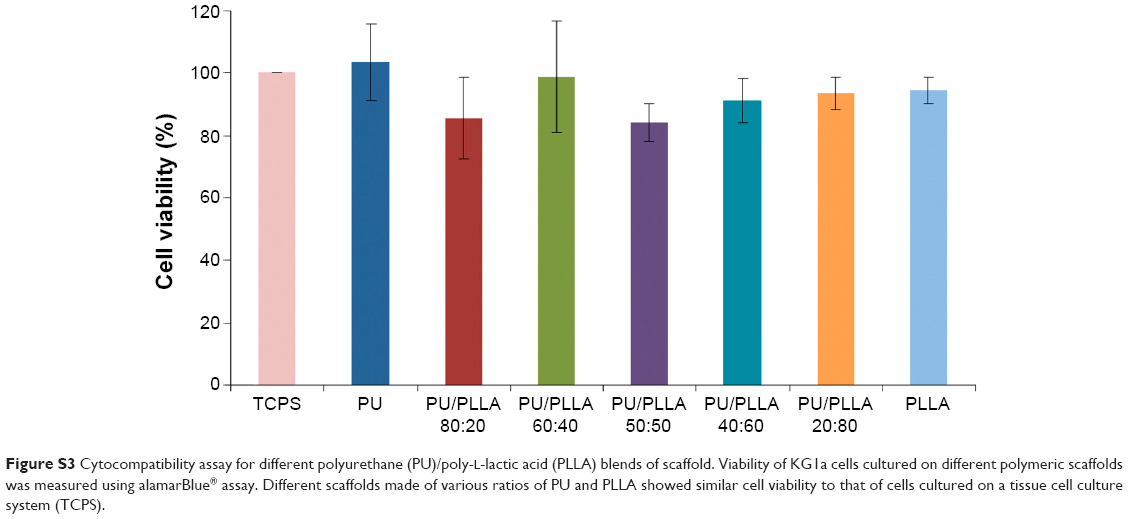 | Figure S3 Cytocompatibility assay for different polyurethane (PU)/poly-l-lactic acid (PLLA) blends of scaffold. Viability of KG1a cells cultured on different polymeric scaffolds was measured using alamarBlue® assay. Different scaffolds made of various ratios of PU and PLLA showed similar cell viability to that of cells cultured on a tissue cell culture system (TCPS). |
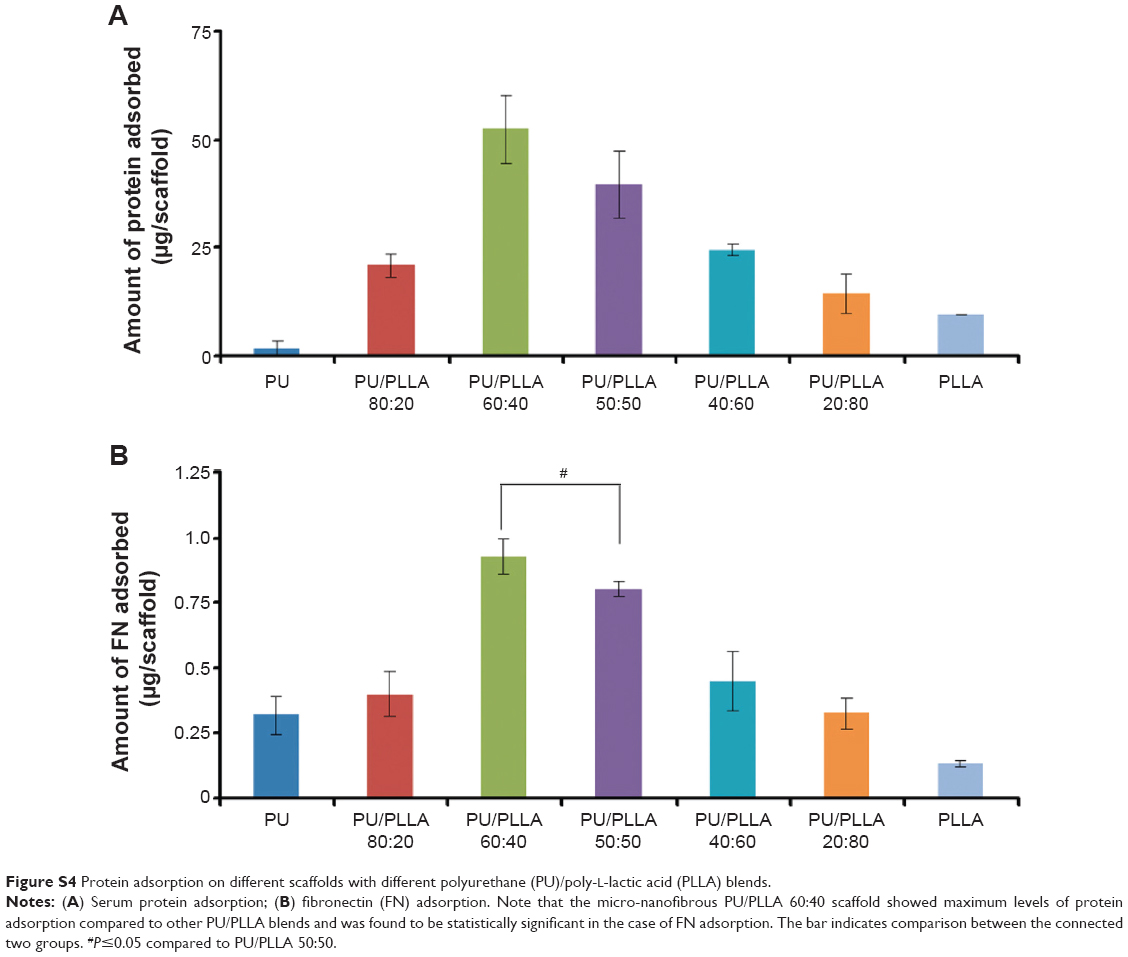 | Figure S4 Protein adsorption on different scaffolds with different polyurethane (PU)/poly-L-lactic acid (PLLA) blends. |
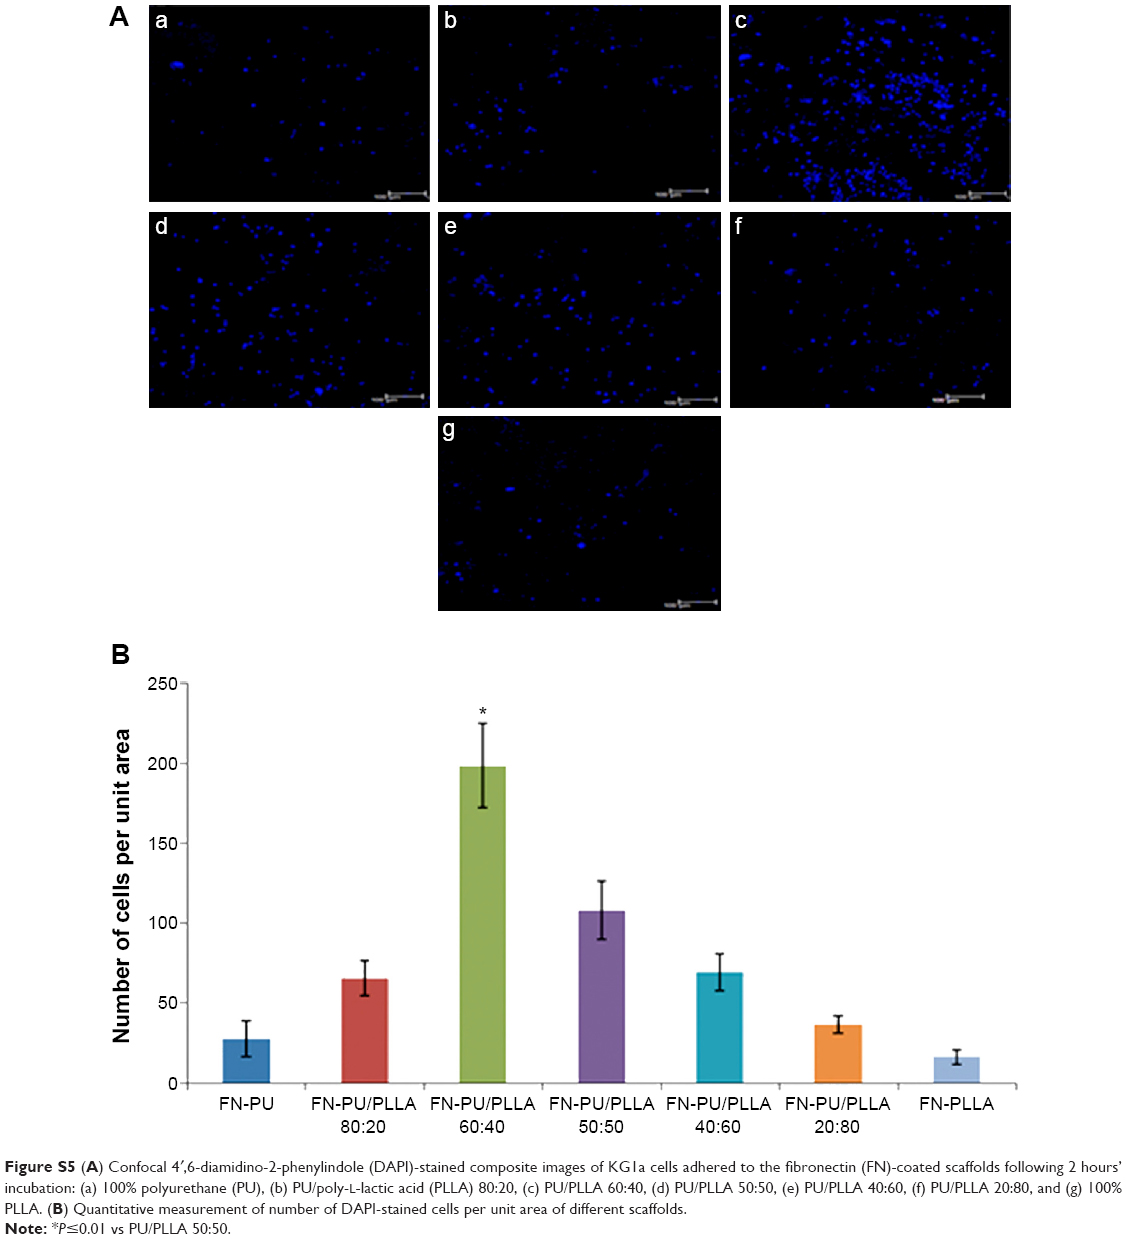 | Figure S5(A) Confocal 4′,6-diamidino-2-phenylindole (DAPI)-stained composite images of KG1a cells adhered to the fibronectin (FN)-coated scaffolds following 2 hours’ incubation: (a) 100% polyurethane (PU), (b) PU/poly-L-lactic acid (PLLA) 80:20, (c) PU/PLLA 60:40, (d) PU/PLLA 50:50, (e) PU/PLLA 40:60, (f) PU/PLLA 20:80, and (g) 100% PLLA. (B) Quantitative measurement of number of DAPI-stained cells per unit area of different scaffolds. |
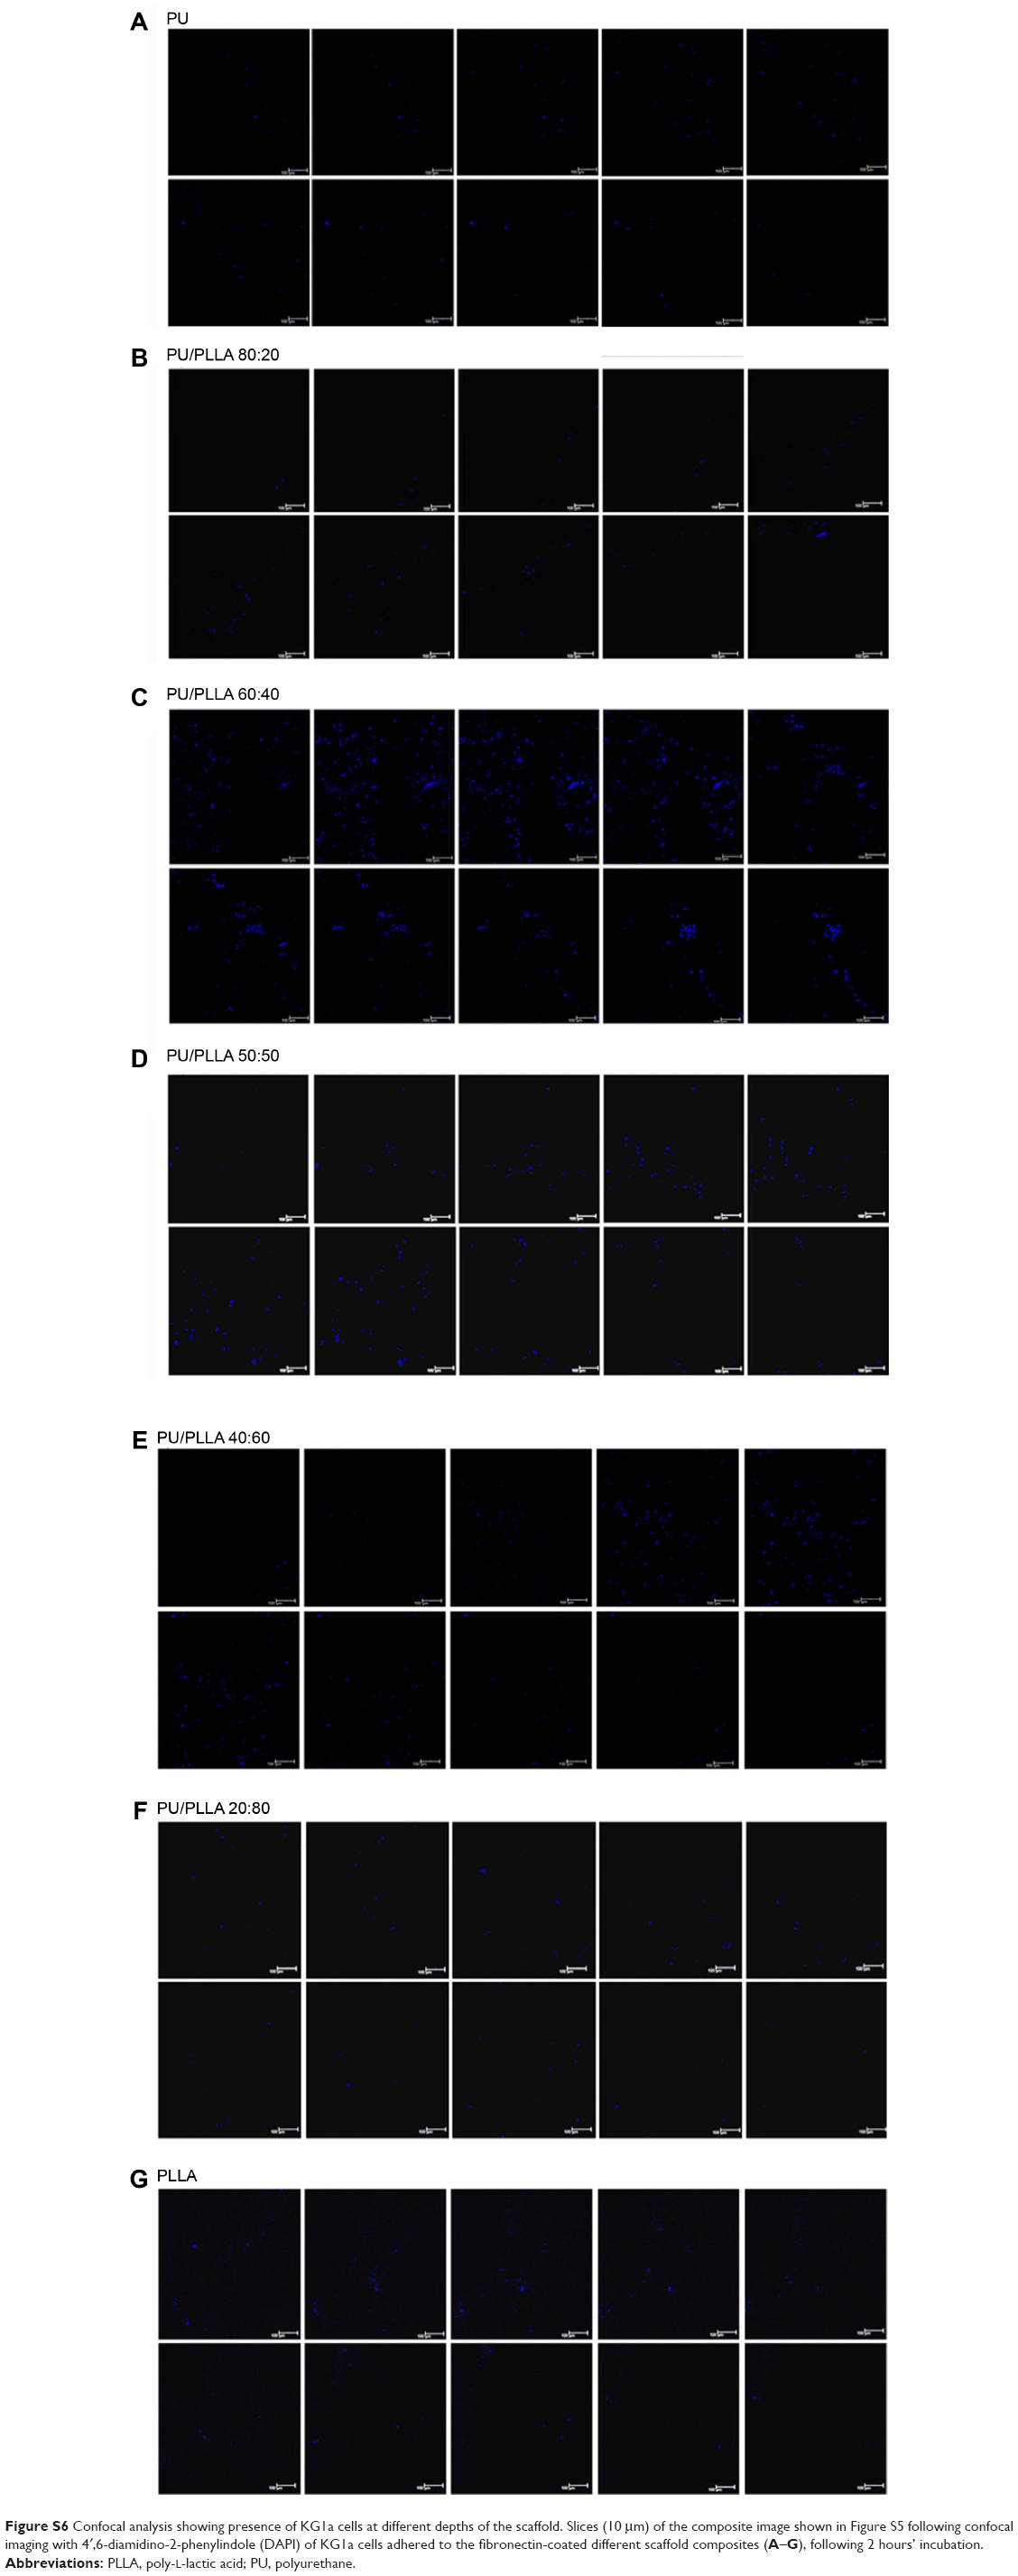 | Figure S6 Confocal analysis showing presence of KG1a cells at different depths of the scaffold. Slices (10 μm) of the composite image shown in Figure S5 following confocal imaging with 4′,6-diamidino-2-phenylindole (DAPI) of KG1a cells adhered to the fibronectin-coated different scaffold composites (A–G), following 2 hours’ incubation. |
 © 2015 The Author(s). This work is published and licensed by Dove Medical Press Limited. The full terms of this license are available at https://www.dovepress.com/terms.php and incorporate the Creative Commons Attribution - Non Commercial (unported, v3.0) License.
By accessing the work you hereby accept the Terms. Non-commercial uses of the work are permitted without any further permission from Dove Medical Press Limited, provided the work is properly attributed. For permission for commercial use of this work, please see paragraphs 4.2 and 5 of our Terms.
© 2015 The Author(s). This work is published and licensed by Dove Medical Press Limited. The full terms of this license are available at https://www.dovepress.com/terms.php and incorporate the Creative Commons Attribution - Non Commercial (unported, v3.0) License.
By accessing the work you hereby accept the Terms. Non-commercial uses of the work are permitted without any further permission from Dove Medical Press Limited, provided the work is properly attributed. For permission for commercial use of this work, please see paragraphs 4.2 and 5 of our Terms.