")
Back to Journals » Drug Design, Development and Therapy » Volume 9
Development and in vitro characterization of drug delivery system of rifapentine for osteoarticular tuberculosis
Authors Wu J, Zuo Y, Hu Y, Wang J, Li J, Qiao B, Jiang D
Received 1 December 2014
Accepted for publication 31 December 2014
Published 5 March 2015 Volume 2015:9 Pages 1359—1366
DOI https://doi.org/10.2147/DDDT.S78407
Checked for plagiarism Yes
Review by Single anonymous peer review
Peer reviewer comments 2
Editor who approved publication: Professor Shu-Feng Zhou
Jun Wu,1 Yi Zuo,2 Yunjiu Hu,1 Jian Wang,2 Jidong Li,2 Bo Qiao,1 Dianming Jiang1
¹Department of Orthopedics, The First Affiliated Hospital of Chongqing Medical University, Chongqing, People’s Republic of China; ²Research Center for Nano-Biomaterials, Analytical and Testing Center, Sichuan University, Chengdu, Sichuan, People’s Republic of China
Abstract: The study was to develop and evaluate the rifapentine-loaded poly(lactic acid-co-glycolic acid) (PLGA) microspheres (RPMs) for the treatment of osteoarticular tuberculosis to avoid critical side effects caused by oral regimens of antibiotics or intravenous antibiotics. The RPMs were spherical with rough surfaces, and elevated amounts of rifapentine in the formulation markedly increased the particle size and drug loading, while decreased the size distribution and entrapment efficiency. The highest drug loading and encapsulation efficiency of RPMs were 23.93%±3.93% and 88.49%±8.49%, respectively. After the initial rapid drug release, the release rate gradually decreased, and approximately 80% of the encapsulated rifapentine was released after 30 days of incubation. Moreover, RPMs could effectively inhibit the growth of Staphylococcus aureus. With increasing rifapentine content, the inhibition zones were continuously enlarged while the minimal inhibitory concentration values decreased. These results suggested that RPMs were bioactive and controlled release delivery systems for the treatment of osteoarticular tuberculosis.
Keywords: Staphylococcus aureus, antitubercular drugs, in vitro, PLGA microspheres, chemotherapy, antibacterial
Introduction
Osteoarticular tuberculosis, which accounts for approximately 10%–20% of all diagnosed tuberculosis, is the most common extrapulmonary tuberculosis.1 Antitubercular drugs have been used not only in the mild osteoarticular tuberculosis but also in the perioperation of infection foci debridement, remaining the cornerstone for the treatment of osteoarticular tuberculosis. At present, osteoarticular tuberculosis has been treated according to the standard therapy protocol by antitubercular drugs for a minimum of 8 and 20 months for total chemotherapy.2 However, longer treatment time resulted in patient noncompliance and critical side effects.3 It is key for the treatment of osteoarticular tuberculosis to increase local drug concentrations for higher therapeutic efficiencies and lower toxicity for body. Although antitubercular drugs implanted in the infection foci can achieve these requirements, they will be rapidly absorbed, possibly resulting in failure and recurrence. Research for more efficient therapeutic approaches for the treatment of tuberculosis has been carried out by using drug delivery systems.4–6 These systems are indeed expected to deliver medicines to the target tissue more specifically and release the drugs continually, enhancing the bioavailability and reducing the adverse effects.7 Among the various drug delivery systems, microspheres composed of biodegradable polymers, especially poly(lactic acid-co-glycolic acid) (PLGA) microspheres, have brought up tremendous interest.8,9 PLGA is approved by the US Food and Drug Administration (FDA) as a base for medical treatment due to its biocompatibility and biodegradability. PLGA microspheres have been successfully formulated to entrap the front-line antituberculosis agents,10 especially rifampicin-loaded PLGA microspheres.5,11 They have satisfactory characteristics and controlled release properties and exhibited great potential application in the field of tuberculosis treatment. However, to the best of our knowledge, the drug contents of most rifampicin-loaded PLGA microspheres are relatively low (from 4.9% to 16.5%);4 therefore, a higher dosage is needed to achieve effective concentrations.
Rifapentine is a semisynthetic antibiotic belonging to the rifamycin group and has been approved to be one of the first-line medicines for the treatment of tuberculosis by the FDA. Compared with rifampicin, rifapentine has similar antibacterial spectrum, but approximately ten times greater antibacterial potency against Mycobacterium tuberculosis bacteria (MTB) in vitro,3 and milder adverse reaction. Furthermore, rifapentine possesses a very important feature: it can prevent drug resistance.12 Taking these conditions into account, rifapentine was chosen as a model drug to formulate PLGA microspheres, which have not been reported yet in the literature.
In this study, rifapentine-loaded PLGA microspheres (RPMs) were prepared by emulsion solvent evaporation method. The physiochemical properties of RPMs were characterized, including morphology, size distribution, and encapsulation efficiency. In vitro drug release studies were carried out in phosphate-buffered saline (PBS, 0.2 M, pH 7.4) mediums at 37.1°C. Furthermore, the in vitro antibacterial properties of the microspheres were detected by agar diffusion test (ADT) and minimal inhibitory concentration (MIC).
Materials and methods
Materials
Poly(lactic-co-glycolic acid) (PLGA, lactic/glycolic =50:50) with an average molecular weight of 45,000 was purchased from Daigang Biomaterials Co. Ltd., Jinan, People’s Republic of China. Rifapentine was purchased from Ruibio Ltd., Germany. The polyvinyl alcohol 1799 (PVA 1799, Sinopec Sichuan Vinylon Factory, Chongqing, People’s Republic of China) was used as an emulsion stabilizer. Müeller–Hinton (MH) broth and agar powder were purchased from Oxoid Ltd., Hampshire, UK. The strains of Staphylococcus aureus (S. aureus, ATCC 6538) were procured from the clinical laboratory of the first affiliated hospital of Chongqing Medical University. All other chemical reagents were of analytical grade.
Microsphere preparation
Since rifapentine is a hydrophobic compound, RPMs were prepared by oil-in-water (O/W) emulsion solvent evaporation method.13 Briefly, 200 mg of PLGA was dissolved in 10 mL dichloromethane (DCM), and different amounts of rifapentine (0, 20, 50, 100 mg, named RPMs0, RPMs20, RPMs50, and RPMs100) were dissolved into the polymer solution. The polymer–solvent–drug solution (dispersed phase) was uniformly injected into 100 mL of 2 wt% PVA 1799 aqueous solution (continuous phase). The resulting mixture was emulsified by mechanical stirring (about 700× g) for 30 minutes at room temperature to yield an O/W emulsion. Subsequently, the emulsion was gently stirred (about 250× g) at room temperature until the DCM volatilized completely. The hardened microspheres were collected by centrifugation (2,000× g, 10 minutes) and washed three times with triple-distilled water. The microspheres were freeze dried overnight to obtain free-flowing particles and finally stored at −20°C.
Morphologies
The morphologies of RPMs were observed under a scanning electron microscope (SEM, JSM-6500LV, JEOL, Tokyo, Japan). The dry specimens were mounted onto sample stubs using double-sided adhesive tape and then coated with gold palladium under vacuum. The coated microspheres were observed under the SEM at 15 kV.
Size distribution
The size distribution of the microspheres was measured using laser particle size analyzer (JL-6000, Chengdu Jingxin Power Analysis Instruments Ltd., Chengdu, People’s Republic of China), and the D50 volume diameter was taken as the mean diameter of the microspheres.
Rifapentine content and encapsulation efficiencies
To detect the drug content and encapsulation efficiency of the RPMs, 10 mg of RPMs was accurately weighed and dissolved in 10 mL of methanol. After incubation at 37.1°C overnight, the rifapentine in the solution was analyzed by UV–visible spectrophotometry (SP-754, Shanghai Spectrum, People’s Republic of China) at a wavelength of 475 nm. The drug contents in the RPMs were calculated with a calibration curve of rifapentine, which was achieved from rifapentine solution in methanol with a concentration between 0.03 and 27 mg/L (R2=0.9997). The encapsulation efficiency was defined as the percent ratio of the actual rifapentine loading to the theoretical rifapentine loading. Tests were done in triplicate.
In vitro rifapentine release
The in vitro rifapentine release studies were carried out in PBS (0.2 M, pH 7.4). About 10 mg of RPMs was enclosed in a dialysis bag with a molecular weight cutoff of 3,500, and then placed in a 50 mL centrifuge tube which was prefilled with 10 mL PBS. The tube was placed in a shaking water bath (37°C and 100× g), and the PBS was replenished every day. At appropriate time intervals, the supernatant of the PBS solution was collected and the optical density was read at a wavelength of 475 nm by UV–visible spectrophotometry. The release rates and cumulative release profiles were calculated and mapped. The analysis of each sample was repeated three times.
In vitro antibacterial activity
Bacterial suspension
Rifapentine is a broad-spectrum antibiotic and has a highly antibacterial activity toward most gram-positive cocci. Therefore, S. aureus (ATCC 6538) was used in this study to investigate the in vitro antibacterial performance of RPMs. A single colony of S. aureus was inoculated in MH broth and incubated at 37°C for 24 hours in an incubator (Mermmet model 800). Then the bacterial suspension was diluted with MH broth to 106 colony-forming units per milliliter (CFU/mL).
Agar diffusion test
Susceptibility of S. aureus strains to RPMs was determined by the ADT with a filter paper. About 10 mg of the samples were suspended in 10 mL of sterile PBS for 24 hours. The PBS suspensions were centrifuged (1,000× g, 5 minutes) to acquire supernatants, in which the sterile filter papers with a diameter of 10 mm were immersed. Thirty minutes later, the filter papers were withdrawn, the excess liquid was drained off, and then irradiated by ultraviolet radiation three times, every half an hour. About 50 μL of bacterial suspensions were homogeneously spread on MH agar plates. The filter papers were carefully placed in the center of the plates with sterile tweezers. After incubation at 37°C for 20 hours, the agar plates were examined for the inhibition zone. The pure rifapentine and unloaded PLGA microspheres were used as positive and negative controls.
Minimal inhibitory concentration
The MIC values of rifapentine and RPMs were determined by the broth macrodilution method according to the standard M07-A9 recommended by the Clinical and Laboratory Standards Institute.14 About 12.8 mg of the samples were dissolved in 5 mL of sterile MH broth and serially diluted to final concentrations of 0.3 μg/mL (rifapentine) and 5 μg/mL (RPMs). The freshly prepared bacteria suspension (2 mL; 106 CFU/mL in MH broth) was added to the same volume of samples – MH broth. Therefore, the final concentration of the S. aureus was 5×10⁵ CFU/mL. Subsequently, the inoculated broth was incubated at 37°C for 16 hours. The MIC value was the lowest antibacterial agent concentration that can completely inhibit the growth of the bacterium as detected by the naked eye. Tests were performed in triplicate.
Statistical analysis
Results are expressed as means ± standard deviation. Statistical analyses were performed using the SPSS 17.0 software. Comparisons between the groups were performed using one-way analysis of variance (ANOVA) with Tukey’s test. A difference was considered statistically significant if the P-value was less than or equal to 0.05.
Results and discussion
PLGA microspheres for rifapentine delivery
The PLGA microspheres were well dispersed and mostly spherical in shape (Figure 1). The rifapentine-unloaded PLGA microspheres showed smooth surfaces without hollows or deformations (Figure 1A). Although the microspheres maintained their spherical shape, the rifapentine in the formulation significantly affected the surface morphology. The surfaces of the RPMs20 were bumpy, since there were some shallow concaves (Figure 1B). As the initial drug-to-polymer ratio increased, the concaves on surfaces of the RPMs became deeper and changed into pores (Figure 1C and D). Meanwhile, the surface porosity increased significantly and the pores almost spread over the surfaces of the RPMs100 (Figure 1D). According to Gilchrist et al15 these concaves (pores) were formed due to the loss of solid-solid phase-separated domains of drug from the polymer during the microsphere hardening process.
 | Figure 1 SEM images of unloaded PLGA microspheres and RPMs. |
Figure 2 presents the size distribution of three kinds of RPMs and one unloaded PLGA microspheres. The 50th volume particle diameters (D50) were 12.422 μm for RPMs0, 16.737 μm for RPMs20, 25.267 μm for RPMs50, and 27.833 μm for RPMs100. With the increase in the D50 of PLGA microspheres, the size distribution was narrowed gradually. Rifapentine is a hydrophobic chemical reagent that would increase the viscosity of the PLGA–DCM solution (the oil phase). Thus, because of the increasing amount of rifapentine in the formula, the oil phase was more difficult to be dispersed into the external aqueous phase during the second emulsification process.
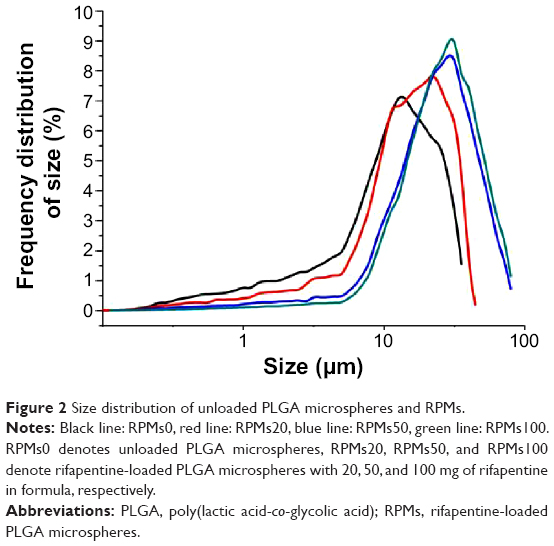 | Figure 2 Size distribution of unloaded PLGA microspheres and RPMs. |
The drug loading and encapsulation efficiency of the RPMs are summarized in Table 1. It is obvious that, with an increase of rifapentine theoretical drug loading, the actual drug loading increased, since there was more rifapentine to be encapsulated by the PLGA polymer matrix. However, the entrapment efficiency decreased with the increase of theoretical drug loading. We all know that fast polymer precipitation on the surface of the dispersed phase can prevent drug loss into the external continuous phase.16 Rifapentine delayed the solidification of the polymer–solvent–drug solution, and more rifapentine molecules were diffused into the continuous phase under the action of concentration potential energy. What’s more, according to Gilchrist et al15 the lower encapsulation efficiency in the RPMs with higher rifapentine loadings might be explained by the loss of solid-solid phase-separated domains of drug from the polymer. As shown in Figure 1, elevated amounts of rifapentine in the formulation markedly increased the surface porosity, losing more phase-separated domains and reducing the encapsulation efficiency.
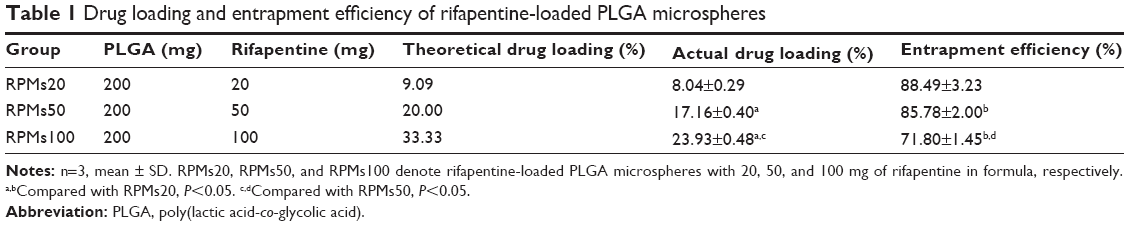 | Table 1 Drug loading and entrapment efficiency of rifapentine-loaded PLGA microspheres |
In view of the effects of rifapentine on the morphology, size distribution, drug loading, and encapsulation efficiency of the RPMs, the optimum parameters of RPMs preparation in our study were as follows: 50 mg of rifapentine and 200 mg of PLGA dissolved in 10 mL DCM, and then uniformly injected into 100 mL of 2 wt% PVA 1799 aqueous solution. The mean diameter of the RPMs50 was 25.267 μm, and the drug loading and encapsulation efficiency were 17.16%±0.40% and 85.78%±2.00%, respectively. In 2011, Doan et al4 optimized the process parameters of solvent evaporation method to produce rifampicin-loaded PLGA microspheres with satisfactory rifampicin contents (from 4.9% to 16.5%). The maximal drug loading of rifampicin-loaded PLGA microspheres prepared by Lawlor et al17 using a solvent evaporation process was 25.67±0.73 μg rifampicin per mg of PLGA, which represented an encapsulation efficiency of 16.75%±0.49%. It is obvious that the drug loading and encapsulation efficiency of the RPMs in this study were higher than those of the two rifampicin-loaded PLGA microspheres mentioned earlier. Since rifapentine had approximately ten times greater antibacterial potency against MTB in vitro, the antibacterial potency of RPMs was much higher than that of the rifampicin-loaded PLGA microspheres under the same dosage. Furthermore, the encapsulation efficiency was also higher than the highest encapsulation efficiency (72.08%±1.90%) of rifapentine-loaded proliposomes, prepared by single-step spray drying method.18 It is well known that improving the encapsulation efficiency and drug loading could reduce not only the loss of the bioactive substances but also the administration dosage of microspheres.
In vitro rifapentine release
The release characteristic is an important aspect that must be examined during the research and development process of a drug delivery system. The in vitro release test was an in vitro evaluation method of microspheres, and the results of three types of RPMs are shown in Figures 3 and 4. All the three types of microspheres in our tests exhibited a similar biphasic release profile. A large amount of rifapentine was released during the first 2 days, which was followed by a period of decreased release rate for nearly 4 weeks. At the end of the in vitro release tests, the cumulative release percentages of rifapentine were 72.10%±0.26% for RPMs20, 80.22%±0.56% for RPMs50, and 78.59%±0.14% for RPMs100.
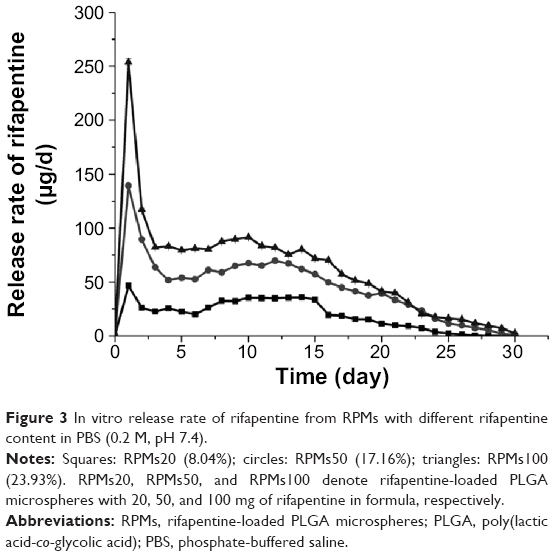 | Figure 3 In vitro release rate of rifapentine from RPMs with different rifapentine content in PBS (0.2 M, pH 7.4). |
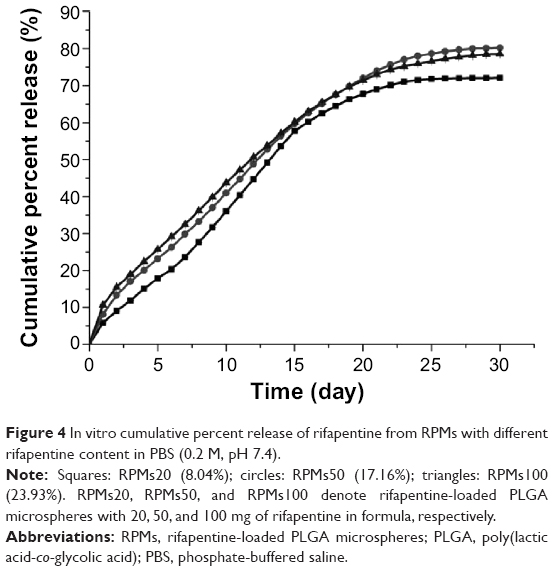 | Figure 4 In vitro cumulative percent release of rifapentine from RPMs with different rifapentine content in PBS (0.2 M, pH 7.4). |
The initial release increased with increasing dosage of rifapentine in the formulation, which was 9.07%±0.11% for RPMs20, 13.33%±0.38% for RPMs50, and 15.50%±0.09% for RPMs100. The initial fast release was usually described as a burst release, which might be attributed to the surface-bound and poorly encapsulated drugs close to the surface.19 From the section PLGA Microspheres for Rifapentine Delivery in this paper, we know that a higher rifapentine dosage facilitates the formation of more holes, which enlarge the surface area per unit volume exposed to the release medium. The porous structure of the PLGA microspheres allowed the drug trapped in the layers near the surface to be rapidly released.20 Furthermore, the higher the drug loading, the more drug molecules on the surface, which could contribute significantly to the burst effect. Therefore, the higher dosage of rifapentine in the formulation led to higher initial burst.
Subsequently, the release phase shifted to a sustained release one, during which rifapentine was released at a slow and gradually decreasing rate. According to Fredenberg et al21 the sustained release phase was often attributed to the combined effects of diffusion and erosion of the PLGA substrate. Rifapentine was released by diffusion through the water-filled pores which were formed by the inner aqueous phase during the fabrication process, diffusion of the drug, degradation, and subsequent erosion of the PLGA substrate. It could be observed in Figure 3 that, at the most time point, the higher the drug loading, the greater the rifapentine release. There are two possible explanations for this phenomenon. On the one hand, the diffusion might be promoted by the rifapentine concentration gradient between the RPMs and the dissolution medium. On the other, the porosity was increased by diffusion of the drug and erosion of the PLGA substrate, leading to more PLGA substrates contacting with the dissolution medium, facilitating further drug release and erosion of the PLGA substrate.22,23
This kind of drug release characteristic possessed some clinical significance in the treatment of osteoarticular tuberculosis. During the period of the initially fast release phase, a large amount of rifapentine was released to obtain a high concentration level in the lesion site of infection, killing the pathogenic bacteria quickly and effectively. Subsequently, the slow and sustained drug release was conducive to maintain an effective drug concentration for a long time, to inhibit the growth of bacteria sustainably, and to prevent recrudescence.
In vitro antibacterial activity
The antibacterial activity of the RPMs against S. aureus was evaluated by the ADT and MIC. The results of ADT are shown in Figure 5. The pure PLGA microspheres, which were used as negative control, do not affect the bacterial growth. However, the pure rifapentine showed a markedly large inhibition zone (21.88±0.40) μm, which was larger than 20 μm. According to the standards M100-S23 recommended by the Clinical and Laboratory Standards Institute,24 S. aureus strains used in our research are susceptible to rifapentine. Therefore, S. aureus strains were used to evaluate the antibacterial activities of rifapentine and RPMs. The average diameter of the inhibition zones were 7.62±1.02 μm for RPMs20, 11.27±0.58 μm for RPMs50, and 13.38±1.01 μm for RPMs100, showing that the increase of rifapentine loading enlarged the inhibition zones.
 | Figure 5 The agar diffusion tests of unloaded PLGA microspheres, RPMs, and rifapentine against Staphylococcus aureus strains. |
The MIC of rifapentine against S. aureus is shown in Figure 6. Under the naked eyes, the MH broth had already been cloudy since the tenth tube. Therefore, the concentration of rifapentine in the ninth tube (5 μg/mL) was the MIC value of rifapentine against S. aureus. Combined with the ADT results, a conclusion could be drawn that rifapentine possessed a high antimicrobial activity against S. aureus in vitro.
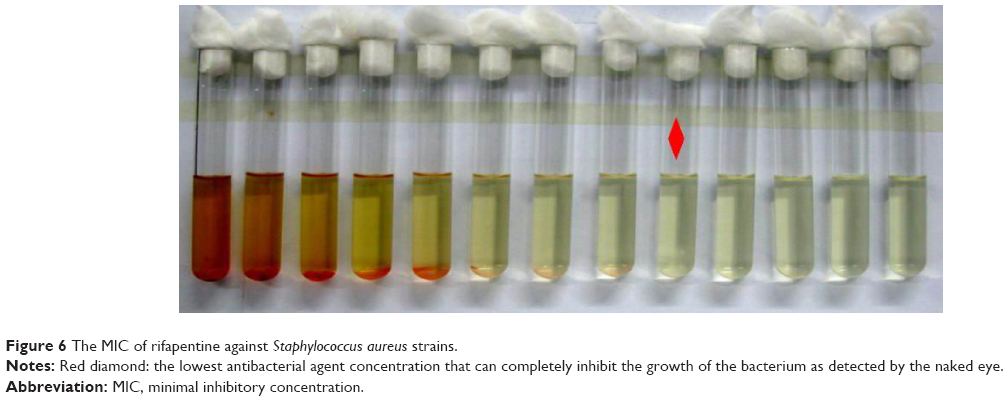 | Figure 6 The MIC of rifapentine against Staphylococcus aureus strains. |
Since the MIC value of rifapentine was the concentration of rifapentine in the ninth tube, only nine concentration gradients of each kind of PLGA microspheres were used in our study. The results of the tests are plotted in Figure 7. The MIC values of RPMs against S. aureus were 40 μg/mL (RPMs100, Figure 7A), 80 μg/mL (RPMs50, Figure 7B), and 320 μg/mL (RPMs20, Figure 7C). The MIC values continuously decreased with the increase of rifapentine loading, and the results were in good agreement with those of ADT. At the same bacterial concentration, the inhibition zones and MIC values were determined by the amount of antimicrobial active substances in the medium. Thus, by combining these two assays, we were able to conclude that the antimicrobial potency of the RPMs was attributed to the release of rifapentine from the RPMs and its seepage into the medium. On increasing the rifapentine content of the RPMs, the concentration differences between the microspheres and the medium were increased and more rifapentine was released. Therefore, the inhibition zones enlarged while the MIC values decreased. In view of the antimicrobial activity of RPMs against S. aureus, we think that the rifapentine does not get inactivated during the preparation process (the emulsion solvent evaporation method).
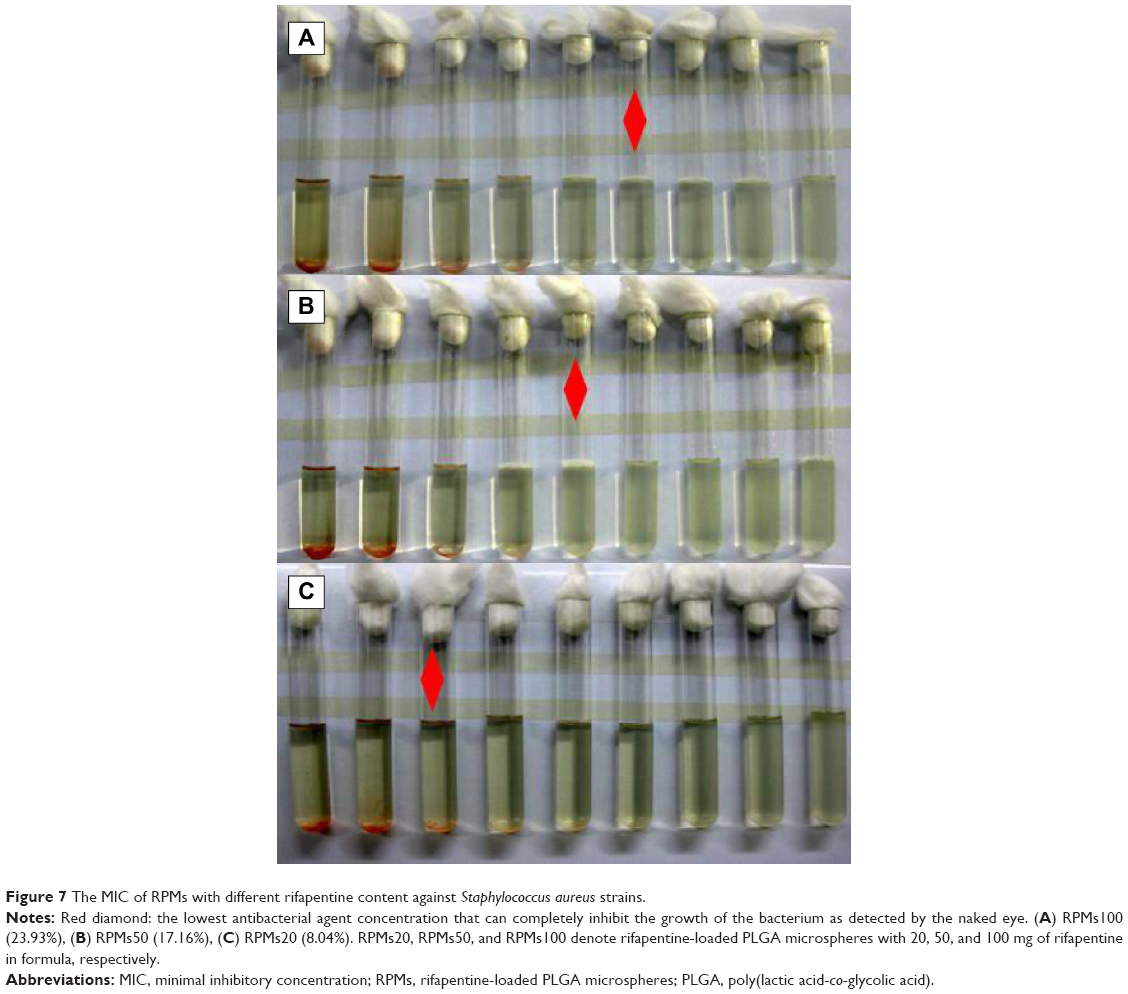 | Figure 7 The MIC of RPMs with different rifapentine content against Staphylococcus aureus strains. |
Conclusion
In this study, rifapentine was successfully entrapped in PLGA microspheres using the O/W emulsion solvent evaporation method. The optimum parameters of RPMs preparation in our study were 50 mg of rifapentine and 200 mg of PLGA dissolved in 10 mL DCM, and then uniformly injecting into 100 mL of 2 wt% PVA aqueous solution. Elevated amounts of rifapentine in the formulation markedly increased the particle size and drug loading, while decreasing the size distribution and entrapment efficiency of the RPMs. The highest drug loading and encapsulation efficiency of the RPMs were 23.93%±0.48% and 88.49%±3.23%, respectively. After an initially rapid drug release during the first 2 days, the rifapentine release gradually slowed down and approximately 80% of the encapsulated rifapentine was released after 30 days of incubation. The in vitro antibacterial activity indicated that the RPMs were bioactive and able to kill the S. aureus in vitro. All these results suggest that the PLGA could be used as a good carrier for rifapentine to formulate a bioactive and controlled release delivery system that exhibits a great potential in the treatment of osteoarticular tuberculosis. Further research should be carried out to evaluate the biocompatibility and bioactivity of the RPMs in vivo.
Acknowledgment
This study was supported by the National Natural Science Foundation of China (Grant No 81171685).
Disclosure
The authors report no conflicts of interest in this work.
References
Muradali D, Gold WL, Vellend H, et al. Multifocal osteoarticular tuberculosis: report of four cases and review of management. Clin Infect Dis. 1993;17:204–205. | ||
Suárez-García I, Noguerado A. Drug treatment of multidrug-resistant osteoarticular tuberculosis: a systematic literature review. Int J Infect Dis. 2012;16:e774–e778. | ||
Aristoff PA, Garcia GA, Kirchhoff PD, et al. Rifamycins – obstacles and opportunities. Tuberculosis. 2010;90:94–118. | ||
Doan T, Couet W, Olivier J. Formulation and in vitro characterization of inhalable rifampicin-loaded PLGA microspheres for sustained lung delivery. Int J Pharm. 2011;414:112–117. | ||
Hirota K, Hasegawa T, Nakajima T, et al. Delivery of rifampicin-PLGA microspheres into alveolar macrophages is promising for treatment of tuberculosis. J Control Release. 2010;142:339–346. | ||
Kyung HH, Seok HW, Tae JK. In vitro degradation and drug-release behavior of electrospun, fibrous webs of poly(lactic-co-glycolic acid). J Appl Polym Sci. 2012;124:209–214. | ||
Kaparissides C, Alexandridou S, Kotti K, et al. Recent advances in novel drug delivery systems. J Nanotechnol Online. 2006;2:1–11. | ||
Danhier F, Ansorena E, Silva JM, et al. PLGA-based nanoparticles: an overview of biomedical applications. J Control Release. 2012;161:505–522. | ||
Makadia HK, Siegel SJ. Poly lactic-co-glycolic acid (PLGA) as biodegradable controlled drug delivery carrier. Polymers. 2011;3:1377–1397. | ||
Ain Q, Sharma S, Garg S, et al. Role of poly [DL-lactide-co-glycolide] in development of a sustained oral delivery system for antitubercular drug (s). Int J Pharm. 2002;239:37–46. | ||
Hirota K, Hasegawa T, Nakajima T, et al. Phagostimulatory effect of uptake of PLGA microspheres loaded with rifampicin on alveolar macrophages. Colloid Surface B. 2011;87:293–298. | ||
Chan JG, Bai X, Traini D. An update on the use of rifapentine for tuberculosis therapy. Expert Opin Drug Deliv. 2014;11:421–431. | ||
Zhang YH, Wang Y, Kong XC, et al. Facile preparation of polylactic acid/ketoconazole composite microspheres by oil/water solvent evaporation method. Adv Mater Res. 2013;652:335–338. | ||
Clinical and Laboratory Standards Institute. Methods for Dilution Antimicrobial Susceptibility Tests for Bacteria That Grow Aerobically; Approved Standard-Ninth Edition. Wayne, PA: Clinical and Laboratory Standards Institute; 2012. | ||
Gilchrist SE, Rickard DL, Letchford K, et al. Phase separation behavior of fusidic acid and rifampicin in PLGA microspheres. Mol Pharm. 2012;9:1489–1501. | ||
Yeo Y, Park K. Control of encapsulation efficiency and initial burst in polymeric microparticle systems. Arch Pharm Res. 2004;27:1–12. | ||
Lawlor C, O’Sullivan MP, Rice B, et al. Therapeutic aerosol bioengineering of targeted, inhalable microparticle formulations to treat Mycobacterium tuberculosis (MTb). J Mater Sci Mater Med. 2012;23:89–98. | ||
Patil-Gadhe A, Pokharkar V. Single step spray drying method to develop proliposomes for inhalation: a systematic study based on quality by design approach. Pulm Pharmacol Ther. 2014;27(2):197–207. | ||
Janoria KG, Mitra AK. Effect of lactide/glycolide ratio on the in vitro release of ganciclovir and its lipophilic prodrug (GCV-monobutyrate) from PLGA microspheres. Int J Pharm. 2007;338:133–141. | ||
Hsin MW, Jian JW, Chi-Hwa W. In vitro sustained release of human immunoglobulin G from biodegradable microspheres. Ind Eng Chem Res. 2001;40:933–948. | ||
Fredenberg S, Wahlgren M, Reslow M, et al. The mechanisms of drug release in poly (lactic-co-glycolic acid)-based drug delivery systems – a review. Int J Pharm. 2011;415:34–52. | ||
Batycky RP, Hanes J, Langer R, et al. A theoretical model of erosion and macromolecular drug release from biodegrading microspheres. J Pharm Sci. 1997;86:1464–1477. | ||
Perugini P, Genta I, Conti B, et al. Long-term release of clodronate from biodegradable microspheres. AAPS Pharm Sci Tech. 2001;2:6–14. | ||
Clinical and Laboratory Standards Institute. Performance Standards for Antimicrobial Susceptibility Testing; Twenty-Third Informational Supplement. Wayne, PA: Clinical and Laboratory Standards Institute; 2013. |
 © 2015 The Author(s). This work is published and licensed by Dove Medical Press Limited. The full terms of this license are available at https://www.dovepress.com/terms.php and incorporate the Creative Commons Attribution - Non Commercial (unported, v3.0) License.
By accessing the work you hereby accept the Terms. Non-commercial uses of the work are permitted without any further permission from Dove Medical Press Limited, provided the work is properly attributed. For permission for commercial use of this work, please see paragraphs 4.2 and 5 of our Terms.
© 2015 The Author(s). This work is published and licensed by Dove Medical Press Limited. The full terms of this license are available at https://www.dovepress.com/terms.php and incorporate the Creative Commons Attribution - Non Commercial (unported, v3.0) License.
By accessing the work you hereby accept the Terms. Non-commercial uses of the work are permitted without any further permission from Dove Medical Press Limited, provided the work is properly attributed. For permission for commercial use of this work, please see paragraphs 4.2 and 5 of our Terms.