")
Back to Journals » International Journal of Nanomedicine » Volume 9 » Issue 1
Cytotoxicity and genotoxicity caused by yttrium oxide nanoparticles in HEK293 cells
Authors Selvaraj V, Bodapati S, Murray E, Rice K, Winston N, Shokuhfar T , Zhao Y, Blough E
Received 7 August 2013
Accepted for publication 23 November 2013
Published 12 March 2014 Volume 2014:9(1) Pages 1379—1391
DOI https://doi.org/10.2147/IJN.S52625
Checked for plagiarism Yes
Review by Single anonymous peer review
Peer reviewer comments 4
Vellaisamy Selvaraj,1 Sravanthi Bodapati,1 Elizabeth Murray,2 Kevin M Rice,1 Nicole Winston,1,3 Tolou Shokuhfar,4 Yu Zhao,4 Eric Blough1,3,5
1Center for Diagnostic Nanosystems, 2Department of Integrated Science and Technology, 3Department of Pharmaceutical Sciences and Research, School of Pharmacy, Marshall University, Huntington, WV, USA; 4Department of Mechanical Engineering and Engineering Mechanics, Michigan Technological University, Houghton, MI, USA; 5Department of Pharmacology, Physiology and Toxicology, School of Medicine, Marshall University, Huntington, WV, USA
Background: The increased use of engineered nanoparticles (NPs) has caused new concerns about the potential exposure to biological systems and the potential risk that these materials may pose on human health. Here, we examined the effects of exposure to different concentrations (0–50 µg/mL) and incubation times (10 hours, 24 hours, or 48 hours) of yttrium oxide (Y2O3) NPs on human embryonic kidney (HEK293) cells. Changes in cellular morphology, cell viability, cell membrane integrity, reactive oxygen species levels, mitochondrial membrane potential, cell death (apoptosis and necrosis), and the DNA damage after NP exposure were compared to the effects seen following incubation with paraquat, a known toxicant.
Results: The 24-hour inhibitory concentration 50 (IC50) of Y2O3 NPs (41±5 nm in size) in the HEK293 cells was found to be 108 µg/mL. Incubation with Y2O3 NPs (12.25–50 µg/mL) increased the ratio of Bax/Bcl-2, caspase-3 expression and promoted apoptotic- and necrotic-mediated cell death in both a concentration and a time-dependent manner. Decreases in cell survivability were associated with elevations in cellular reactive oxygen species levels, increased mitochondrial membrane permeability, and evidence of DNA damage, which were consistent with the possibility that mitochondria impairment may play an important role in the cytotoxic response.
Conclusion: These data demonstrate that the Y2O3 NP exposure is associated with increased cellular apoptosis and necrosis in cultured HEK293 cells.
Keywords: yttrium oxide nanoparticles, cytotoxicity, mitochondria damage, DNA damage, ROS production, apoptosis, necrosis
Introduction
The application of nanotechnology in industry is quickly growing, with a worldwide market size estimated to be in excess of US$1 trillion by the year 2015.1 Despite the rapid progress and early acceptance of nanotechnology, the potential for adverse health effects in humans and the environment has not yet been established. Although several research groups have demonstrated that exposure to nanoparticles (NPs) may affect cellular viability and growth, little is known regarding the potential mechanism(s) of toxicity.2–4 It is thought that nanoparticles can disrupt and impair normal cellular function through a number of mechanisms.5 For example, nanoparticles may contain toxic materials or ions that directly or indirectly harm the cell through the generation of reactive oxygen species (ROS). Indeed, cytotoxicity due to ROS generation has been reported with a number of different nanoparticles, including titanium dioxide (TiO2),6 C60 fullerenes,7 and CeO2.8 Independent of composition, nanoparticles may also cause cellular damage due to their ability to adhere to or to pass through cell membranes.5,9
Yttrium oxide nanoparticles (Y2O3 NPs) are used in a number of different applications, including biological imaging, the material sciences, and in the chemical synthesis of inorganic compounds.10 The Y2O3 NPs are thought to be one of the most important yttrium compounds and are widely used in the manufacturing of plasma televisions, cathode ray display panles and in microwave filters. Other applications for Y2O3 NPs include use in high-temperature/infrared-shielding applications and as additives in paint, plastic, steel, iron, and optics.11 As Y2O3 NPs use accelerates, the risk of intentional and inadvertent release into the environment increases, with possible implications for human and environmental health.
How exposure to the Y2O3 NPs may affect physiological systems is not yet known. Given the delicate structure of the kidney filtration system, along with the major role that this organ plays in the filtration of bodily fluids and the excretion of waste products, it is quite possible that an inappropriate exposure to Y2O3 NPs may affect renal cell structure and function. To investigate this possibility, the well-characterized human embryonic kidney (HEK293) cell line was chosen as a test system, given the widespread use of these cells to evaluate the cytotoxic effects of chemicals.12 Other, more recent reports demonstrate the use of these cells for investigating the potential toxicity of nanoparticles.13–16
Andelman et al examined the effects of exposure to different types of Y2O3 NPs on human foreskin fibroblast cells and demonstrated a concentration-dependent (25–500 μg/mL) cytotoxicity by live/dead cell assay.10 To investigate the potential mechanisms of the Y2O3 NPs toxicity, we exposed the HEK293 cells to different concentrations of NPs to first determine the acute cytotoxic dose (IC50). Once determined, this information was then used as a starting point for investigating the potential mechanisms of cytotoxicity, using a variety of different approaches. To increase the applicability of our findings to those who may not be well-versed in nanotechnology, the inclusion of paraquat, a widely known toxicant, was often included in an attempt to allow meaningful comparisons between the fields of nanotoxicology and traditional toxicology. Taken together, our data suggest that an exposure to the Y2O3 NPs is associated with increased cytotoxicity and genotoxicity. Additional studies to confirm these findings using other types of Y2O3 NPs, cell types, and experimental designs may be warranted.
Materials and methods
Materials
Y2O3 NPs (99.95% purity as determined by inductively coupled plasma mass spectrometry, were purchased from the MK Impex Corporation (Mississauga, ON, Canada). The JC-1 Mitochondrial Membrane Potential Detection Kit was purchased from Cell Technology, Inc (Mountain View, CA, USA); the OxiSelect™ ROS Assay Kit was from Cell Biolabs, Inc., (San Diego, CA, USA); the Comet Assay™ kit was from Trevigen, Inc., (Gaithersburg, MD, USA). The Annexin V-FITC/PI Kit System was purchased from BD Biosciences (San Jose, CA, USA); the Lactate Dehydrogenase (LDH) Activity Assay Kit was from BioVision Inc., (Milpitas, California, USA). The Lonza PAGEr™ Gold Precast Gels were from (Lonza Group Ltd, Basel, Switzerland) and the Amersham ECL Western Blotting Detection Reagent and membranes were from GE Healthcare Bio-Sciences Corporation (Piscataway, NJ, USA).
All primary and secondary antibodies, positive control proteins, biotinylated ladder, and the antibiotin horseradish peroxidase antibody were from Cell Signaling Technology, Inc., (Danvers, MA, USA). The prestained sodium dodecyl sulfate polyacrylamide gel electrophoresis standards were from Bio-Rad Life Science (Hercules, CA, USA). The tissue culture media was from American Type Culture Collection (Manassas, VA, USA), fetal bovine serum was from Atlanta Biological Inc., (Flowery Branch, GA, USA); and the Bradford reagent was from Bio-Rad Life Science. All other tissue culture reagents, chemicals, and products were purchased from BD (Franklin Lakes, NJ, USA) or Sigma-Aldrich (St Louis, MO, USA).
Aqueous Y2O3 NPs preparation and atomic force microscopy
The Y2O3 NPs stock suspensions (2.5 mg/mL) were prepared in double distilled water by sonication, using a Vibra-Cell Sonicator (Sonics and Materials, Inc., Newtown, CT, USA) at 600 watts for 5 minutes at room temperature. Particles were imaged in their native state using a MultiMode-8 Atomic Force Microscope (Bruker AXS Inc., Ewing Township, NJ, USA) in the tapping mode. Briefly, a few drops of Y2O3 NPs were placed on freshly peeled mica substrate and allowed to dry in a Petri dish floating in a sonicator water bath (VWR, Radnor, PA, USA) for 30 minutes at 240 watts. Images were recorded using the contact mode. At least 100 particles were analyzed for each of the different stock suspensions.
Transmission electron microscopy
Particles were imaged in their native state using a Hitachi H-7000 TEM electron microscope at 75 keV and a magnification of 50,000× (Hitachi Ltd, Tokyo, Japan). ImageJ software (National Institutes of Health, Bethesda, MD, USA) was used to calculate particle size from at least 100 NPs.
Dynamic light scattering
The hydrodynamic size and size distribution of the Y2O3 NPs were evaluated in Milli-Q water (Millipore, Bedford, MA, USA) using back-scattered light with a particle size analyzer (Model-LB-550, HORIBA Ltd, Kyoto, Japan) that was equipped with a helium–neon laser (633 nm). Experiments were performed in triplicate with freshly prepared samples over three different occasions.
X-ray diffraction analysis
Dried Y2O3 NPs were placed on a glass slide with a thin layer of vacuum grease. The X-ray diffraction (XRD) spectra were taken using a Scintag XDS2000 powder XRD instrument, using a scale range of 20–69.98° for 20 theta (Θ), a step size of 0.03o and a dwell time of 2.250 seconds. The powder diffraction file JCPDF Number 41-1105 was taken from the reference libraries of the International Center for Diffraction Data®.
Cell culture and toxicity studies
The HEK293 cells (CRL-1573TM, American Type Culture Collection) were grown in 25 cm2 cell culture flasks at 30°C with 5% CO2 in Dulbecco’s Modified Eagle’s Medium high glucose medium containing 1% penicillin/streptomycin (10,000 U penicillin and 10 mg streptomycin/mL) and supplemented with 5% of fetal bovine serum. The stock solutions of Y2O3 NPs were serially diluted in sterile water to different concentrations. These were sonicated (600 watts ×2 minutes at 22°C–23°C) and then added to the growth media. The IC50 dose dependent of Y2O3 NPs was determined using the 3-[4,5-dimethylthiazol-2-yl]-2,5 diphenyl tetrazolium bromide (MTT) assay, as detailed previously.17
Observation of morphological alterations, cell proliferation, and lactate dehydrogenase leakage
The HEK293 cells (1 × 10⁵/mL) were grown in 24-, 12-, or 6-well tissue culture plates until 70%–80% confluence, the media removed, and then incubated with fresh media containing different Concentrations of Y2O3 NPs (0, 0.25, 6.125, 12.26, 25, or 50 μg/mL) for 10 hours, 24 hours, or 48 hours. Cell morphology was observed using an AXiovert40c/CFL inverted microscope (Carl zeiss microimaging, Inc, One zeiss drive, Thornwood, NY, USA). Cell survival was assessed using the MTT assay,17 while the lactate dehydrogenase (LDH) release was measured by enzyme-linked immunosorbent assay using a LDH assay kit (BioVision), as detailed by the manufacturer. Cell survival and LDH leakage were determined in triplicate in independent experiments using 6 wells per concentration.
Induction of apoptosis and necrosis by Y2O3 nanoparticles
The degree of cellular apoptosis and necrosis was assessed using annexin V-fluorescein isothiocyanate (FITC) and propidium iodide (PI), staining as outlined previously.18 Briefly, treated cells were harvested by trypsin, labeled with annexin V-FITC and PI (BD Biosciences), and subjected to flow cytometry (FACSCalibur™, BD Biosciences). At least, 10,000 cells were analyzed from each sample for annexin V+/PI-, annexin V+/PI+, and annexin V-/PI+ reactivity.
Western blotting
Cells were washed with cold phosphate buffered saline (PBS), collected by trypsinization, and centrifuged at 400× g for 10 minutes. After lysis using the CelLytic M Cell Lysis Reagent (Sigma-Aldrich), the supernatant was collected and the protein content was estimated in triplicate using the Bradford reagent with bovine serum albumin as a standard. Fifty μg of total protein per well was then subjected to electrophoresis and transferred to Hybond-C nitrocellulose membranes (Amersham™ Hybond, GE Healthcare Bio-Sciences Corporation) using standard conditions. Membranes were incubated overnight at 4°C with the appropriate primary antibody, washed extensively, and then incubated for 1 hour at room temperature with a horseradish peroxidase-labeled antirabbit before detection by Amersham ECL Western Blotting Detection Reagent (GE Healthcare Bio-Sciences Corporation). Immunoreactive signals were quantified by densitometry using Alpha Innotech software version 3.4.0.0 (Alpha Innotech Corporation, Santa Clara, CA, USA). Glyceraldehyde-3-phosphate dehydrogenase (GAPDH) immunoreactivity was used for normalization between samples.
Determination of ROS
The ROS levels were determined following the addition of 2,7-dichlorodihydrofluorescein diacetate (DCFH-DA), using the OxiSelect™ kit (Cell Bio Labs), as outlined by the manufacturer. This assay employs the cell-permeable fluorogenic probe 2,7-dichlorodihydrofluorescein diacetate (DCFH-DA) that is deacetylated by cellular esterases before undergoing ROS-dependent oxidation to the highly fluorescent 2′,7′-dichlorodihydrofluorescein (DCF).18
Evaluation of mitochondrial membrane potential
The extent of mitochondrial membrane damage was determined by measuring mitochondrial membrane potential (Δψm), using the JC 1 dye (Cell Technology), as detailed previously.18
DNA damage assessment with comet assay
DNA damage was determined quantitatively in the control and Y2O3 NP-treated cells (1 × 10⁵ cells/mL) using the CometAssay™ kit (Trevigen, Inc.) as outlined by the manufacturer. A total of 100 cells were scored for each Y2O3 NP concentration in duplicate on three different experiments. Images were analyzed using the Perceptive Comet IV assay software version 4.3 Lite, analysis system (Perceptive Instruments Ltd, Bury St Edmunds, Suffolk, UK). DNA damage was evaluated by tail moment, tail length, and tail intensity.19
Cytokinesis-blocked micronucleus assay
Exponentially growing cells were exposed for one cell cycle (34 hours) to Mitomycin C (0.5 or 1 μg/mL) (Sigma-Aldrich) at five different concentrations of Y2O3 NPs. After washing with PBS, cells were incubated in fresh medium containing serum (5% FBS) and 3 μg/mL cytochalasin B (Sigma-Aldrich) for an additional cell cycle (34 hours). After washing, cells were trypsinized, collected by centrifugation, and incubated with 0.4% KCl for 10 minutes at 22°C–23°C. Cells were then fixed in a 1:3 solution of acetic acid and ethanol before suspension in methanol containing 1% acetic acid. Cells were air-dried on clean glass slides overnight and then stained with acridine orange, (Sigma-Aldrich) (50 μg/mL) to differentially stain the nucleus and cytoplasm before determining the number of binucleated cells containing micronuclei per 2,000 binucleated cells.20,21
Statistical analysis
Data are presented as mean ± standard error of the mean (SEM). Dependent variables were analyzed by one-way analysis of variance using SigmaStat®, version 3.5, (Systat Software Inc., San Jose, CA, USA). A value of P<0.05 was considered significant.
Results
Nanoparticle characterization
The average size of individual particles as estimated from atomic force microscopy width measurements was 38.6±2.0 nm (Figure 1A). The transmission electron microscopy images demonstrated that the Y2O3 NPs were largely spherical/round in shape with a primary particle diameter of 41.6±4.0 nm (Figure 1B). The mean hydrodynamic diameter of the Y2O3 NPs as measured by dynamic light scattering was 123±25 nm (Figure 1C). Confirming the purity of the Y2O3 NP preparations, the XRD spectral analysis exhibited well-defined peaks which were located at 2θ =29.1, 33.9, 48.5, and 57.6. (Figure 1D).
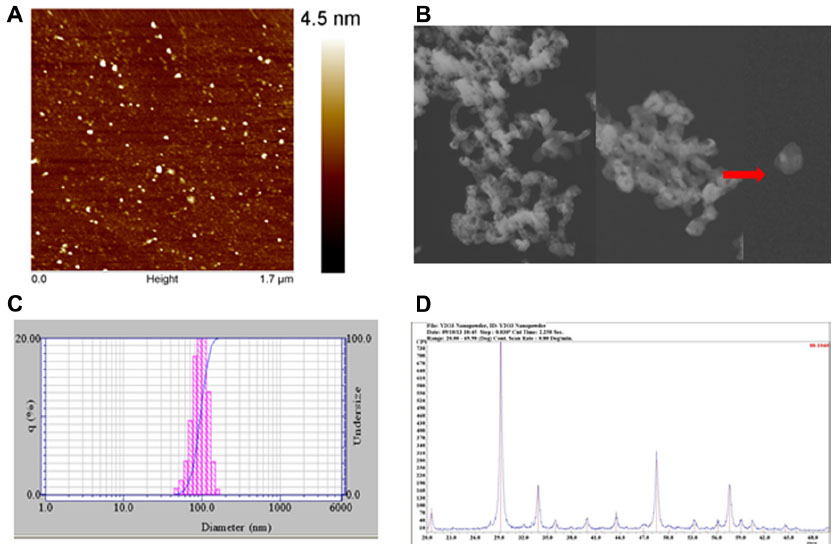 | Figure 1 The Y2O3 NPs size, shape and its composition were measured by AFM, TEM, DLS and XRD analysis. |
Y2O3 NPs exposure increases cellular ROS levels
The HEK293 cells were grown in the absence or presence of Y2O3 NPs, and ROS levels were quantified by measuring the enzymatic cleavage of DCFH-DA to DCF. Compared to that observed in the control cells, we found an increase in fluorescence intensity in cells treated with Y2O3 NPs concentrations ≥25 μg/mL at 24 hours (Figure 2A and 2B). Compared to untreated controls, paraquat increased cellular ROS levels at 24 hours and at 48 hours. The incubation of the Y2O3 NPs exposed cells with N-acetylcysteine (NAC) significantly reduced cellular ROS levels compared to that observed with exposure to Y2O3 NPs alone (Figure 2A and 2B).
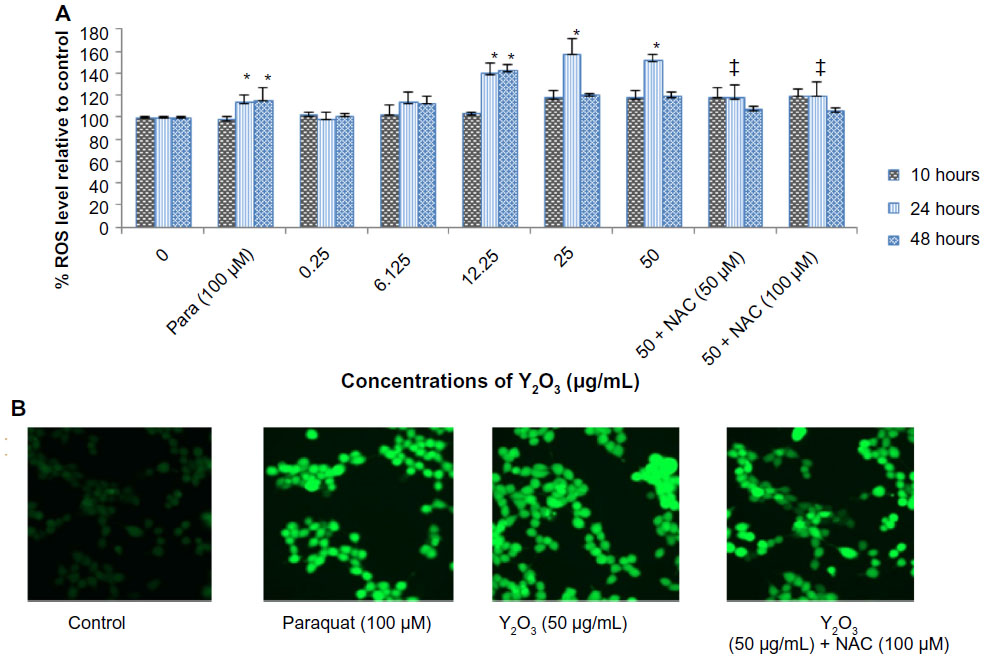 | Figure 2 Cellular ROS levels in response to incubation with Y2O3 NPS |
Cytotoxicity of Y2O3 NPs
The cytotoxicity of the Y2O3 NPs in the HEK cells was evaluated by IC50 determination, MTT assay measurement, measurement of LDH leakage, and an analysis of cellular morphology. Figure 3A shows the data of the MTT assay to determine the cytotoxicity dose (IC50 of Y2O3 NPs). The IC50 value for the Y2O3 NPs was found to be 108 μg/mL. Based on this IC50 value, the decision was made to vary the concentration of Y2O3 NPs from 0.25 to 50 μg/mL for further cytotoxicity studies. Compared to that observed in the control cells, the exposure to Y2O3 NPs was associated with cell clustering, cell rounding, reductions in cell size, and cell detachment from the substratum (Figure 3B). We repeated the MTT assay using similar time points and concentrations to those used to assess morphological change. The inhibition of cell survival by Y2O3 NPs was time and concentration dependent (Figure 3C). At 10 hours, only higher concentrations ≥6.125 μg decreased cell survival significantly (P<0.05); whereas, at 24 hours and at 48 hours of exposure, there were significant differences at all concentrations examined. We also found that cotreatment with NAC appeared to provide a protective effect against Y2O3 NPs at 24 hours and at 48 hours. As shown in Figure 3D, LDH leakage due to Y2O3 NPs was time and concentration dependent. Compared to untreated controls, paraquat showed significant changes in the MTT assay but not LDH leakage at each time point. Similar to our MTT analysis, we also found that a cotreatment with NAC appeared to provide a protective effect against Y2O3 NPs at 48 hours (P<0.05).
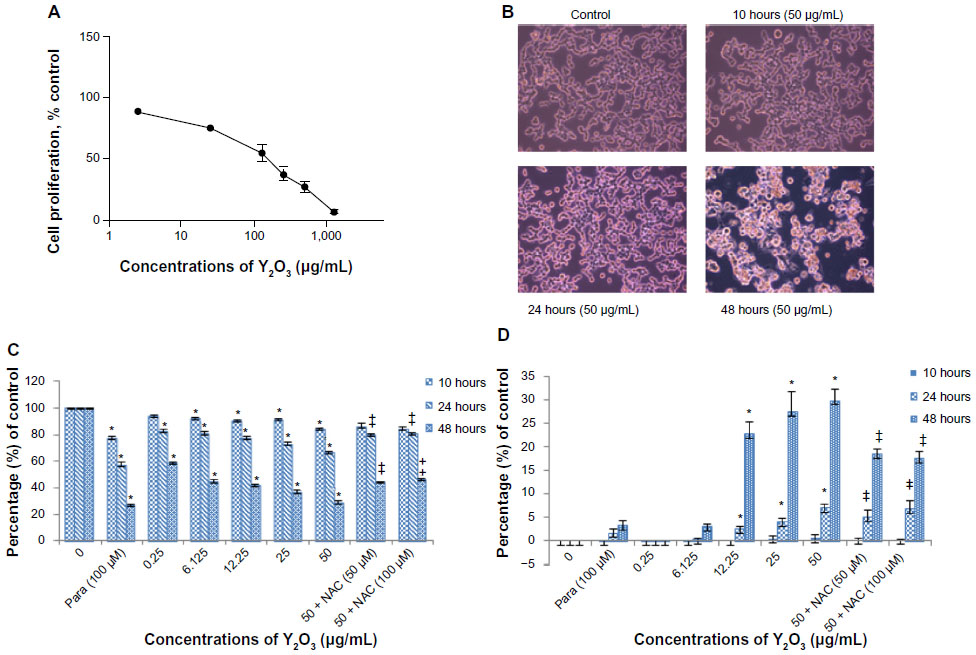 | Figure 3 Cytotoxicity of Y2O3 NPs to HEK293 cell line. |
Exposure to Y2O3 NPs causes cell death by apoptosis and necrosis
To investigate whether Y2O3 NPs induced apoptosis- or necrosis-mediated cell death, we used annexin V and PI double staining to detect cell membrane changes. Figure 4A shows representative flow cytograms of cells exposed for 48 hours. Concentrations of Y2O3 NPs ≥25 μg/mL revealed both early and late stages of apoptosis. Compared to untreated controls, exposure to paraquat increased early apoptosis at 24 hours and at 48 hours. Conversely, the addition of NAC (50 or 100 μM) during the Y2O3 NPs (50 μg/mL) exposure was associated with a decrease in the number of late apoptotic and necrotic cells (Figure 4D). This indicates that the NAC protects cells from both the apoptotic- and necrotic-mediated cell death induced by exposure to the Y2O3 NPs.
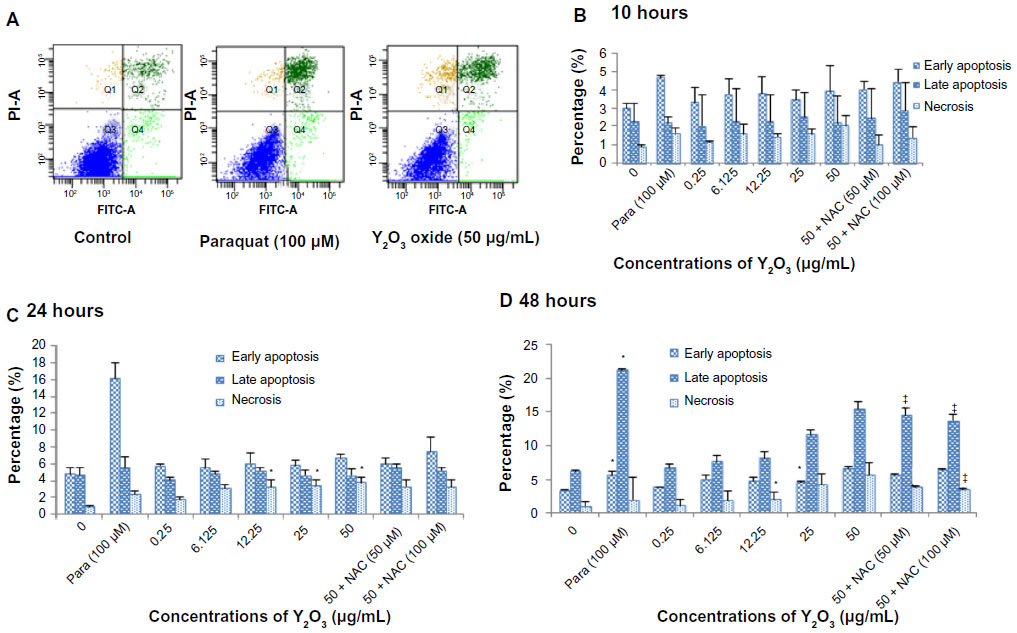 | Figure 4 The Y2O3 NPs induced cell death (apoptosis and necrosis) was measured by flow cytometry using annexin V/FITC and PI staining. |
Compared to the control cells, Y2O3 NPs exposure decreased Bcl-2 levels by 0.67±0.06 fold (0.25 μg/mL), 0.56±0.06 fold (12.25 μg/mL), and 0.044 fold (50 μg/mL), while the paraquat treatment decreased Bcl-2 levels by 0.4±0.08 fold (100 μM/mL) (Figure 5A). Consistent with these changes in Bcl-2, the Y2O3 NPs exposure was associated with an increase in the amount of caspase-3 and cleaved caspase-3 (19 kDa) (Figure 5B).
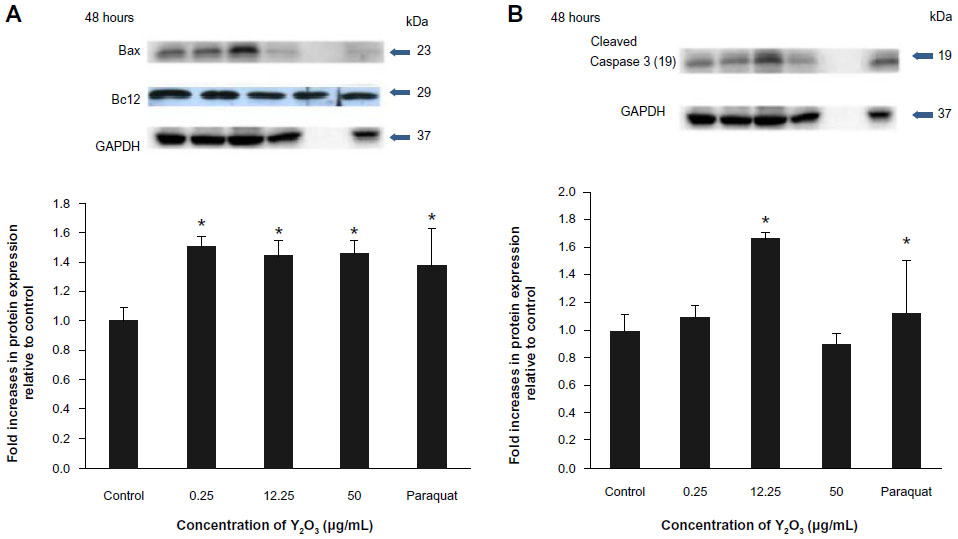 | Figure 5 Expression of apoptosis-associated regulatory proteins in HEK293 cultures. |
Exposure to Y2O3 NPs causes changes in Δψm
Figure 6A shows Δψm in control cells and cells incubated with Y2O3 NPs at various concentrations and time of exposure. We observed significant changes in Δψm in cells exposed to Y2O3 NPs at all three time points when the concentrations of Y2O3 NPs ranged between 6.125 to 50 μg/mL. Compared to untreated controls, the inclusion of paraquat decreased Δψm intensity at 24 and at 48 hours. Consistent with our MTT and LDH assays, the degree of Y2O3 NP-induced Δψm damage was significantly reduced at 24 hours of exposure when cells were coincubated with NAC (50 or 100 μM) (Figure 6A).
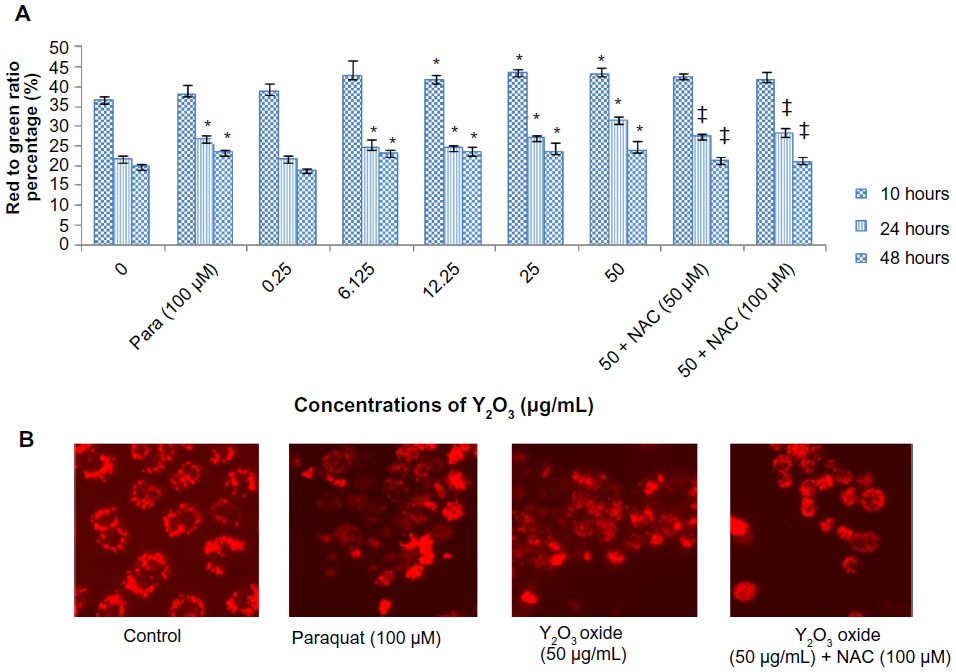 | Figure 6 Δψm damage was evaluated with HEK293 cell line using the fluorescent dye JC-1. |
Y2O3 NPs exposure associated with DNA damage and chromosomal instability
Compared to control cells, the Y2O3 NP-treated cells exhibited a breakdown in nuclear morphology (Figure 7A[b–d]). The degree of DNA damage appeared to increase with increasing concentration of exposure as assessed by the measurement of tail length (μm), tail movement (in arbitrary units), and tail intensity (%) (Figure 7C and D; P<0.05). Compared to that observed in the untreated controls, paraquat exposure increased DNA damage at 24 and 48 hours. Coincubation of the cells with 50 μM and 100 μM of the NAC that was contributed appeared to decrease the DNA damage with Y2O3 NPs exposure at 24 and 48 hours (Figure 7C and 7D).
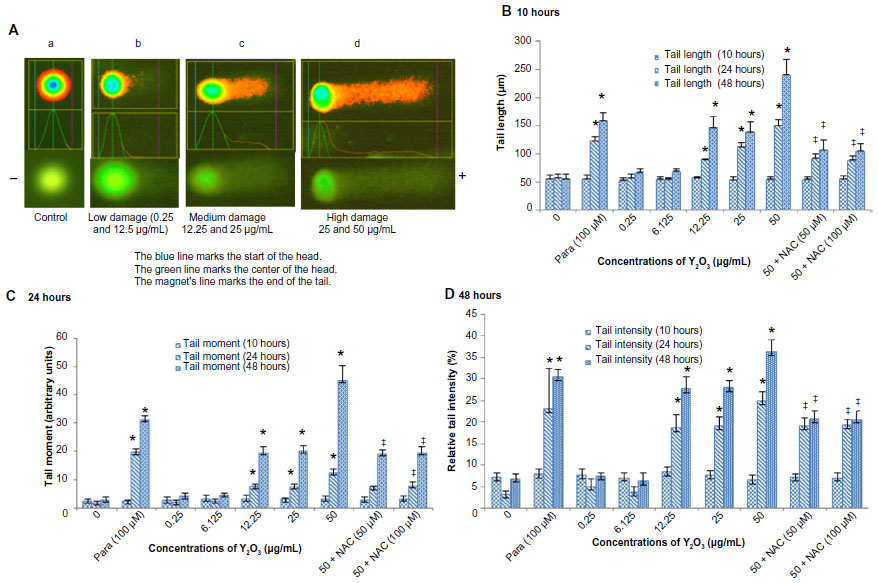 | Figure 7 Typical fluorescence microscopic image of comets after alkaline gel electrophoresis. |
The micronucleus assay results are presented as the frequency of micronucleation per 2,000 binucleated cells (Figure 8A). Compared with the control cells, micro nucleus frequency (MNF) formation was increased in the presence of 6.125 and 12.25 μg/mL Y2O3 NPs.
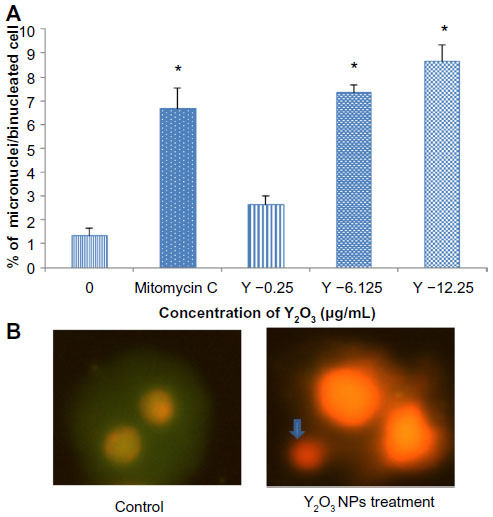 | Figure 8 Cytokinesis-blocked micronucleus formation during Y2O3 NPs-induced genotoxiciy. |
Discussion
It is well recognized that the toxicity of manufactured nanoparticles is heavily influenced by particle properties, such as mass, surface area, surface chemistry, state of aggregation or agglomeration, structure, size, and shape.22,23 It is thought that the particle size, shape, and chemical composition play major roles in determining the toxicity of nanoparticles.24 Our atomic force microscopy and transmission electron microscopy analysis indicated that the Y2O3 NPs appeared to be round in shape with an average size of 38.6±2.0 nm and 41.6±4.0 nm, respectively (Figure 1A and 1B).
Similarly, using XRD and a comparison with known standard Y2O3 spectra, we confirmed the purity of our Y2O3 NPs (Figure 1D). After confirming the physical and chemical composition of the Y2O3 NPs, we next examined if the determined exposure to Y2O3 NPs is associated with an increased cellular ROS, as suggested by previous work using human aortic endothelial cells25 and cell-free assays.10 Consistent with these data, we also found that the Y2O3 NPs exposure also causes an increased ROS production in the HEK293 cells (Figure 2).
To confirm this finding, we next investigated the effects of cotreating the cells with Y2O3 NPs and NAC. The NAC is a known antioxidant that has been found to scavenge ROS in a variety of different cell types in vivo and in vitro.26 As expected, we found that the cotreatment of the HEK293 cells with NAC significantly reduced the DCF-associated cellular fluorescence. The mechanism by which the Y2O3 NPs might increase cellular ROS levels is not yet understood, but it may result from exchange interactions between the unpaired electrons of free radicals and the conduction band electrons of the nanoparticles, similar to that seen with single-wall carbon nanotubes, semiconductor quantum dots, TiO2 nanoparticles, and cerium oxide nanoparticles.27–30
To examine the potential threshold for cellular toxicity, we next determined the cytotoxic dose 50 (IC50) by the MTT assay. Our IC50 value of 108 μg/mL was similar to that observed by Lanone et al, who also employed Y2O3 NPs that were spherical/round in shape.31 Once the IC50 was determined, we next repeated the MTT assays using a variety of different conditions (0.25–50 μg/mL) at 10 hours, 24 hours, and 48 hours to determine the relationship between the exposure level and cell survival. Similar to Andelman et al10, who treated the human foreskin fibroblast cells with platelet-shaped Y2O3 NPs (25–500 μg/mL), we found that exposure to the Y2O3 NPs was associated with increased cell death, as determined as the release of LDH into the media after 24 hours and after 48 hours.
To confirm these findings and to compare the potential toxicity of the Y2O3 NPs to a known toxicant, we performed parallel experiments using paraquat as a potential mediator of cell toxicity. Paraquat (N,N′-dimethyl-4,4′-bipyridinium dichloride) is a widely used herbicide that is toxic to kidney cells and functions to increase ROS levels in humans and animals through the inhibition of mitochondrial function.32–35 Like that observed with Y2O3 NPs, we found that the paraquat exposure induced a similar MTT response (Figure 3C). The mechanism of the paraquat and the Y2O3 NP cytotoxicity are similar but is not currently clear and will require further in-depth experimentation.
To investigate whether the increased cell death seen with the Y2O3 NPs exposure was due to increases in cellular ROS, additional experiments were performed where we incubated the HEK293 cells in the presence of Y2O3 NPs and NAC. Our data indicated that the inclusion of NAC attenuated the extent of cell death seen with exposure to Y2O3 NPs (Figure 3), suggesting that the elevations in ROS may play a role, at least in part, in causing cellular cytoxicity.
Recent reports have suggested that exposure to TiO2 and ZnO nanoparticles can cause apoptosis in cultured mouse epidermal JB636 and liver hepato cellular carcinoma cell line (HepG2) cells.37,38 To investigate whether the incubation of HEK293 cells with Y2O3 NPs was associated with cell apoptosis, we performed flow cytometry. Consistent with our MTT and LDH assays, we found that incubation with Y2O3 NPs was associated with the induction of cell apoptosis (at 24 hours) and necrosis (at 48 hours; Figure 4A–4D). Similar to our findings with the MTT assay, we also found that the coadministration of NAC to the cell media was associated with increased cell survival (Figure 3C). To confirm these data biochemically, we next examined how the incubation with Y2O3 NPs affected the ratio of Bcl-2 to Bax expression and caspase-3 fragmentation, given the role of these proteins in controlling the initiation and progression of the cellular apoptosis.35 As expected from our flow cytometry data, we found that the incubation with the Y2O3 NPs was associated with an increase in the ratio of Bax to Bcl-2 protein and caspase-3 fragmentation (Figure 5A and 5B). Interestingly, we failed to observe any elevations in the caspase-3 fragmentation when the cells were incubated with 50 μg/mL of Y2O3 NPs. The reasons for this finding are not entirely clear, but they are consistent with the possibility that the high concentrations of Y2O3 NPs cause cellular necrosis rather than cell apoptosis. Whether different oxide nanoparticles induce apoptosis using similar or different mechanism(s) is currently unclear.
It is thought that the mitochondria are major sites of ROS production in cells. In addition, it is well-known that the production of ROS usually precedes or accompanies the loss of Δψm.39 In addition to known toxicants, previous work has demonstrated that the exposure to the ZnO nanoparticles (14–20 μg/mL) causes Δψm damage and the induction of apoptosis in the HepG2 cells.36 Consistent with these data, we observed that the Y2O3 NPs exposure in the HEK293 cells was associated with elevations in mitochondria membrane potential (Figure 6). Taken together, these data suggest that mitochondrial dysregulation may be involved in the increased ROS production seen with Y2O3 NPs-induced cytotoxicity. To extend these findings, we next examined the Y2O3 NP-treated cells for the presence of DNA damage using the comet assay, which can be used to determine the existence of DNA-strand breaks. As expected from our cytometry analysis, we found that the exposure to Y2O3 NPs (12.25–50 μg/mL) was associated with DNA damage at 24 and 48 hours (Figure 7). Moreover, we also observed that the coincubation with NAC was protective. These data suggest that the oxidative stress likely functions as a mediator of the Y2O3 NPs-induced DNA damage. To examine if exposure to the Y2O3 NPs is associated with chromosomal damage, we next performed the cytokinesis-blocked micronucleus assay.40 Similar to previous work following the exposure of HepG2 and human bronchial epithelial cells to silver NPs,41 we found that the micronuclei formation was increased, following the cellular incubation with Y2O3 NPs (6.125 or 12.25 μg/mL).
Consistent with our findings with caspase-3, we failed to find any evidence of chromosomal damage at the higher concentrations of Y2O3 NPs treatment (25 and 50 μg/mL), which was likely due to the presence of the elevated levels of apoptotic- and necrosis-mediated cell death. To our knowledge, this is the first study to suggest quantitatively that the Y2O3 NPs treatment can cause DNA damage and chromosomal aberrations. The mechanism(s) underlying this increase in DNA damage is not clear and beyond the scope of this study. Nonetheless, it is thought that the elevations in the cellular ROS can result in the mutagenic structures, such as the 8-hydroxyadenine and the 8-hydroxyguanine, which can induce instability of repetitive sequences.42
Conclusion
A comprehensive evaluation of the Y2O3 NP cytotoxicity was performed using multiple methods. Exposure to the Y2O3 NPs-induced dose- and time-dependent cytotoxicity that was associated with diminished cell survivability, cellular necrosis, and an increase in cellular apoptosis. Cellular death appeared to be induced, at least in part, by changes in the Δψm and elevations in the cellular ROS levels. The formation of the DNA-strand breaks and micronuclei was consistent with the presence of DNA and chromosomal damage. Taken together, these data suggest that the Y2O3 NPs may be both cytotoxic and genotoxic, depending upon the magnitude of exposure. Additional studies to evaluate the effects of the Y2O3 NP exposure on other cell types and under different experimental conditions may be warranted.
Acknowledgment
This work was supported in part from US Department of Energy grant (DE-PS02-09ER-01 to ERB).
Disclosure
The authors report no conflicts of interest in this work.
References
Baalousha M, Stolpe B, Lead JR. Flow field-flow fractionation for the analysis and characterization of natural colloids and manufactured nanoparticles in environmental systems: a critical review. J Chromatogr A. 2011;1218(27):4078–4103. | |
AshaRani PV, Low Kah Mun G, Hande MP, Valiyaveettil S. Cytotoxicity and genotoxicity of silver nanoparticles in human cells. ACS Nano. 2009;3(2):279–290. | |
Schaeublin NM, Braydich-Stolle LK, Schrand AM, et al. Surface charge of gold nanoparticles mediates mechanism of toxicity. Nanoscale. 2011;3(2):410–420. | |
Yoo KC, Yoon CH, Kwon D, et al. Titanium dioxide induces apoptotic cell death through reactive oxygen species-mediated Fas upregulation and Bax activation. Int J Nanomedicine. 2012;7:1203–1214. | |
Kirchner C, Liedl T, Kudera S, et al. Cytotoxicity of colloidal CdSe and CdSe/ZnS nanoparticles. Nano Lett. 2005;5(2):331–338. | |
Xia T, Kovochich M, Brant J, et al. Comparison of the abilities of ambient and manufactured nanoparticles to induce cellular toxicity according to an oxidative stress paradigm. Nano Lett. 2006;6(8):1794–1807. | |
Markovic Z, Trajkovic V. Biomedical potential of the reactive oxygen species generation and quenching by fullerenes (C60). Biomaterials. 2008;29(26):3561–3573. | |
Lin W, Huang YW, Zhou XD, Ma Y. Toxicity of cerium oxide nanoparticles in human lung cancer cells. Int J Toxicol. 2006;25(6):451–457. | |
Verma A, Uzun O, Hu Y, et al. Surface-structure-regulated cell-membrane penetration by monolayer-protected nanoparticles. Nat Mater. 2008;7(7):588–595. | |
Andelman T, Gordonov S, Busto G, Moghe PV, Riman RE. Synthesis and Cytotoxicity of Y(2)O(3) Nanoparticles of Various Morphologies. Nanoscale Res Let. 2009;5(2):263–273. | |
Xu C. Synthesis of Nanometer-sized Yttrium oxide Particles in Diisooctyl Sodium Sulphosuccinate(AOT)/Isooctane Reverse Micelle Solution. Blacksburg: Virginia Polytechnic Institute; 1999;1–84. | |
Chou CC, Riviere JE, Monteiro-Riviere NA. The cytotoxicity of jet fuel aromatic hydrocarbons and dose-related interleukin-8 release from human epidermal keratinocytes. Arch Toxicol. 2003;77(7):384–391. | |
Dua P, Chaudhari KN, Lee CH, et al. Evaluation of toxicity and gene expression changes triggered by oxide nanoparticles. Bull Korean Chem Soc. 2011;32(6):2051–2057. | |
Guan R, Kang T, Lu F, Zhang Z, Shen H, Liu M. Cytotoxicity, oxidative stress, and genotoxicity in human hepatocyte and embryonic kidney cells exposed to ZnO nanoparticles. Nanoscale Res Lett. 2012; 7(1):602. | |
Meena R, Pal R, Pradhan SN, Rani M, Paulraj R. Comparative study of TiO2 and TiSiO4 nanoparticles induced oxidative stress and apoptosis of HEK-293 cells. Adv Mat Lett. 2012;3(6):459–465. | |
Hudecová A, Kusznierewicz B, Rundén-Pran E, et al. Silver nanoparticles induce premutagenic DNA oxidation that can be prevented by phytochemicals from Gentiana asclepiadea. Mutagenesis. 2012;27(6):759–769. | |
Mosmann T. Rapid colorimetric assay for cellular growth and survival: application to proliferation and cytotoxicity assays. J Immunol Methods. 1983;65(1–2):55–63. | |
Selvaraj V, Armistead MY, Cohenford M, Murray E. Arsenic trioxide (As(2)O(3)) induces apoptosis and necrosis mediated cell death through mitochondrial membrane potential damage and elevated production of reactive oxygen species in PLHC-1 fish cell line. Chemosphere. 2013;90(3):1201–1209. | |
Hande MP, Boei JJ, Natarajan AY. Induction and persistence of cytogenetic damage in mouse splenocytes following whole-body X-irradiation analyzed by fluorescence in situ hybridization. II. Micronuclei. Int J Radiat Biol. 1996;70(4):375–383. | |
Fenech M, Morley A. Solution to the kinetic problem in micronucleus assay. Cytobios. 1985;43(172–173):233–246. | |
Surrallés J, Xamena N, Creus A, Catalán J, Norppa H, Marcos R. Induction of micronuclei by five pyrethroid insecticides in whole-blood and isolated human lymphocyte cultures. Mutat Res. 1995;341(3):169–184. | |
Handy RD, von der Kammer F, Lead JR, Hassellöv M, Owen R, Crane M. The ecotoxicology and chemistry of manufactured nanoparticles. Ecotoxicology. 2008;17(4):287–314. | |
Hassellöv M, Kaegi R. Analysis and characterization of manufactured nanoparticles in aquatic environments. In: Lead JR, Smith E, editors. Environmental and Human Health Effects of Nanoparticles. Chichester, UK: John Wiley & Sons; 2009:211–266. | |
Baalousha M, Ju-Nam Y, Cole PA, et al. Characterization of cerium oxide nanoparticles-part 1: size measurements. Environ Toxicol Chem. 2012;31(5):983–993. | |
Gojova A, Guo B, Kota RS, Rutledge JC, Kennedy IM, Barakat AI. Induction of inflammation in vascular endothelial cells by metal oxide nanoparticles: effect of particle composition. Environ Health Perspect. 2007;115(3):403–409. | |
Sun SY. N-acetylcysteine, reactive oxygen species and beyond. Cancer Biol Ther. 2010;9(2):109–110. | |
Li Z, Hulderman T, Salmen R, et al. Cardiovascular effects of pulmonary exposure to single-wall carbon nanotubes. Environ Health Perspect. 2007;115(3):377–382. | |
Chan WH, Shiao NH, Lu PZ. CdSe quantum dots induce apoptosis in human neuroblastoma cells via mitochondrial-dependent pathways and inhibition of survival signals. Toxicol Lett. 2006;167(3):191–200. | |
Long TC, Saleh N, Tilton RD, Lowry GV, Veronesi B. Titanium dioxide (P25) produces reactive oxygen species in immortalized brain microglia (BV2): implications for nanoparticle neurotoxicity. Environ Sci Technol. 2006;40(14):4346–4352. | |
Park EJ, Choi J, Park YK, Park K. Oxidative stress induced by cerium oxide nanoparticles in cultured BEAS-2B cells. Toxicology. 2008;245(1–2):90–100. | |
Lanone S, Rogerieux F, Geys J, et al. Comparative toxicity of 24 manufactured nanoparticles in human alveolar epithelial and macrophage cell lines. Part Fibre Toxicol. 2009;6:14. | |
Fukushima T, Tanaka K, Lim H, Moriyama M. Mechanism of cytotoxicity of paraquat. Environ Health Prev Med. 2002;7(3):89–94. | |
Takeyama N, Tanaka T, Yabuki T, Nakatani T. The involvement of p53 in paraquat-induced apoptosis in human lung epithelial-like cells. Int J Toxicol. 2004;23(1):33–40. | |
Yang W, Tiffany-Castiglioni E. Paraquat-induced apoptosis in human neuroblastoma SH-SY5Y cells: involvement of p53 and mitochondria. J Toxicol Environ Health A. 2008;71(4):289–299. | |
Yu Q, Wang T, Zhou X, et al. Wld(S) reduces paraquat-induced cytotoxicity via SIRT1 in non-neuronal cells by attenuating the depletion of NAD. PLoS ONE. 2011;6(7):e21770. | |
Zhao J, Bowman L, Zhang X, et al. Titanium dioxide (TiO2) nanoparticles induce JB6 cell apoptosis through activation of the caspase-8/Bid and mitochondrial pathways. J Toxicol Environ Health A. 2009;72(19):1141–1149. | |
Sharma V, Anderson D, Dhawan A. Zinc oxide nanoparticles induce oxidative DNA damage and ROS-triggered mitochondria mediated apoptosis in human liver cells (HepG2). Apoptosis. 2012;17(8):852–870. | |
Shukla RK, Kumar A, Gurbani D, Pandey AK, Singh S, Dhawan A. TiO(2) nanoparticles induce oxidative DNA damage and apoptosis in human liver cells. Nanotoxicology. 2013;7(1):48–60. | |
Cha Y, Park DW, Lee CH, et al. Arsenic trioxide induces apoptosis in human colorectal adenocarcinoma HT-29 cells through ROS. Cancer Res Treat. 2006;38(1):54–60. | |
Fenech M. Cytokinesis-block micronucleus assay evolves into a “cytome” assay of chromosomal instability, mitotic dysfunction and cell death. Mutat Res. 2006;600(1–2):58–66. | |
Kim HR, Kim MJ, Lee SY, Oh SM, Chung KH. Genotoxic effects of silver nanoparticles stimulated by oxidative stress in human normal bronchial epithelial (BEAS-2B) cells. Mutat Res. 2011;726(2):129–135. | |
Cadet J, Delatour, Douki T, et al. Hydroxyl radicals and DNA base damage. Mutat Res. 1999;424(1–2):9–21. |
Supplementary materials
Methods
Cell culture and toxicity studies
Briefly, cells were propagated to 80% confluence in 24-well plates. The culture medium was replaced with the fresh medium, containing different doses of Y2O3 NPs (0–1,200 μg/mL) and incubated for 24 hours. The MTT reagent (50 μL) was dissolved in the culture media without serum, and the plates were incubated for 4 hours at 30°C in the dark. After removal of the surpernatant and the addition of dimethyl sulfoxided (500 μL), 150 μL of fluid from each well was transferred into a 96-well microplate. The optical density was measured at 580 nm with a microplate reader, model ELx808 (BioTek Instrument, Inc., Winooski, VT, USA). The percentage of surviving cells was determined in triplicate in three different independent experiments using 6 wells per concentration. Nonlinear regression analysis using GraphPad Prism® software (GraphPad Software, Inc., La Jolla, CA, USA) was used to determine the IC50 values.
Determination of ROS
Briefly, the HEK cells were grown in 24-well plates. After the treatment period, the cells were washed with cold PBS and incubated in serum-free medium with 100 μL of 1× DCFH-DA reagent and incubated at 37°C for 1 hour. Following this incubation period, cells were washed twice with Dulbecco’s Phosphate-Buffered Saline, and the assay was terminated by adding 100 μL of the 2× cell lysis buffer. The fluorescence of each cell suspension was measured with a fluorometric plate reader (SpectraMax® Gemini EM™ Microplate Reader, Molecular Devices, Sunnyvale, CA, USA) at 480 nm/530 nm. Observation of the dye uptake was determined with fluorescent microscopy using a EVOS® FL Cell Imaging System (Thermo Fisher Scientific, Pittsburgh, PA, USA)
Evaluation of Δψm
The experimentally treated cells were washed with cold PBS, removed with trypsin, and centrifuged at 400× g for 10 minutes. The resulting pellets were then resuspended in PBS, and the cell density was adjusted to 1 × 10⁵ cells/mL. Aliquots (200 μL each) were then centrifuged at 400× g for 5 minutes, and the resulting cell pellets were assayed for mitochondrial membrane damage. In the absence of mitochondrial damage, the JC-1 dye accumulates in the organelle and fluoresces red. Conversely, an inability of the mitochondria to concentrate the JC-1 dye results in the accumulation of the dye in the cytoplasm and a green fluorescence. Overall fluorescence was measured with a fluorometric plate reader (SpectraMax® Gemini EM™ Microplate Reader, Molecular Devices) at 535 nm and 600 nm for green and red fluorescence, respectively. The observation of the dye uptake by the mitochondria was determined following imaging under fluorescence (EVOS fl model, Thermo Fisher Scientific).
DNA damage by comet assay
The cells were combined with molten, low-melting agarose at 37°C at a ratio of 1:10 volume/volume, and 75 μL was placed on a Comet slide(Trevigen Inc.). Slides were then incubated at 4°C for 30 minutes before being immersed in prechilled lysis solution on ice for 1 hour. The excess buffer from the slides was removed, and the slides were immersed in an alkaline solution (49.75 mL of 0.3 M NaOH and 250 μL of 200 mM ethylenediaminetetraacetic acid (EDTA), pH >13) for 1 hour. The slides were washed twice for 5 minutes with 1× Tris-borate-EDTA electrophoresis buffer (89 mM Tris base, 89 mM boric acid, and 2 mM EDTA) and electrophoresed using 1× Tris-borate-ethylenediaminetetraacetic acid buffer in a horizontal gel apparatus at 1 V/cm (22 V) for 10 minutes. Slides were dehydrated using 70% ethanol for 5 minutes and then air-dried overnight before staining with SYBR® Green (Life Technologies, Carlsbad, CA, USA). The slides were examined at 200× magnification using a fluorescence microscope (BX51, Olympus) connected to the Leica HD digital microscope camera Model T370B (Leica, 1700 Leider Lane, Buffalo Grove, IL, USA).
 © 2014 The Author(s). This work is published and licensed by Dove Medical Press Limited. The full terms of this license are available at https://www.dovepress.com/terms.php and incorporate the Creative Commons Attribution - Non Commercial (unported, v3.0) License.
By accessing the work you hereby accept the Terms. Non-commercial uses of the work are permitted without any further permission from Dove Medical Press Limited, provided the work is properly attributed. For permission for commercial use of this work, please see paragraphs 4.2 and 5 of our Terms.
© 2014 The Author(s). This work is published and licensed by Dove Medical Press Limited. The full terms of this license are available at https://www.dovepress.com/terms.php and incorporate the Creative Commons Attribution - Non Commercial (unported, v3.0) License.
By accessing the work you hereby accept the Terms. Non-commercial uses of the work are permitted without any further permission from Dove Medical Press Limited, provided the work is properly attributed. For permission for commercial use of this work, please see paragraphs 4.2 and 5 of our Terms.