")
Back to Journals » International Journal of Nanomedicine » Volume 10 » Issue 1
Cu2+-RGDFRGDS: exploring the mechanism and high efficacy of the nanoparticle in antithrombotic therapy
Authors Wu J , Wang Y, Wang Y , Zhao M, Zhang X, Gui L, Zhao S, Zhu H , Zhao J, Peng S
Received 30 October 2014
Accepted for publication 19 January 2015
Published 15 April 2015 Volume 2015:10(1) Pages 2925—2938
DOI https://doi.org/10.2147/IJN.S76691
Checked for plagiarism Yes
Review by Single anonymous peer review
Peer reviewer comments 4
Editor who approved publication: Professor Lei Yang
Jianhui Wu,1 Yuji Wang,1 Yaonan Wang,1 Ming Zhao,1,2 Xiaoyi Zhang,1 Lin Gui,1 Shurui Zhao,1 Haimei Zhu,1 Jinghua Zhao,1 Shiqi Peng1
1Beijing Area Major Laboratory of Peptide and Small Molecular Drugs, Engineering Research Center of Endogenous Prophylactic of Ministry of Education of China, Beijing Laboratory of Biomedical Materials, College of Pharmaceutical Sciences, Capital Medical University, Beijing, People’s Republic of China; 2Faculty of Biomedical Science and Environmental Biology, Kaohsiung Medical University, Kaohsiung, Taiwan
Abstract: Thrombosis disease has been the leading cause of morbidity and mortality worldwide. In the discovery of antithrombotic agents, three complexes of Cu2+ and repetitive arginine-glycine-aspartic acid (RGD) sequences, Cu(II)-Arg-Gly-Asp-Ser-Arg-Gly-Asp-Ser (Cu[II]-4a), Cu(II)-Arg-Gly-Asp-Val-Arg-Gly-Asp-Val (Cu[II]-4b), and Cu(II)-Arg-Gly-Asp-Phe-Arg-Gly-Asp-Phe (Cu[II]-4c), were previously reported, of which Cu(II)-4a and Cu(II)-4c possessed the highest in vitro and in vivo activity, respectively. Transmission electron microscopy (TEM) images visualized that Cu(II)-4a and Cu(II)-4c formed nanoaggregates and nanoparticles, respectively. However, the details of the formation of the nanospecies complexes and of the mechanism for inhibiting thrombosis remain to be clarified. For this purpose, this study designed a novel complex of Cu(II) and the RGD octapeptide, Arg-Gly-Asp-Phe-Arg-Gly-Asp-Ser (RGDFRGDS), consisting of Arg-Gly-Asp-Phe of Cu(II)-4c and Arg-Gly-Asp-Ser of Cu(II)-4a, to colligate their biological and nanostructural benefits. In contrast with Cu(II)-4a, -4b, and -4c, Cu(II)-RGDFRGDS (Cu2+-FS) had high antiplatelet and antithrombotic activities, with the formed nanoparticles having a porous surface. Additionally, this paper evidenced the dimer had the basic structural unit of Cu2+-FS in water, theoretically simulated the formation of Cu2+-FS nanoparticles, and identified that Cu2+-FS activity in decreasing glycoprotein IIb/IIIa, P-selectin, and IL-8 was responsible for the antithrombotic action. Finally, adherence onto the surface and entry into the cytoplasm were considered the steps of a two-step model for the blocking of platelet activation by Cu2+-FS nanoparticles. Findings indicated that the antiplatelet aggregation activity of Cu2+-FS was 10–52 times higher than that of RGDFRGDS, while the effective dose for antithrombotic action was 5,000 times lower than that of RGDFRGDS.
Keywords: GPIIb/IIIa, IL-8, TEM, AFM, SEM, nanomedicine
Introduction
Integrins play a vital role in the growth and survival of nucleated cells.1,2 Ligands bind integrin to mediate the formation and remodeling of focal adhesions. Focal adhesions then change the cellular shape and tissue organization.3 Integrins can interact particularly well with a series of ligands. Arginine-glycine-aspartic acid (RGD) peptides are the most common integrin binding ligands.4 Fibrinogen plays a critical role in the aggregation of platelet through the cross-linking with integrins. Two RGD sequence peptides are located in each of the two fibrinogen A alpha chains – arginine-glycine-aspartic acid-phenylalanine (RGDF) is present at fibrinogen Aα 95-98, and the sequence arginine-glycine-aspartic acid-serine (RGDS) exists at the fibrinogen Aα 572-575 domain. RGD sequences can bind integrins αυβ3 and αυβ5,5–7 and synthetic RGD peptide has been widely applied to treat pulmonary embolism and deep vein thrombosis8 to decrease thrombosis risk, to improve the blood compatibility of implanted materials,9 and to assist leptospiral immunoglobulin-like proteins in regulating thrombosis and fibrinolysis.10
Cu2+ ion, an essential mineral nutrient, has a positive redox potential and can participate in biological transport reactions.11 Cu2+ complexes possess a wide range of biological activities, such as antitumor, antiviral, and anti-inflammatory activities.12 Cu2+ complexes are potential therapeutics in coronary heart disease due to their ability to increase superoxide dismutase (SOD) activity and relax oxidative stress.13 The investigations of complexes of Cu2+ and peptide have been correlated with nanoscale self-assembly, bioactivity, and with positron emission tomography (PET) images of arterial thrombosis.14–21 Recently, three Cu(II)-complexes, Cu(II)-Arg-Gly-Asp-Ser-Arg-Gly-Asp-Ser (Cu(II)-4a), Cu(II)-Arg-Gly-Asp-Val-Arg-Gly-Asp-Val (Cu(II)-4b), and Cu(II)-Arg-Gly-Asp-Phe-Arg-Gly-Asp-Phe (Cu(II)-4c), were synthesized,22 consisting of octapeptides with two repeated RGD-peptides; among the three, it was revealed that Cu(II)-4a and Cu(II)-4c possessed the highest in vitro and in vivo activities, respectively. Besides Cu(II)-4c can form nanoparticles. Thus we hypothesized that the complex of Cu(II) and the octapeptide consisting of Arg-Gly-Asp-Phe (RGDF) of Cu(II)-4c and Arg-Gly-Asp-Ser (RGDS) of Cu(II)-4a (Arg-Gly-Asp-Phe-Arg-Gly-Asp-Ser [RGDFRGDS]), ie, Cu(II)-RGDFRGDS (Cu2+-FS) should have the benefits of Cu(II)-4a and Cu(II)-4c. We aimed to show this and to show details of the formation of the Cu(II)–RGD octapeptide complex nanoparticles, and their activity in thrombotic therapy. We also aimed to visualize the interaction model of the nanoparticles with activated platelets.
Materials and methods
General procedures
The protected L-amino acids and all reagents were available commercially (Sigma-Aldrich Corp, St Louis MO, USA). Anhydrous solvents were dried and purified by standard methods prior to use. Column chromatography was performed on silica gel of 200–300 mesh. The purity of the intermediates and the products was measured with thin-layer chromatography (TLC) and high-performance liquid chromatography (HPLC) (C18 column 4.6×150 mm; Waters Corporation, Milford, MA, USA), and was greater than 97%. Reactions were monitored by TLC on glass plates coated with silica gel with a fluorescent indicator. Melting points were determined on a XT5 hot stage apparatus (Beijing Keyi Electro-Optic Factory, Beijing, People’s Republic of China) and were uncorrected. Proton nuclear magnetic resonance (1HNMR) (300 MHz) and 13C nuclear magnetic resonance (13CNMR) (75 MHz) spectra were recorded in dimethyl sulfoxide (DMSO)-d6 or CDCl3, and with tetramethylsilane as the internal standard. Electrospray ionization (ESI) mass spectrometry (MS) (ESI-MS) was measured on a ZQ 2000 (Waters Corp) and a 9.4 T solariX Fourier transform (FT) ion cyclotron resonance (ICR) (FT-ICR) mass spectrometer (Bruker Corp, Billerica, MA, USA), with an ESI/matrix-assisted laser desorption/ionization (MALDI) dual ion source.
Preparing Cu2+-FS
The complexation of RGDFRGDS and CuCl2⋅2H2O provided Cu2+-FS (Figure 1). Firstly, octapeptide RGDFRGDS was synthesized using the solution-phase method. Three protective dipeptides Boc-Arg(NO2)-Gly (94% total yield), HCl⋅Asp(OCH3)-Ser-OBzl (96% total yield), and HCl⋅Asp(OCH3)-Phe-OBzl (99% total yield) were prepared as the starting material to prepare the corresponding tetrapeptides Boc-Arg(Tos)-Gly-Asp(OCH3)-Phe (88% yield) and HCl⋅Arg(Tos)-Gly-Asp(OCH3)-Ser-OBzl (97% yield). Coupling the tetrapeptides yielded octapeptide Boc-Arg(Tos)-Gly-Asp(OCH3)-Phe-Arg(Tos)-Gly-Asp(OCH3)-Ser-OBzl (90% yield). After removing all protective groups, RGDFRGDS was obtained in 90% yield. Finally, the complex Cu2+-FS was formed (in 24% yield) through the complexation of CuCl2·2H2O and RGDFRGDS.
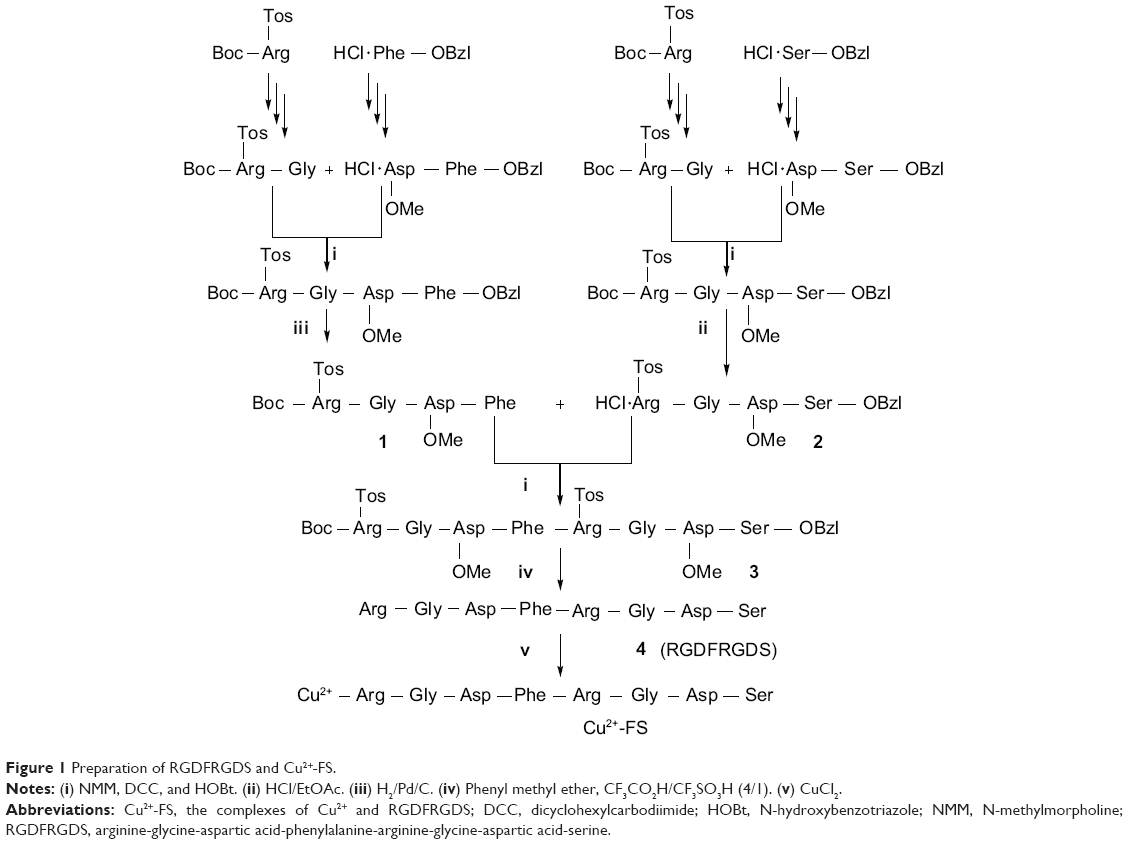 | Figure 1 Preparation of RGDFRGDS and Cu2+-FS. |
Characterization
Measuring ultraviolet visible (UV/Vis) and circular dichroism (CD) spectra
The UV/Vis spectra over 220–760 nm of wavelength, and the CD spectra over 190–760 nm of wavelength were recorded for the aqueous solutions of RGDFRGDS (1 mg/mL, 25°C) and Cu2+-FS (1 mg/mL, 25°C), on a UV-Vis absorption spectrophotometer (UV-2550; Shimadzu Corp, Kyoto, Japan) and on a spectropolarimeter using the JASCO Canvas Program (J-810; JASCO Corp, Tokyo, Japan), respectively.
Measuring particle size and zeta potential of Cu2+-FS in normal saline (NS)
To characterize Cu2+-FS in solution, the particle size of Cu2+-FS in NS (1 mg/mL) was determined on a particle size analyzer (Nano-ZS90; Malvern Instruments Ltd, Malvern, UK), and the zeta potential of Cu2+-FS in NS (1 mg/mL) was measured using a Zeta Potential Plus Analyzer (Brookhaven Instruments Corp, Holtsville, NY, USA). The particle size was measured at 25°C, at 27 minutes, 24 hours, and 10 days, and the zeta potential was measured at 10 days.
Measuring FT-MS spectra
Mass spectra were recorded on a Bruker 9.4T solariX FT-ICR mass spectrometer equipped with an ESI/MALDI dual ion source in positive ion mode. Three replicate measurements were performed for each sample. Data were acquired using the solariX control software. Spectral data were processed using the Bruker Daltonics data analysis software (Bruker Corp).
Mesoscale simulation and nanostructure prediction
The structure of RGDFRGDS was sketched using ChemDraw Ultra 10.0 (PerkinElmer Inc., Waltham, MA, USA) and transformed into three-dimensional (3D) structure with Materials Studio® 3.2 (Accelrys, Inc., San Diego, CA, USA). Cu2+ was placed inside RGDFRGDS, and the entire structure was further optimized using the Materials Studio Forcite module. The prepared model of Cu2+-FS was first geometry optimized until the convergence of maximum energy and maximum force changes, to 2×e−5 kcal/mol and 0.001 kcal/mol/Å, respectively, and then molecular dynamic simulation was performed at 500 K using the NVT ensemble until equilibration. The final structure was further optimized with Material Studio Dmol3 module. A rigid coarse grain model of Cu2+-FS was built as five connected spherical beads, based on the Dmol3 optimized structure. In a cubic box of 12×12×12 Å, the coarse grain model of Cu2+-FS was randomly distributed with a density of 0.05 g/cm3. A 2,500 ps simulation was performed on this system at 298 K using the NVT ensemble.
Transmission electron microscopy (TEM) measurements
A solution of Cu2+-FS at pH 7.4 was dropped onto a Formvar-coated copper grid, and then a drop of anhydrous ethanol was added to promote water removal; then the whole copper grid was left to dry in air and heated at 35°C for 24 hours prior to measurement. A portion of the solution was successively dropped onto three Formvar-coated copper grids to ensure the reproducibility of the analysis of the morphology and particle size distribution of the nanospecies. The morphology and particle size distribution of the nanospecies of Cu2+-FS were obtained over 100 species, in randomly selected regions on the copper grid, by TEM (JSM-6360 LV; JEOL Ltd, Tokyo, Japan) at accelerating voltage of 80 kV, and each microscopy experiment was repeated three times. The TEM images were obtained on an imaging plate with 20 eV energy windows at 6,000–400,000× and were digitally enlarged.
Atomic force microscopy (AFM) measurements
The contact mode AFM test was carried out using a Nanoscope 3D AFM (Veeco Instruments Ltd, Plainview, NY, USA) to visualize the 3D morphological characteristic of Cu2+-FS in blood. The images of rat plasma alone (negative control), Cu2+-FS in rat plasma (10−2 μM, pH 7.4), and Cu2+-FS in aqueous solution (positive control) (10−2 μM, pH 7.4) were recorded.
Scanning electron microscopy (SEM) of platelets treated with Cu2+-FS
Rat blood was collected in centrifuge tubes containing 3.8% sodium citrate (1:9). Platelet-rich plasma (PRP) was separated with centrifugation, at 221 g, for 15 minutes. Arachidonic acid (AA) (final concentration 15 μM) and 10 μL of Cu2+-FS (final concentration 200 nM) were added to PRP (500 μL). The resulting system was incubated for 5 minutes at 37°C and centrifuged for 15 minutes at 1,811 g to allow platelets to precipitate. The precipitated pellet was then immersed in glutaraldehyde (3%) for 1 hour. Glutaraldehyde was separated by using centrifugation, while the supernatant was discarded. The precipitants were washed three times with phosphate-buffered saline (PBS) and postfixed in 1% osmium tetroxide, on ice for 1 hour. Then, the sample was centrifuged again and treated twice with 50% ethanol for 10 minutes. The sample was dehydrated in a graded series of ethanol (70%, 80%, 90%, and 100%) and incubated for 10 minutes. Finally, the sample was dried using a critical point dryer (CPD300; Leica Microsystems, Wetzlar, Germany), mounted on an aluminum stub, coated with platinum by the JFC-1600 Auto Fine Coater (JEOL Ltd), and imagined on an SEM (S-4800; Hitachi Ltd., Tokyo, Japan).
Glycoprotein (GP)IIb/IIIa expression assay
The enzyme immunoassay was used to measure the GPIIb/IIIa levels of the platelets in citrated rat blood samples according to the manufacturer’s instructions (Rat Platelet Membrane Glycoprotein ELISA Kit; Rapid Bio Tests Corp, USA). PRP was prepared as described above. The diluent solution (5,400 μL, from the kit) was added to PRP (600 μL) to give the PRP sample. Cu2+-FS (final concentration, 0.1, 1, 10, and 100 nM) was added to 960 μL of the PRP sample, and the mixture was incubated at 37°C for 5 minutes prior to the addition of AA in NS (20 μL, 0.15 mg/mL). The system was incubated for 3 minutes at 37°C to form the test sample, ie, Cu2+-FS-treated PRP sample. NS (20 μL) was added to the PRP sample (960 μL), and the mixture was incubated for 5 minutes at 37°C, to which AA in NS (20 μL, 0.15 mg/mL) was added. The system was then incubated for another 3 minutes at 37°C to form an NS-treated PRP sample (blank control). The NS-treated PRP sample (50 μL) or the Cu2+-FS-treated PRP sample (50 μL) was added to the control well and the test well in the 96-well plate pre-coated with antibody specific for GPIIb/IIIa. The plate was incubated for 30 minutes at 37°C. Upon removal of the solution, the wells were washed five times with washing solution (from the kit). NS (50 μL) was added to the control well, and enzyme labeling solution (50 μL, from the kit) was added to the test well, and then the 96-well plate was incubated for 30 minutes at 37°C. Upon the removal of the solution, the wells were washed five times with washing solution (from the kit). Chromogen solution A (50 μL) and chromogen solution B (50 μL, from the kit) were successively added to each well, and the system was gently mixed, protected from light at 37°C for 15 minutes for coloration. The stop solution (50 μL, from the kit) was added to each well to stop the coloration. The optical density (OD) value at 450 nm was determined, and the GPIIb/IIIa level was calculated according to the standard samples (from the kit).23,24
P-selectin expression assay
Enzyme immunoassay was used to measure the P-selectin levels of activated platelets in citrated rat blood samples, according to the manufacturer’s instructions (Rat P-selectin ELISA Kit; Wuhan Huamei Biotech Co., Ltd., Wuhan, Hubei Province, People’s Republic of China). PRP was prepared as described above, and 10 mL of Cu2+-FS solution (5 nM) in NS was added to 980 mL of PRP sample, prior to the addition of AA (10 mL, 0.15 mg/mL). This solution was incubated for 3 minutes at 37°C to prepare the test sample, ie, Cu2+-FS-treated PRP sample. For the blank control sample (ie, NS-treated PRP sample), 10 mL of NS was added to 980 mL of PRP sample and incubated at 37°C for 5 minutes, after which 10 mL of AA in NS (0.15 mg/mL) was added, followed by incubation at 37°C for another 3 minutes. Next, 100 mL of NS-treated PRP sample and 100 mL of the Cu2+-FS-treated PRP sample were added into the control well and the test well of a 96-well plate precoated with antibody specific for p-selectin, respectively. The 96-well plate was incubated at 37°C for 120 minutes. Upon the removal of the solvent, 100 mL of biotin labeling antibody (from the kit) was added to each well. The plate was incubated at 37°C for 60 minutes. Upon removal of the solvent, the wells were washed three times with washing solution (from the kit). To each well, 100 mL of horseradish peroxidase–labeled avidin (from the kit) was added, and the plate was incubated at 37°C for 60 minutes. Upon the removal of the solvent, the wells were washed five times with washing solution (from the kit). Then, 90 mL of the substrate (from the kit) was added to each well, incubated at 37°C and protected from light for 20 minutes for coloration. Next, 50 mL of the stop solution (from the kit) was added to each well for 15 minutes to stop the coloration. At 450 nm, the OD value of each well was tested, and the P-selectin level was calculated according to the standard samples (from the kit).
In vitro platelet aggregation assay
Platelet aggregation in PRP was measured in a two-channel platelet aggregometer. The citrated pig blood was immediately centrifuged at 221 g for 15 minutes, and PRP was removed. The remaining blood was centrifuged at 1,811 g for another 10 minutes to prepare platelet-poor plasma (PPP). The PRP was diluted with PPP and counted to containing approximately 2×10⁸ platelets/mL. To an optical glass cuvette, NS (5 μL) or the solution of RGDFRGDS (5 μL, final concentrations ranging from 10 μM to 10 nM) or Cu2+-FS in NS (final concentrations ranging from 10 μM to 0.1 nM) was added to the diluted PRP solution (0.5 mL). After adjustment of the baseline, the solution of platelet-activating factor (PAF) in NS (5 μL, final concentration 0.1 μM), or the solution of adenosine diphosphate (ADP) in NS (5 μL, final concentration 10 μM), or the solution of AA in NS (5 μL, final concentration 350 μM), or the solution of thrombin (TH) in NS (50 μL, final concentration 0.1 IU/mL) was added, and aggregation was determined at 37°C for 5 minutes. The activities of RGDFRGDS and Cu2+-FS in inhibiting PAF- or ADP- or AA- or TH-induced platelet aggregation were evaluated. The peak height of the aggregation curve represented the maximal rate of platelet aggregation (Am%). The inhibition rate was calculated by the equation:
% Inhibition = (1 − [Am% of RGDFRGDS or Cu2+-FS/Am% of NS]) ×100%, | (1) |
where Am% of NS =51.08%±3.65%. The dose–response curve was plotted to determine the half maximal inhibitory concentration (IC50) values via the GW-BASIC program.25
Antithrombotic assay in a rat model
Here the assessments were based on a protocol reviewed and approved by the ethics committee of Capital Medical University. The committee assured that the welfare of the animals was maintained in accordance with the requirements of the Animal Welfare Act and according to the Guide for Care and Use of Laboratory Animals. Male Wistar rats (250–300 g) were purchased from the Animal Center of Peking University (Beijing, People’s Republic of China) for the study. The rats were anesthetized by intraperitoneal (IP) administration of 80.0 mg/kg pentobarbital sodium; then, the left jugular vein and the right carotid artery were separated, and polyethylene tubes were used to make shunts between the jugular vein and carotid artery. A weighed 6 cm nonabsorbable surgical thread of silk was put into the middle polyethylene tube. Before cannulating, the polyethylene tube was filled, with the solution of heparin sodium in NS (50 IU/mL) as anticoagulant. The ends of the polyethylene tube were inserted into the left jugular vein and right carotid artery, respectively. The solution of Cu2+-FS in NS, or NS alone, or the solution of RGDFRGDS in NS flowed from the right carotid artery to the left jugular vein via the polyethylene tube for 15 minutes. The surgical thread was taken out to record the increased thread weight as wet thrombus weight. The statistical analysis of the data was done using an analysis of variance (ANOVA) statistical test with a statistical significance level of P-value less than 0.05 (P<0.05).
In vivo IL-8 measurement
After the thrombotic study, 9 mL of fresh blood, from the carotid artery of the anesthetized rats, was collected into centrifuge tubes containing 1 mL of 3.8% sodium citrate. Blood samples were centrifuged (1,811 g, 30 minutes, 2°C–8°C) immediately to prepare plasma samples. IL-8 levels in the blood were measured by enzyme-linked immunosorbant assay (ELISA) assay according to the instruction of the IL-8 ELISA kit. The absorbance at 450 nm of wavelength was measured with a SpectraMax 190 Absorbance Microplate Reader, and the concentration of IL-8 in culture was determined using the IL-8 standard curve. Data were expressed as mean ± standard deviation (SD) ng/mL. The statistical analysis of the data was done using an ANOVA statistical test, with a statistical significance level of P-value less than 0.05 (P<0.05).
Results
The complexation model of Cu2+ and FS
To know the formation of Cu2+-FS, the UV-Vis, CD, and MS spectra were measured and compared with those of RGDFRGDS. The UV-Vis spectra indicated that over the wavelength of 220–760 nm, RGDFRGDS gave no signal, while Cu2+-FS had a d–d transition at 560 nm (Figure 2), which is in agreement with the tetracoordinated Cu in CuN2O2 in a nearly square planar geometry.26
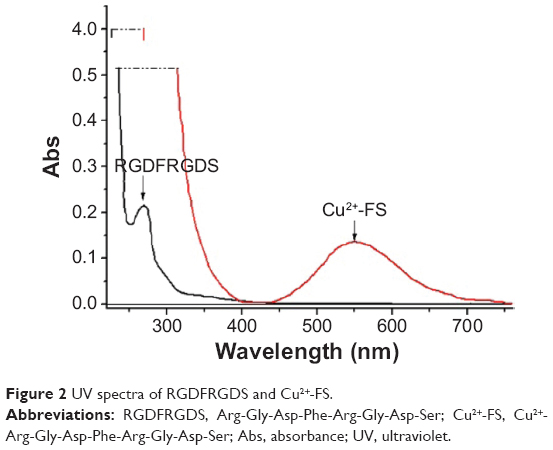 | Figure 2 UV spectra of RGDFRGDS and Cu2+-FS. |
CD spectroscopy is a very sensitive technology for characterizing metal ion speciation in low concentration.27,28 The CD spectra showed that over the 400–750 nm wavelength, RGDFRGDS gave no signal, while Cu2+-FS gave negative bands around 560 nm, the d–d transition results from Cu2+-FS (Figure 3). The d–d transition energy indicated that each Cu2+ was coordinated with two oxygen atoms and two nitrogen atoms.29 A positive dichroic band at 270 nm was observed in the charge transfer region. The σ N →3d transitions, the transitions from σ N to 3d, were typically observed in this region. This model was characterized by a charge transfer transition of N/Cu2+ at ~270 nm and a d–d transition at ~560 nm. Further, the ESI-MS spectra showed that Cu2+-FS consistently provided a characteristic peak of [M–H]− indicating the complexation of one mole of RGDFRGDS and one mole Cu2+. Therefore the UV, CD, and ESI-MS tests supported the 2N and 2O model of {NH, 2N-, CO} of Cu2+-FS.
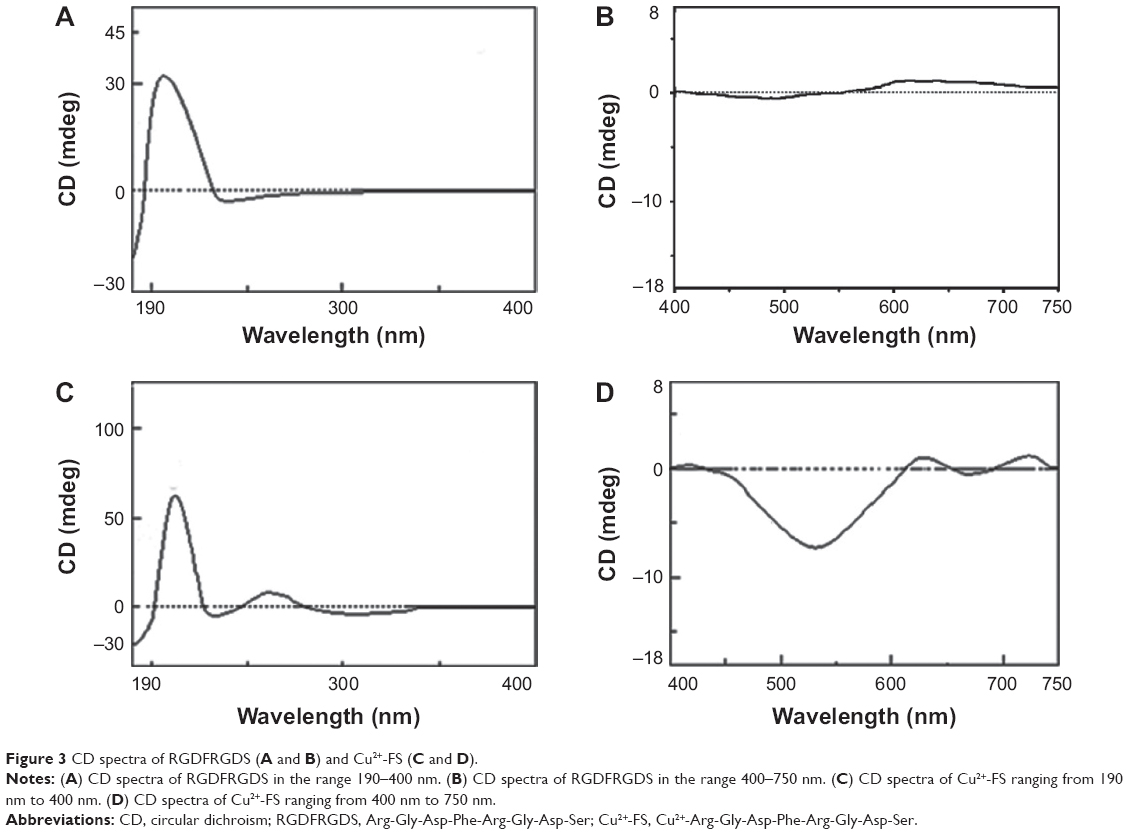 | Figure 3 CD spectra of RGDFRGDS (A and B) and Cu2+-FS (C and D). |
FT-MS spectrum and dimers
The FT-MS spectrum of aqueous Cu2+-FS is shown in Figure 4. The ion peak at 1,981.57170 (inset) equals the mass of two molecules of Cu2+-FS plus K (971.3396), suggesting the FT-MS spectrum belonged to a dimer of Cu2+-FS. Since the spectrum contained no ion peak of the monomer, the dimer should be the existing form of Cu2+-FS in water.
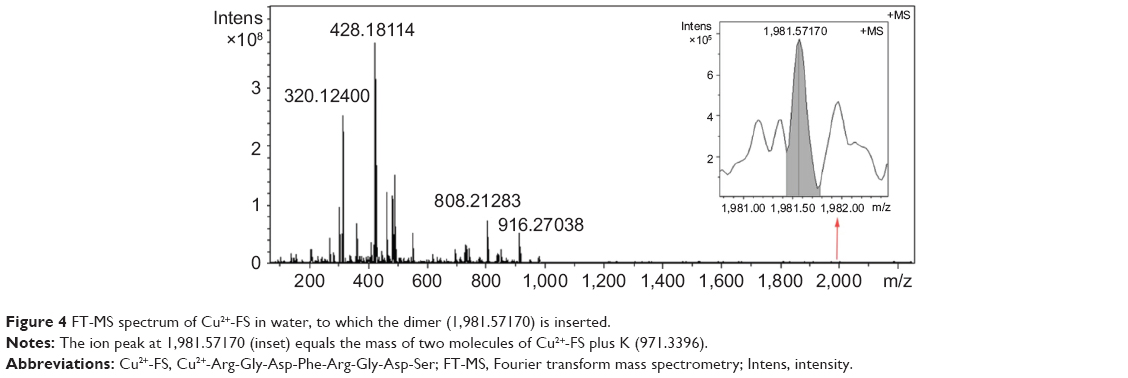 | Figure 4 FT-MS spectrum of Cu2+-FS in water, to which the dimer (1,981.57170) is inserted. |
Computer-predicted nanoparticles
To predict the assembly of the dimers of Cu2+-FS, computer-assisted molecular modeling was performed. A three-step procedure of geometry optimization, molecular dynamics, and geometry optimization was used to optimize the free energy of Cu2+-FS, and the conformation of the lowest energy of the monomer and the dimer were defined. The geometry optimization suggested that to form a dimer, two molecules should approach in a head-to-tail manner – and six holes occurred (Figure 5A). The mesoscale simulation software assisted calculation showed that Cu2+-FS formed nanoparticles and that the smallest particle was 31 nm in diameter and contained 27 dimers (Figure 5B).
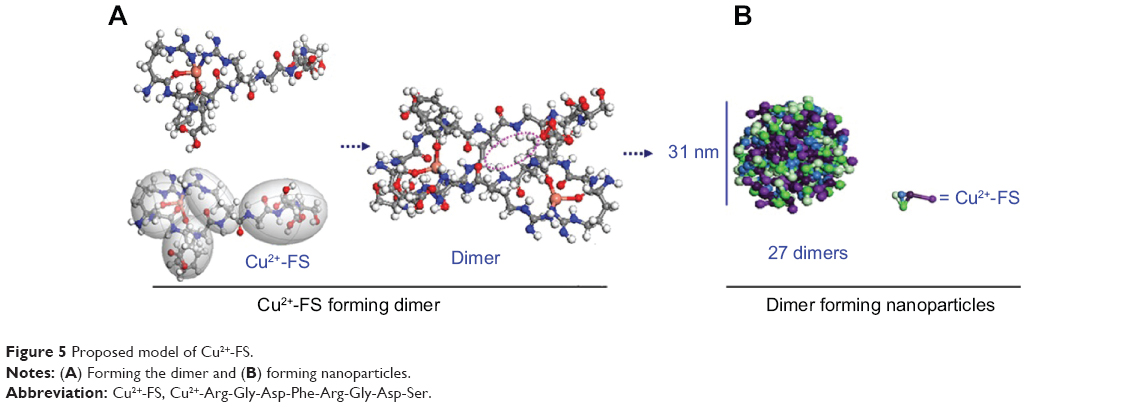 | Figure 5 Proposed model of Cu2+-FS. |
Particle size and zeta potential of Cu2+-FS in NS
The mesoscale simulation software-assisted calculation predicted the size of nanoparticle in figure 5. Also, the self-assembly was confirmed by the nanosize of Cu2+-FS in NS, which was monitored for 10 days, and the data are listed in Figure 6A. As seen in the figure, in NS, Cu2+-FS formed nanoparticles of 126.2 to 252.7 nm in diameter. Even on day 10, the particle diameter was still around 177.8 nm. Therefore these nanoparticles were stable enough. The particle sizes of Cu2+-FS in NS were also monitored during the beginning 27 minutes and are shown in Figure 6B. The data reveal that at the very beginning, Cu2+-FS assembled into nanoparticles of 238.2±34.4 nm in diameter, and at 27 minutes, the diameters of the particles were 113.9±21.7 nm. The diameters of the nanoparticles at 27 minutes, 24 hours, and 10 days were close to each other. This suggests that in NS, Cu2+-FS was able to quickly form stable nanoparticles.
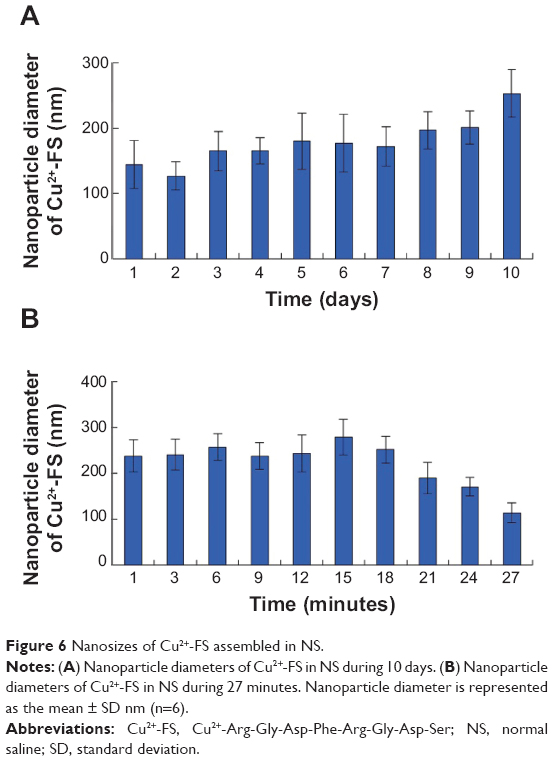 | Figure 6 Nanosizes of Cu2+-FS assembled in NS. |
To explore the zeta potential of Cu2+-FS in NS, a solution was monitored for up to 10 days. On the first day, the zeta potential of the particle surface was about 36.12 mV, suggesting the surfaces of the particles were surrounded by the positive charges. On day 10, the zeta potential of the surfaces of the particles were approximately 28.97 mV, suggesting the particles were still positively charged. The zeta potential on day 10 was similar to that on day 1, suggesting the nanoparticles of Cu2+-FS in NS were stable and had no significant change in 10 days.
Features of Cu2+-FS nanoparticles in aqueous solution of pH 6.7 and 7.4
The computer-predicted nanomorphology of Cu2+-FS was confirmed by TEM images. In aqueous solution, Cu2+-FS (pH 6.7, 0.015 nM) formed nanoparticles of 13–90 nm in diameter (Figure 7). As seen in the figure, on the surface of the nanoparticles were numerous holes of ~4 nm in diameter. It could be hypothesized that the dimers of Cu2+-FS assembled in the head-to-tail conformation and formed nanoparticles with porous surfaces.
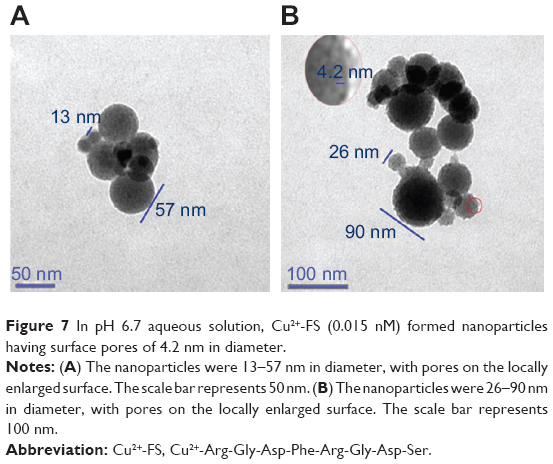 | Figure 7 In pH 6.7 aqueous solution, Cu2+-FS (0.015 nM) formed nanoparticles having surface pores of 4.2 nm in diameter. |
To explore the effect of the concentration on the size of the surface pore of the nanoparticles, the TEM-images of Cu2+-FS at various concentrations of aqueous solution of pH 7.4 (the pH of the blood and tissue fluid) were measured, analyzed, and are shown in Figure 8. As seen in the figure, the size of the surface pore of the nanoparticles depended on the concentration. At 1.5×10⁻² nM, 1.5 nM, 1.5×10² nM, 1.5×10³ nM, 1.5×10⁶ nM and 1.5×10⁸ nM concentrations, the pore diameters were 3.1–3.3 nm, 4.2 nm, 4.5–4.9 nm, 5.0–5.3 nm, 8.3–8.7 nm, and 9.0–10.0 nm, respectively. Of the six concentrations, 1.5 nM, 1.5×10² nM, and 1.5×10³ nM equaled the blood concentrations of the rats treated with 0.1, 1.0, and 10.0 mol/kg of Cu2+-FS, respectively.
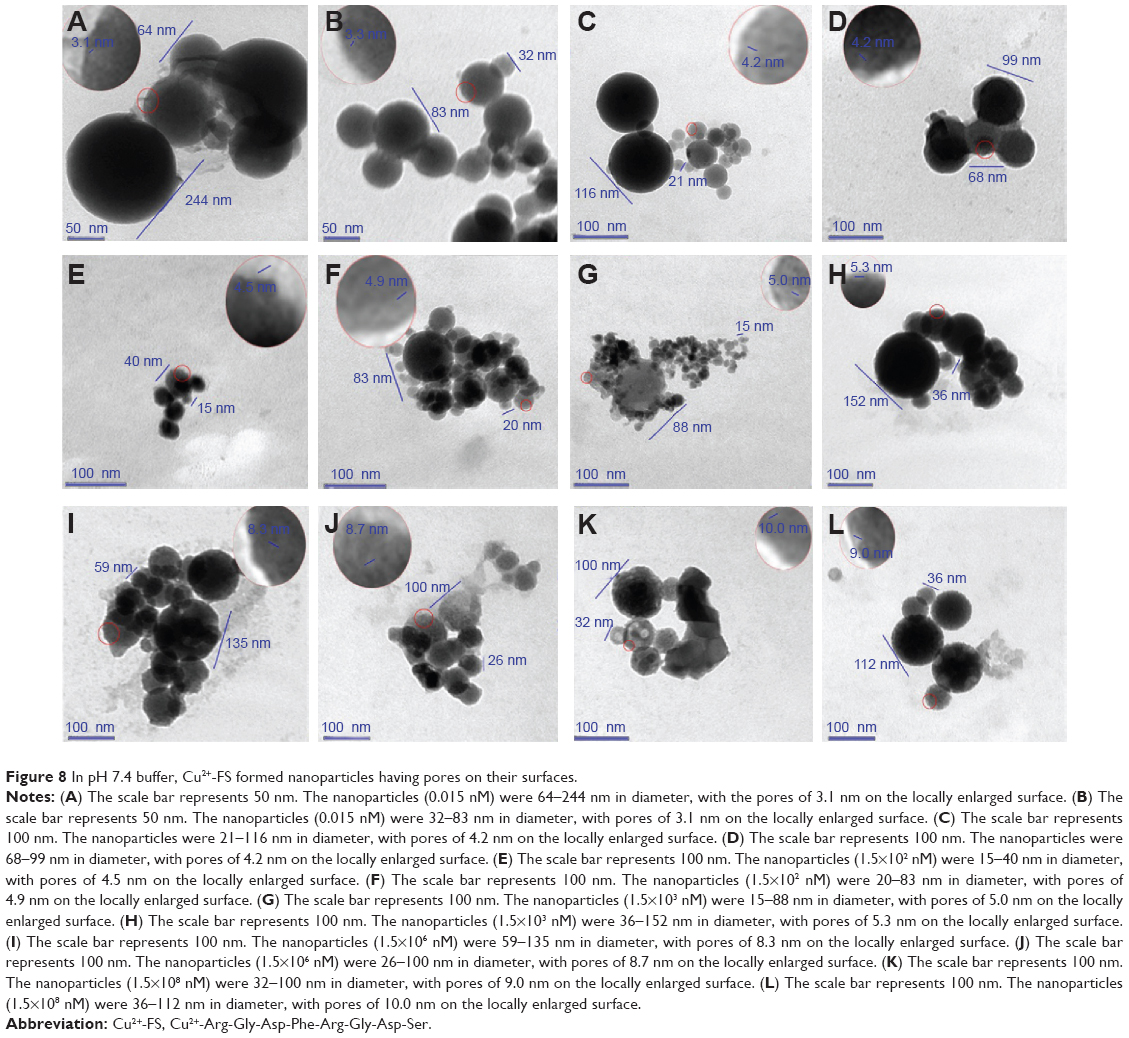 | Figure 8 In pH 7.4 buffer, Cu2+-FS formed nanoparticles having pores on their surfaces. |
AFM image of nanoparticles
The computer-predicted nanomorphology of Cu2+-FS was further confirmed by AFM image. The blank rat plasma contained no comparable nanoparticles (Figure 9A). In rat plasma, Cu2+-FS (10−2 μM) formed nanoparticles of 39.3–78.1 nm in height (Figure 9B). In aqueous solution of pH 7.4, Cu2+-FS (10−2 μM) formed nanoparticles of 39.6–54.9 nm in height (Figure 9C).
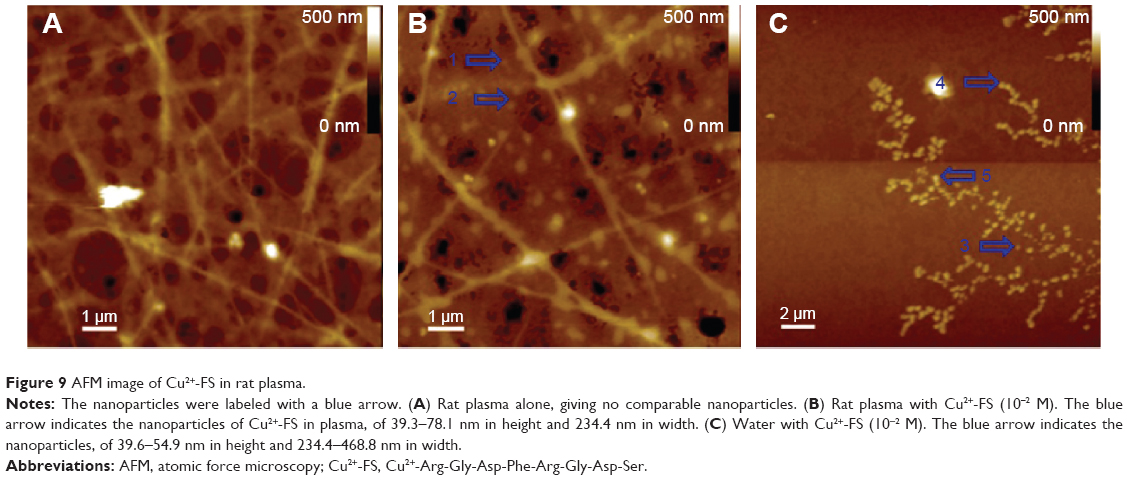 | Figure 9 AFM image of Cu2+-FS in rat plasma. |
SEM image of the platelets treated with Cu2+-FS
The interaction between the nanoparticles and the activated platelets was visualized with the SEM image of Cu2+-FS-treated rat platelets. There were numerous nanoparticles on the surfaces of the AA-activated rat platelets treated with 200 nM Cu2+-FS (Figure 10A), and some nanoparticles were on the edge of the pores (Figure 10A). In contrast, there were no comparable nanoparticles on the surfaces of the AA-activated rat platelets treated with NS (Figure 10B). Further, the AA-activated rat platelets treated with NS had pseudopods, while the AA-activated rat platelets treated with 200 nM Cu2+-FS had no such pseudopods.
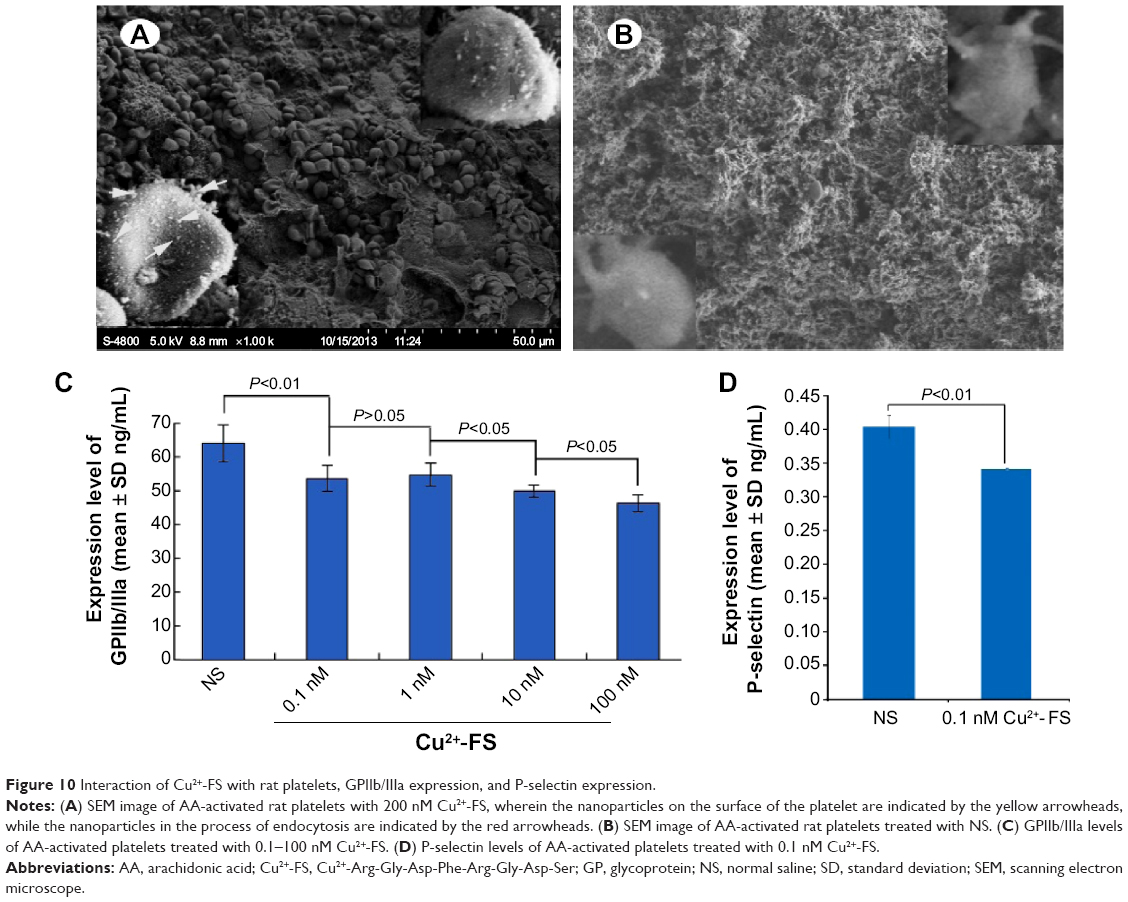 | Figure 10 Interaction of Cu2+-FS with rat platelets, GPIIb/IIIa expression, and P-selectin expression. |
Downregulation of GPIIb/IIIa and P-selectin
The effect of the nanoparticles on the activated platelets was quantitatively explained with the GPIIb/IIIa expression in the AA-activated rat platelets. The ELISA experiment indicated that the level of GPIIb/IIIa from AA-activated platelets treated with 0.1–100 nM Cu2+-FS was significantly lower than that from AA-activated platelets treated with NS (Figure 10C). The effect of 0.1 nM Cu2+-FS (the lowest effective concentration) on the activated platelets was quantitatively explained by the P-selectin expression of AA-activated platelets (Figure 10D). The ELISA experiment indicated that the level of P-selectin (0.340±0.001 ng/mL) in AA-activated rat platelets treated with 0.1 nM Cu2+-FS was significantly lower than that (0.404±0.017 ng/mL) in AA-activated platelets treated with NS.
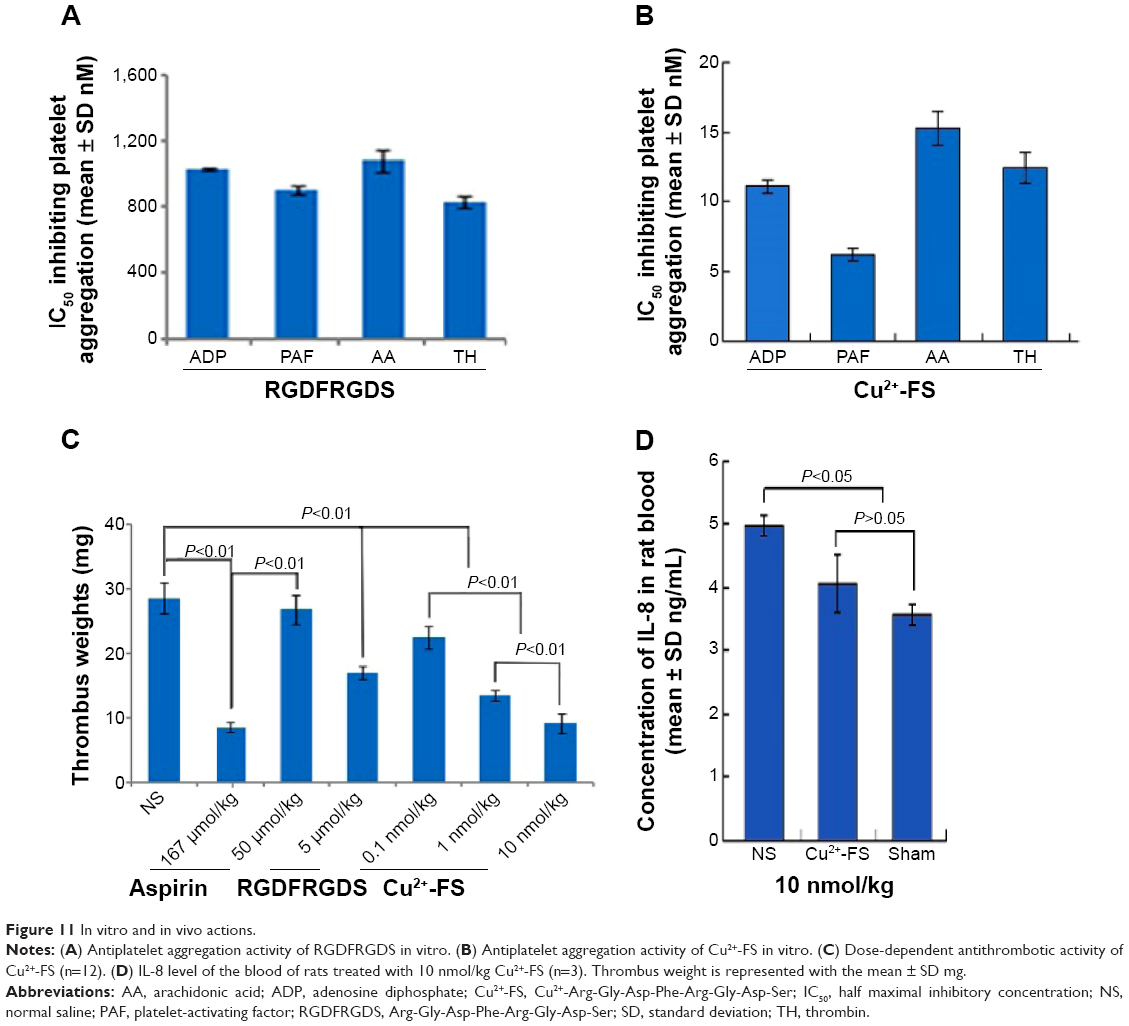
In vitro Cu2+-FS effectively inhibits platelet aggregation
The interaction between the nanoparticles and the activated platelets resulted in the inhibition of platelet aggregation and was evidenced by the in vitro assay. The IC50s of Cu2+-FS against the platelets activated by ADP, PAF, AA, and TH were 11.1, 6.2, 15.3, and 12.4 nM, respectively (Figure 11B), which were 70- to 145-fold lower than that of the RGDFRGDS-treated platelets (Figure 11A).
 | Figure 11 In vitro and in vivo actions. |
In vivo Cu2+-FS effectively inhibits thrombus development in rats
The interaction between the nanoparticles and the activated platelets resulted in the inhibition of thrombosis and was evidenced by the in vivo thrombosis assay. The antithrombotic activity was represented by the thrombus weight. As seen in Figure 11C, at the 10.0, 1.0, and 0.1 nmol/kg doses, Cu2+-FS significantly lowered the thrombus weight in rats to a greater extent than did NS. The thrombus weight of the rats treated with Cu2+-FS gradually increased as the dosage was decreased from 10.0 nmol/kg to 1.0 nmol/kg and to 0.1 nmol/kg (Figure 11C).
Downregulation of IL-8 expression
TH may stimulate multiple inflammatory cytokines, such as IL-6 and IL-8.30,31 A previous clinical study of 474 patients with recurrent venous thrombosis suggested that IL-8 was a risk factor.32 IL-8 level may play a causative role in venous thrombosis.33 The determination of IL-8 level after the induction of thrombus indicated that the thrombotic event could be associated with an increased IL-8 concentration.34,35 The inhibitory effect of Cu2+-FS on brain inflammation was identified with IL-8. Figure 11D shows that the quantity of IL-8 in the blood of the 10 nmol/kg Cu2+-FS-treated “thrombosed” rats was significantly lower than that of the NS-treated thrombosed rats and was at the same level as that of the sham-treated rat. The finding suggests that 10 nmol/kg Cu2+-FS is able to block the development of inflammation in thrombotic rats.
Discussion
From dimer to nanoparticle mirroring the assembly course of Cu2+-FS
The ion peak of the highest mass (1,981.5717) in the FT-MS spectrum belonged to the dimer, representing the basic form of Cu2+-FS in aqueous solution, and suggests that the formation of the dimers is the preliminary step of self-assembly of Cu2+-FS in aqueous solution. The TEM image visualized that the formation of nanoparticles was the final step of self-assembly of Cu2+-FS in aqueous solution. Thus progression from the dimer to the nanoparticle could be the assembly course of Cu2+-FS in aqueous solution. The assembly course of Cu2+-FS in aqueous solution was simulated with the mesoscale simulation software-assisted calculation, to understand that the smallest particle of 31 nm in diameter contained 27 dimers. The stability and the size of the nanoparticles in the blood are of importance for their delivery in the circulation – AFM imaging confirmed that the nanoparticles of Cu2+-FS were stable in blood and have suitable size for their delivery in the circulation.
SEM image evidencing the action model of Cu2+-FS with activated platelets
SEM images of the activated rat platelets before and after Cu2+-FS treatment showed successive events, ie, firstly the nanoparticles adhered onto the surfaces and then entered into the cytoplasm of the activated platelets. Thus, the SEM images visualized a two-step model for the inhibition of the event of the activated platelets by the Cu2+-FS nanoparticles. It is well known that two transmembrane receptors, GPIIb/IIIa and P-selectin, are responsible for platelet aggregation and that both membrane and the cytoplasm domains greatly affect the expression of GPIIb/IIIa and P-selectin.36,37 Thus via the two-step model, the nanoparticles of Cu2+-FS successively bind the membrane and cytoplasm domains and downregulate the expression of GPIIb/IIIa and P-selectin.
Quantitative monitoring of Cu2+-FS downregulation of GPIIb/IIIa and P-selectin
The ELISA experiment demonstrated that 0.1 nM Cu2+-FS-induced downregulation of GPIIb/IIIa expression could be quantitatively monitored in AA-activated rat platelets. The significantly lowered level of expression, not only matched the activity of Cu2+-FS inhibition of GPIIb/IIIa activation but also, mirrored one of the action mechanisms of Cu2+-FS inhibition of platelet aggregation. Similarly, the ELISA experiment demonstrated that 0.1 nM Cu2+-FS induced downregulation of P-selectin expression in AA-activated rat platelets could be quantitatively monitored. The significantly lowered level of P-selectin, not only matched the activity of Cu2+-FS in inhibiting P-selectin activation but also, mirrored one of the action mechanisms of Cu2+-FS inhibition of platelet aggregation. Therefore Cu2+-FS inhibition of platelet aggregation may be the result of downregulating both GPIIb/IIIa and P-selectin expression.
Complexation of Cu2+ with RGD-peptide and high antithrombotic activity
In inhibiting platelet aggregation, the IC50 values of Cu2+-FS were 70- to 145-fold lower than that of RGDFRGDS. In inhibiting thrombosis, the antithrombotic activity of Cu2+-FS was 5,000-fold higher than that of RGDFRGDS. The comparisons imply that the complexation of Cu2+ and RGD peptides greatly enhances the antithrombotic activity. As mentioned above, the Cu2+-FS complex formed nanoparticles that could effectively adhere onto the surface and enter into the cytoplasm of the activated platelets, and could be stably delivered in the blood circulation. Thus it could be the case that the assembly of the nanoscale Cu2+-FS complex dimers dramatically enhances the antiplatelet aggregation and antithrombotic activities of RGD-peptides.
Downregulation of IL-8 expression provided judgment of antithrombotic therapy
A biomarker capable of quantitatively evaluating the efficacy of antithrombotic therapy is of clinical importance. It has been known for over 20 years that TH-activated platelets can express more IL-8;38 however, no investigation has correlated blood IL-8 with antithrombotic therapy. The dose of 10 nmol/kg Cu2+-FS simultaneously led to the lower thrombus weight and lower blood IL-8 levels in the rats, correlating thrombus inhibition with the normalization of blood IL-8, and allowed the interpretation that blood level of IL-8 could be a useful parameter in judging the response of patients receiving antithrombotic therapy.
Conclusion
In contrast with the previous report,22 Cu(II)-4a, -4b, and -4c, Cu2+-FS possessed high antiplatelet activity in vitro and high antithrombotic activity in vivo, and as well, formed nanoparticles with surface pores of 4–9 nm in diameter. Further, the study results evidenced the formation of a Cu2+-FS dimer, predicted the theoretical process and structure of the nanoparticle formation, identified the activity of Cu2+-FS in downregulation of GPIIb/IIIa and P-selectin expression, and correlated the blood level of IL-8 with the formation of thrombus.
Acknowledgments
This work was completed at the Beijing Area Major Laboratory of Peptide and Small Molecular Drugs, supported by the National Natural Science Foundation of China (grant numbers 81273379, 81202412 and 81270046), the National Natural Science Foundation of Beijing (grant number 7122023), Beijing Municipal Science and Technology Commission (grant number Z141100002114049), and the Beijing Nova Programme (grant number XX2013039).
Disclosure
The authors report no conflicts of interest in this work.
References
Arnaout MA, Goodman SL, Xiong JP. Coming to grips with integrin binding to ligands. Curr Opin Cell Biol. 2002;14(5):641–651. | ||
Lowell CA, Mayadas TN. Overview: studying integrins in vivo. Methods Mol Biol. 2012;757:369–397. | ||
Campbell ID, Humphries MJ. Integrin structure, activation, and interactions. Cold Spring Harb Perspect Biol. 2011;3(3):a004994. | ||
Malkar NB, Lauer-Fields JL, Juska D, Fields GB. Characterization of peptide-amphiphiles possessing cellular activation sequences. Biomacromolecules. 2003;4(3):518–528. | ||
Conradi J, Huber S, Gaus K, et al. Cyclic RGD peptides interfere with binding of the Helicobacter pylori protein CagL to integrins αVβ3 and α5β1. Amino Acids. 2012;43(1):219–232. | ||
Wang YW, Yang K, Tang H, Chen D, Bai YL. Toxicity assessment of repeated intravenous injections of arginine-glycine-aspartic acid peptide conjugated CdSeTe/ZnS quantum dots in mice. Int J Nanomedicine. 2014;9:4809–4817. | ||
Cox RG, Livesay SB, Johnson M, Ohi MD, Williams JV. The human metapneumovirus fusion protein mediates entry via an interaction with RGD-binding integrins. J Virol. 2012;86(22):12148–12160. | ||
Fang W, He J, Kim YS, Zhou Y, Liu S. Evaluation of 99mTc-labeled cyclic RGD peptide with a PEG4 linker for thrombosis imaging: comparison with DMP444. Bioconjug Chem. 2011;22(8):1715–1722. | ||
Wang YY, Lü LX, Shi JC, Wang HF, Xiao ZD, Huang NP. Introducing RGD peptides on PHBV films through PEG-containing cross-linkers to improve the biocompatibility. Biomacromolecules. 2011;12(3):551–559. | ||
Lin YP, McDonough SP, Sharma Y, Chang YF. Leptospira immunoglobulin-like protein B (LigB) binding to the C-terminal fibrinogen αC domain inhibits fibrin clot formation, platelet adhesion and aggregation. Mol Microbiol. 2011;79(4):1063–1076. | ||
Ashino T, Sudhahar V, Urao N, et al. Unexpected role of the copper transporter ATP7A in PDGF-induced vascular smooth muscle cell migration. Circ Res. 2010;107(6):787–799. | ||
Vosburgh WC, Cooper GR. Complex Ions I. The Identification of Complex Ions in Solution by Spectrophotometric Measurements. J Am Chem Soc. 1941;63(2):437–442. | ||
Duncan C, White AR. Copper complexes as therapeutic agents. Metallomics. 2012;4(2):127–138. | ||
Yang M, Cui G, Zhao M, et al. The effect of complexation of Cu(II) with P6A peptide and its analogs on their thrombolytic activities. Int J Pharm. 2008;362(1–2):81–87. | ||
Reches M, Gazit E. Molecular self-assembly of peptide nanostructures: Mechanism of association and potential use. Curr Nanosci. 2006;2(2):105–111. | ||
Chen Y, Cui GH, Zhao M, Peng SQ. Synthesis nanoscale assembly, and in vivo anti-thrombotic activity of novel short peptides containing L-Arg and L-Asp or L-Glu. Bioorg Med Chem. 2008;16(11):5914–5925. | ||
Plow EF, Haas TA, Zhang L, Loftus J, Smith JW. Ligand binding to integrins. J Biol Chem. 2000;275(29):21785–21788. | ||
Rajagopal K, Schneider JP. Self-assembling peptides and proteins for nanotechnological applications. Curr Opin Struct Biol. 2004;14(4):480–486. | ||
Chitnumsub P, Fiori WR, Lashuel HA, Diaz H, Kelly JW. The nucleation of monomeric parallel beta-sheet-like structures and their self-assembly in aqueous solution. Bioorg Med Chem. 1999;7(1):39–59. | ||
Łodyga-Chruścińska E, Ołdziej S, Micera G, et al. Impact of 1,5-disubstituted tetrazole ring on chelating ability of delta-selective opioid peptide. J Inorg Biochem. 2004;98(3):447–458. | ||
Boros E, Rybak-Akimova E, Holland JP, et al. Pycup – a bifunctional, cage-like ligand for (64)Cu radiolabeling. Mol Pharm. 2014;11(2):617–629. | ||
Li N, Kang G, Gui L, et al. Novel Cu(II)-RGD-octapeptides: Synthesis, coordination mode, in vitro anti-platelet aggregation/in vivo anti-thrombotic evaluation and correlation of sequence with nano-structure. Nanomedicine. 2011;7(4):403–409. | ||
Poulsen TS, Kristensen SR, Korsholm L, et al. Variation and importance of aspirin resistance in patients with known cardiovascular disease. Thromb Res. 2007;120(4):477–484. | ||
Seok JI, Joo IS, Yoon JH, et al. Can aspirin resistance be clinically predicted in stroke patients? Clin Neurol Neurosurg. 2008;110(2):110–116. | ||
Yang G, Zhao M, Peng S et al. The application of tetrahydroisoquinoline-3-carbonyl-TARGD(F)F as an anti-thrombotic agent having dual mechanisms of action. Mol Biosyst. 2012;8(10):2672–2679. | ||
Krishnapriya KR, Saravanakumar D, Arunkumar P, Kandaswamy M. Synthesis of new oxamide-based ligand and its coordination behavior towards copper(II) ion: spectral and electrochemical studies. Spectrochim Acta A Mol Biomol Spectrosc. 2008;69(4):1077–1081. | ||
Klewpatinond M, Viles JH. Empirical rules for rationalising visible circular dichroism of Cu2+ and Ni2+ histidine complexes: applications to the prion protein. FEBS Lett. 2007;581(7):1430–1434. | ||
Ősz K, Bóka B, Várnagy KI, Imre Sóvágóa, Tibor Kurtánb, Sándor Antus. The application of circular dichroism spectroscopy for the determination of metal ion speciation and coordination modes of peptide complexes. Polyhedron. 2002;21(21):2149–2159. | ||
Cucinotta V, Giuffrida A, Maccarrone G, et al. Coordination properties of 3-functionalized beta-cyclodextrins. Thermodynamic stereoselectivity of copper(II) complexes of the A,B-diamino derivative and its exploitation in LECE. Dalton Trans. 2005;(16):2731–2736. | ||
Anderson FA Jr, Spencer FA. Risk factors for venous thromboembolism. Circulation. 2003;107(23 Suppl 1):I9–I16. | ||
Silverstein MD, Heit JA, Mohr DN, Petterson TM, O’Fallon WM, Melton LJ. Trends in the incidence of deep vein thrombosis and pulmonary embolism: a 25-year population-based study. Arch Intern Med. 1998;158(6):585–593. | ||
van Aken BE, den Heijer M, Bos GM, van Deventer SJ, Reitsma PH. Recurrent venous thrombosis and markers of inflammation. Thromb Haemost. 2000;83(4):536–539. | ||
van Aken BE, Reitsma PH, Rosendaal FR. Interleukin 8 and venous thrombosis: evidence for a role of inflammation in thrombosis. Br J Haematol. 2002;116(1):173–177. | ||
Wakefield TW, Greenfiel LJ, Rolfe MW, et al. Inflammatory and procoagulant mediator interactions in an experimental baboon model of venous thrombosis. Thromb Haemost. 1993;69(2):164–172. | ||
Fox AE and Kahn SR. The relationship between inflammation and venous thrombosis. A systematic review of clinical studies. Thromb Haemost. 2005;94(2):362–365. | ||
Lippi G, Montagnana M, Danese E, Favaloro EJ, Franchini M. Glycoprotein IIb/IIIa inhibitors: an update on the mechanism of action and use of functional testing methods to assess antiplatelet efficacy. Biomark Med. 2011;5(1):63–70. | ||
Chelliah R, Lucking AJ, Tattersall L, et al. P-selectin antagonism reduces thrombus formation in humans. J Thromb Haemost. 2009;7(11):1915–1919. | ||
Weyrich AS, Elstad MR, McEver RP, et al. Activated platelets signal chemokine synthesis by human monocytes. J Clin Invest. 1996;97(6):1525–1534. |
 © 2015 The Author(s). This work is published and licensed by Dove Medical Press Limited. The full terms of this license are available at https://www.dovepress.com/terms.php and incorporate the Creative Commons Attribution - Non Commercial (unported, v3.0) License.
By accessing the work you hereby accept the Terms. Non-commercial uses of the work are permitted without any further permission from Dove Medical Press Limited, provided the work is properly attributed. For permission for commercial use of this work, please see paragraphs 4.2 and 5 of our Terms.
© 2015 The Author(s). This work is published and licensed by Dove Medical Press Limited. The full terms of this license are available at https://www.dovepress.com/terms.php and incorporate the Creative Commons Attribution - Non Commercial (unported, v3.0) License.
By accessing the work you hereby accept the Terms. Non-commercial uses of the work are permitted without any further permission from Dove Medical Press Limited, provided the work is properly attributed. For permission for commercial use of this work, please see paragraphs 4.2 and 5 of our Terms.