")
Back to Journals » ClinicoEconomics and Outcomes Research » Volume 6
Cost of tumor necrosis factor blockers per patient with rheumatoid arthritis in a multistate Medicaid population
Authors Bonafede M, Joseph G, Shah N, Princic N, Harrison D
Received 29 January 2014
Accepted for publication 29 April 2014
Published 15 September 2014 Volume 2014:6 Pages 381—388
DOI https://doi.org/10.2147/CEOR.S61445
Checked for plagiarism Yes
Review by Single anonymous peer review
Peer reviewer comments 3
Machaon Bonafede,1 George J Joseph,2 Neel Shah,2 Nicole Princic,1 David J Harrison2
1Truven Health Analytics, Cambridge, MA, 2Amgen Inc., Thousand Oaks, CA, USA
Background: The purpose of this study was to estimate the annual cost per treated patient for the tumor necrosis factor (TNF) blockers, etanercept, adalimumab, and infliximab in rheumatoid arthritis (RA) patients covered by Medicaid.
Methods: The MarketScan Medicaid Multistate Database was used to identify adult RA patients who used etanercept, adalimumab, or infliximab (index agents) from 2007 to 2011. The index date was the first claim preceded by 180 days and followed by 360 days of continuous enrollment. Patients with other conditions for which these agents are approved by the US Food and Drug Administration were excluded. “Continuing” patients had one or more pre-index claim for their index biologic, and "new" patients did not. Cost per treated patient was calculated in the 360 day post-index period for each index agent as the total index drug and administration cost to the payer and the costs of switched-to agents divided by the number of patients who received the index agent.
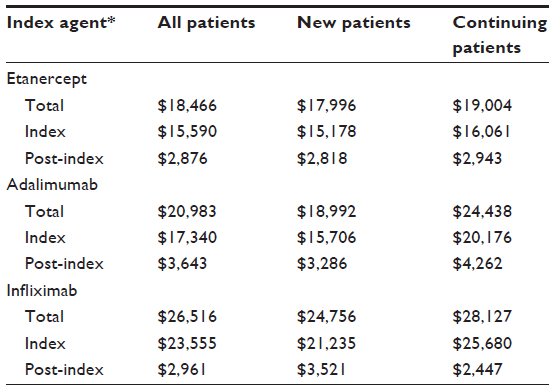
Results: A total of 1,085 patients met the study criteria. Forty-eight percent received etanercept (n=521); 37% received adalimumab (n=405); and 15% received infliximab (n=159). Patient characteristics were similar across groups (mean age 47.4 years, 83% female). The annual cost per treated patient was lowest for etanercept ($18,466), followed by adalimumab ($20,983) and infliximab ($26,516). For all agents, annual costs were lower for new patients ($17,996 for etanercept, $18,992 for adalimumab, and $24,756 for infliximab) than for continuing patients ($19,004 for etanercept, $24,438 for adalimumab, and $28,127 for infliximab).
Conclusion: Etanercept had lower costs per treated patient than adalimumab or infliximab in both new and continuing Medicaid enrollees with RA.
Keywords: cost, tumor necrosis factor, rheumatoid arthritis, Medicaid
Introduction
Rheumatoid arthritis (RA) is an inflammatory autoimmune condition that affects approximately 1.3 million adults in the USA.1,2 The disease is characterized by pain, joint swelling, and in severe cases, progressive destruction of joint tissue. It is a severe, chronic, and disabling disease that can shorten life expectancy, impair quality of life, and often requires medications that can have substantial personal and socioeconomic impact.1 Tumor necrosis factor (TNF) blockers, which are biologic disease-modifying antirheumatic drugs (DMARDs), play an important role in the treatment of moderate to severe RA by helping to regulate the inflammatory process and preventing future joint damage.3 The most commonly used TNF blockers include etanercept (Enbrel®; Immunex Corporation, Thousand Oaks, CA, USA), adalimumab (Humira®; AbbVie Inc., North Chicago, IL, USA), and infliximab (Remicade®; Janssen Biotech, Inc., Horsham, PA, USA).4–6
These three drugs differ in their method of administration, dose, and dosing schedule. While adalimumab and etanercept are each administered as a subcutaneous injection, infliximab is administered as an intravenous infusion and is dosed by weight. Specifically, the recommended doses of adalimumab are 40 mg every other week with the option of increasing the frequency to every week in patients not receiving concomitant methotrexate.7 The recommended dose for etanercept is 50 mg per week.8 The recommended dose for infliximab is 3 mg/kg at week 0, 2, and 6, and every 8 weeks thereafter. The dose for infliximab may be adjusted up to 10 mg/kg or the frequency increased to every 4 weeks.9
Biologic DMARDs are very costly, leading to many state Medicaid programs implementing prior authorization policies. The costs of biologic DMARDs is concerning because the annual costs based on dosing from the US package inserts can be over $20,000 per year. The number of states with prior authorization policies for biologic DMARDs increased steadily from 1999 to 2006. By 2005, total Medicaid DMARD spending was $567 million, with 44.8% spend on etanercept and adalimumab.10
Several analyses have evaluated the relative costs of etanercept, adalimumab, and infliximab in commercially insured patients with RA, but did not evaluate costs in the Medicaid population.4–6,11–16 Prior research evaluating costs using a large US database of commercially insured patients with one of the four primary conditions for which TNF blockers are indicated (rheumatoid arthritis, psoriasis, psoriatic arthritis, or ankylosing spondylitis) showed that annual costs per treated patient on adalimumab was approximately 18% higher than etanercept and infliximab was approximately 57% higher than etanercept.4 The objective of this analysis was to add to the existing literature by using drug utilization and costs in the Medicaid population to estimate treatment patterns and the annual cost per patient with a diagnosis of RA receiving TNF blocker therapy.
Patients and methods
Study population
This retrospective US claims analysis used administrative claims data from January 2007 through December 2011 from the Truven Health Analytics MarketScan® Multistate Medicaid Database. The database contains the pooled health care experience from 10–13 geographically dispersed states during the study period. The data include records of inpatient services, inpatient admissions, outpatient services, and prescription drug claims, as well as information on long-term and other medical care.
Patients were initially selected for the analysis if they were ≥18 years of age and had at least one claim for etanercept, adalimumab, or infliximab between January 1, 2007 and December 31, 2010. Certolizumab and golimumab were not included as index drugs in this analysis due to insufficient sample sizes. The index date was set as the first observed claim for a TNF blocker preceded by at least 180 days of continuous enrollment with prescription drug benefits in a Medicaid plan. If the patient’s first claim for a biologic in the database was not preceded by 6 months of enrollment, their next claim was evaluated until one that met this criterion was found. Patients were also required to remain continuously enrolled for 360 days following the index date and to have at least one medical claim with an International Classification of Diseases Ninth Revision Clinical Modification diagnosis code for RA (714.0x) with 180 days prior or 30 days following the index date. Patients were excluded if they had diagnoses for other conditions treated with TNF blockers in the 180 days preceding or 30 days following the index date, including psoriasis (696.1x), psoriatic arthritis (696.0x), ankylosing spondylitis (720.0x), Crohn’s disease (555.xx), ulcerative colitis (556.xx), or juvenile idiopathic arthritis (714.3x). Additional exclusion criteria served to remove patients from the analysis with claims for more than one TNF blocker on the study index date and those with incomplete drug data availability.
Data analysis
All data analyses were descriptive. Results were stratified by index drug and if the patient was new or continuing treatment. Data on all patients were calculated for baseline demographics (age and sex), plan type, prescribing physician specialty for claims within 10 days before the index date, and treatment status (new or continuing). Patients were considered to be new to their index drug treatment if they had no claim for their index drug during the 180-day period prior to the index date. Continuing patients were those who had a claim for their index drug during the 180-day pre-period.
Expenditures were calculated based on the quantity of each medication used (mg), the cost per mg of each medication, and administration costs. The quantity of each medication used was the total quantity dispensed, summed across all pharmacy and medical claims with an amount paid greater than zero. Daily dose per patient (mg) was calculated as the amount dispensed or infused divided by the interval until the next claim while the patient was persistent on the index therapy and then aggregated to determine the monthly dose. For the last claim, the amount dispensed was divided by the potential clinical benefit to determine the daily dose. Each month was rounded to 30 days, and the annual cost was based on 12 months (360 days). Dosing interval was defined using the recommended interval in the US package inserts between administrations and number of syringes, which were one week for each etanercept injection, 2 weeks for each adalimumab injection, and 8 weeks for each infliximab infusion. Patients were excluded from the analysis if their calculated dose exceeded twice the maximum recommended dose (for any indication that the drug is approved for).
Health plan costs per treated patient were calculated by first determining the monthly dose for index medications while a patient was persistent on therapy, doses of index medications used after a gap in therapy, and total doses for all other biologics used after a switch. Switched-to medications included all RA biologic agents approved by the US Food and Drug Administration (FDA) during the study period. Total doses (and related costs) for switched-to medications were attributed to the index medication. Total health plan drug costs were calculated by taking the total dose for each product and multiplying it by the wholesale administration cost as of September 2013, excluding patient share of payments. The patient copayment per claim was deducted, the dispensing fee added, and the resulting number was then divided by the mean number of mg per claim to calculate the final cost per mg to the health plan. The copayment for all biologics was set at $3.90, ie, the maximum allowed for Medicaid recipients with an income ≤100% of the Federal Poverty Line.17 The dispensing fee was $2.50 for each subcutaneous biologic.
Administration costs for etanercept, adalimumab, and infliximab were based on Medicare fee schedules for subcutaneous injections and intravenous infusions.18 It was assumed that new initiators of subcutaneous products received one provider-administered dose at therapy initiation and patients then self-administered subsequent subcutaneous injections for the remaining duration of their treatment.
Administration costs for infliximab were based on the percentage of claims with a CPT-4 code for an intravenous infusion. For infusion fees, both initial and subsequent hours were included, and it was assumed that all infusions required 2 hours, based on the distribution of administration times in the data. For infliximab claims with CPT-4 codes for infusions (96413 first hour, 96415 additional hour) were used to describe these infusion costs.
The cost per treated patient was defined as the sum of TNF blocker cost and related administration costs for 360 days after the index date, and included costs while persistent (no switches or gaps of greater than 45 days in index treatment) on index treatment plus costs of other biologics received after switching or a therapy gap. The monthly drug costs were calculated for patients while persistent on their index therapy. Persistence to the index treatment was measured during the follow-up period across all patients, new initiators, and continuers. Non-persistence was further categorized as a switch, restart, or discontinuance of the index medication. A restart was defined as a 45-day gap following the last day of supply (or estimated duration of clinical benefit) and then a subsequent claim for the index drug after the gap. A discontinuation was captured if there was a 45-day gap and then no other claims for any biologics for the remainder of the follow-up period. Patients were classified as switching if they had a claim for any biologic that was different from the index drug during the first year after the index date. The lists of treatments included in the switching analysis were the three index drugs (etanercept, adalimumab, infliximab) and then all other biologics approved for RA (abatacept, certolizumab, golimumab, rituximab).
Cost per treated patient was calculated from the Medicaid perspective based on the index medication; for patients who switched therapies, the costs associated with the switched-to medication were attributed to the index therapy. When a patient switched to another biologic, the cost of the non-index biologic was included in model estimates and attributed to the total annual cost of the index drug.
Results
Initially, there were 5,538 patients in the Medicaid database who had a claim for etanercept, adalimumab, or infliximab from January 1, 2007 to December 31, 2010 and with 180 days of continuous enrollment prior to that date. Of these, 1,512 had a diagnosis of RA in the appropriate window (within 180 days before to 30 days after the index claim), were aged 18 or older, and were continuously enrolled for 360 days following the first claim for etanercept, adalimumab, or infliximab. After applying the additional exclusion criteria, 1,085 patients were eligible for the study (Table 1).
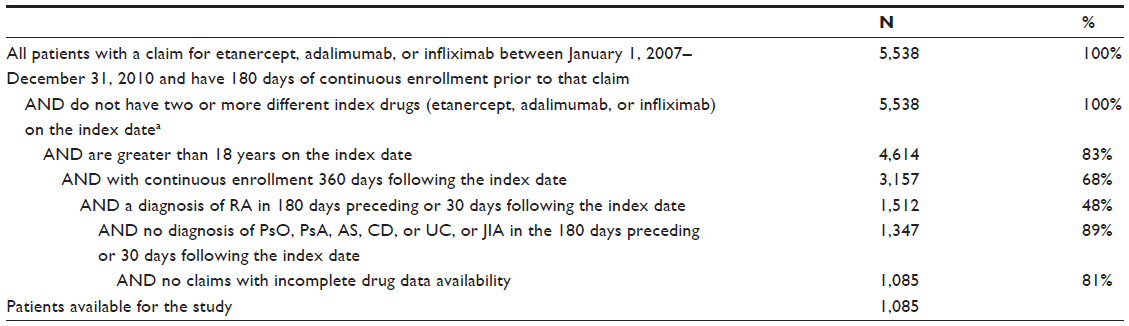 | Table 1 Patient attrition |
Of the 1,085 RA patients who satisfied the inclusion and exclusion criteria for analysis, 474 (44%) were continuing prior therapy with etanercept, adalimumab, or infliximab and 611 (56%) started a new TNF blocker on the index date. Etanercept (521 patients, 48%) was the most commonly used treatment followed by adalimumab (405 patients, 37%), and infliximab (159 patients, 15%), as shown in Table 2.
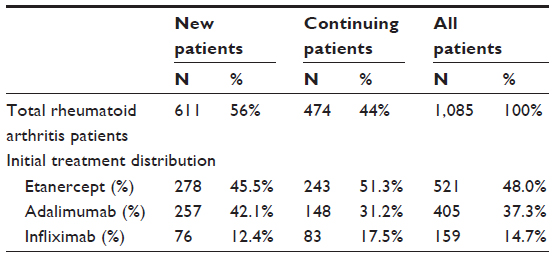 | Table 2 Number of patients in analysis, by initial treatment and status (new or continuing) |
The demographic characteristics for all RA patients by initial treatment (etanercept, adalimumab or infliximab) are shown in Table 3. The majority of patients were in an indemnity health plan (>50%) followed by a point-of-service plan or a health maintenance organization (20%–25%). The most recent provider claim before the index date was usually for a visit to an internist or a rheumatologist. Age distribution and sex were similar between the three treatment groups across new and continuing patients (mean age 47.4±10.7 years, 83% female). A smaller proportion of patients on etanercept and adalimumab were continuing therapy at the index date relative to infliximab (47% and 37% versus 52%).
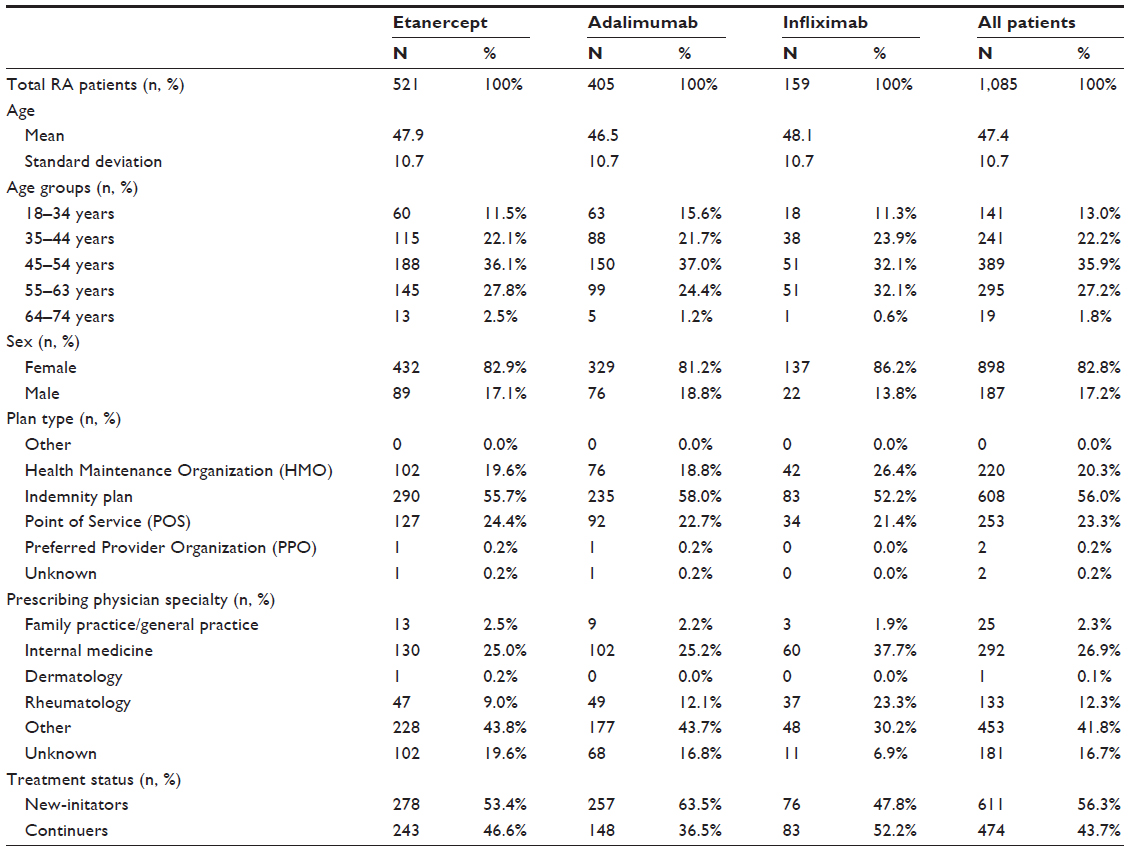 | Table 3 Demographic characteristics |
The cost per treated patient for adalimumab and infliximab relative to etanercept, overall and by new and continuing patients, is shown in Figure 1. Among the three TNF blockers, the cost per treated patient was $18,466 for etanercept, $20,983 for adalimumab, and $26,516 for infliximab. For new and continuing patients combined, the cost per patient for adalimumab relative to etanercept was 114% and the cost per patient for infliximab relative to etanercept was 144%. Costs for adalimumab and infliximab relative to etanercept were consistently higher across both groups (continuer and new initiator) but more pronounced in the continuer cohort (129% and 148% versus 106% and 138%). Annual costs were also lower for new patients ($17,996 for etanercept, $18,992 for adalimumab, and $24,756 for infliximab) than for continuing patients ($19,004 for etanercept, $24,438 for adalimumab, and $28,127 for infliximab). The contribution of post-index costs (ie, treatment costs incurred after non-persistence of the index therapy) to the total cost varied by index TNF blocker and comprised 9%–17% of the total cost per treatment patient (Table 4).
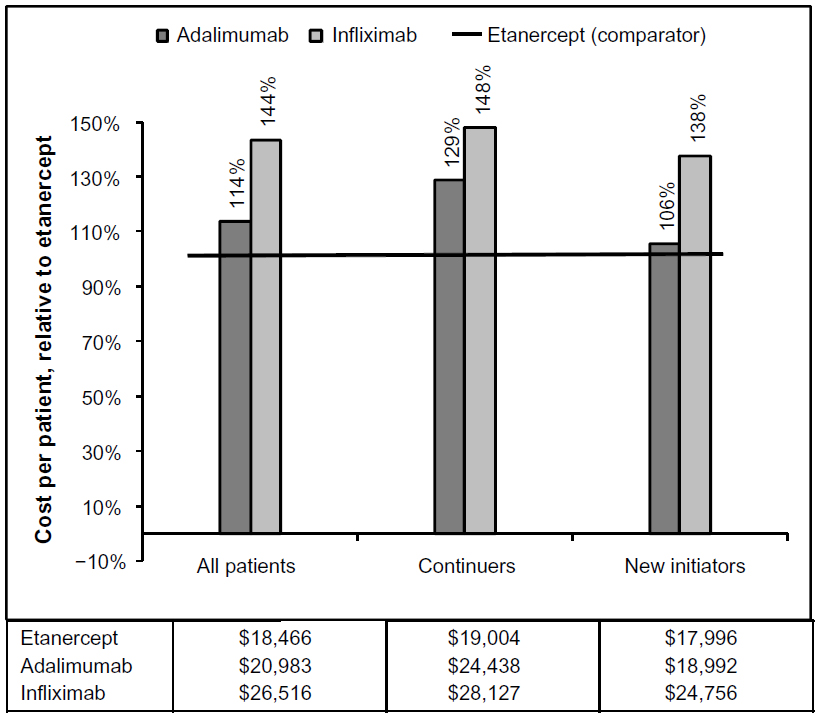 | Figure 1 Costs per treated patient relative to etanercept. |
 | Table 4 Contribution of index and post-index costs to total cost per treated patient |
The majority of patients treated with etanercept, adalimumab, or infliximab discontinued treatment, switched to a different biologic therapy, or restarted after a gap. The percentage of all patients remaining on their index agent for the whole year was 44% for etanercept, 39% for adalimumab, and 47% for infliximab. Patients continuing on treatment were more likely to remain persistent on their index treatment (49% for etanercept, 47% for adalimumab, and 58% for infliximab) than patients newly initiating treatment (38% for etanercept, 34% adalimumab, and 36% for infliximab). Patients who indexed on adalimumab had a larger proportion (61%) who discontinued index treatment compared with those who indexed on etanercept or infliximab (56% for etanercept, 53% for infliximab, Table 5).
 | Table 5 Treatment patterns |
Discussion
This study provides an evaluation of drug utilization and costs in a large US Medicaid population of RA patients treated with etanercept, adalimumab, or infliximab. We found that etanercept was both the most commonly used and the least costly TNF blocker. Relative to etanercept, the cost per treatment in these patients was 114% and 144% for adalimumab and infliximab, respectively. These findings are consistent with previous cost analyses that have compared the relative costs of etanercept, adalimumab, and infliximab in patients with RA.6–13 Prior research evaluating costs using a large US database of commercially insured patients with one of four primary conditions for which TNF blockers are indicated (rheumatoid arthritis, psoriasis, psoriatic arthritis, or ankylosing spondylitis) showed that costs per treated patient on adalimumab and infliximab were approximately 18% and 57% higher than for etanercept.4
Each year, there is a mix of RA patients newly initiating and continuing on treatment with etanercept, adalimumab, or infliximab. This current analysis found that the annual cost difference for etanercept compared with adalimumab and infliximab was more pronounced in the continuer cohort (129% and 148%) than in the new initiator cohort (106% and 138%). This finding supports the literature for the commercially insured population where cost differences were higher among continuing patients4 and is consistent with research reporting that elevated doses of adalimumab or infliximab may be required to maintain effectiveness over time, which could lead to higher costs. Previous work has demonstrated that dose modification is required more frequently for adalimumab and infliximab than for etanercept,12,14,19,20–25 potentially contributing to increased costs of these medications over time.12,14
Results from this analysis suggest that the majority of patients treated with etanercept, adalimumab, or infliximab were not persistent with their index therapy (ie, they discontinued treatment, switched to a different biologic therapy, or restarted after a gap). Therapy gaps were common and 4%–11% of total costs per treated patient were attributed to restarting the index drug following a gap in therapy. This is consistent with prior work in the Medicaid population showing that adherence is low, premature discontinuation rates of TNF blockers are high, and suboptimal use of these drugs may be costly.26 Methods used to capture treatment patterns in this analysis were similar to work in the commercially insured population that followed patients on etanercept, adalimumab, or infliximab for 12 months and captured the number of patients that discontinued treatment, switched to a new therapy, or restarted treatment following a gap. Although prior work captured the number of patients who switched to any FDA-approved biologic, it only captured dose and costs after discontinuation for the most frequently prescribed biologics (etanercept, adalimumab, and infliximab).4
This study provides a comprehensive picture of biologic treatment costs for RA because it captures costs following discontinuation of the index treatment and incorporates switching to biologic agents approved by the FDA during the study period (etanercept, adalimumab, infliximab, abatacept, certolizumab, golimumab, rituximab). Total cost per treated patient includes both costs while persistent on treatment and costs attributed to the index drug following discontinuation (non-index costs), which were non-trivial for etanercept (16%), adalimumab (17%), and infliximab (11%). The results of this analysis may have broad implications in the context of transformations currently taking place in the Medicaid program, specifically in light of new federal mandates from the Patient Protection and Affordable Care Act for Medicaid expansion and the creation of new state-based and federally facilitated competitive marketplaces or Affordable Health Insurance Exchanges. The main goal of the Patient Protection and Affordable Care Act is to reduce the number of uninsured in the US by providing a continuum of affordable coverage options through Medicaid and the new Health Insurance Exchanges,27,28 effectively increasing the number of patients receiving government-sponsored health insurance. Since RA disproportionately impacts women29,30 and women comprise 69%31 of the adult Medicaid population, cost per treated patient in RA is an important metric for Medicaid plans.
Limitations
This analysis captured TNF blocker use and costs among RA patients using real-world data from a Medicaid health care claims database. There are no clinical data available on claims, so disease severity could not be evaluated. The absence of weight information increases the difficulty in capturing dose for infusion-administered drugs such as infliximab. This may impact treatment patterns and costs of TNF blockers. For the cohort of RA patients continuing on therapy, the total duration of treatment was unknown and may differ by index medication. Costs may differ based on concomitant or prior use of non-biologic DMARDs or corticosteroids, which were not included in this analysis. Due to sample size limitations, this analysis did not include certolizumab or golimumab as potential index medications, and future analyses should include these medications. Finally, these study results are limited to the Medicaid population that is captured in the MarketScan Multistate Medicaid Database and may not be generalizable to all state Medicaid programs, commercially insured patients, or patients without health care insurance.
Acknowledgment
George J Joseph was an employee of Amgen Inc. at the time of study completion, his current affiliation is Sanofi, Bridgewater, NJ, USA.
Disclosure
Truven Health Analytics was awarded a research contract by Amgen Inc. to conduct this study. Two authors (MB and NP) are employees of Truven Health Analytics. Two authors (DJH and NS) are employees and shareholders of Amgen Inc. One author (GJJ) was an employee of Amgen Inc. at the time the study was completed and is an Amgen Inc. shareholder.
References
Centers for Disease Control and Prevention. Rheumatoid arthritis. 2010. Available from: http://www.cdc.gov/arthritis/basics/rheumatoid.htm. Accessed May 5, 2014. | |
Helmick CG, Felson DT, Lawrence RC, et al; for the National Arthritis Data Workgroup. Estimates of the prevalence of arthritis and other rheumatic conditions in the United States: Part 1. Arthritis Rheum. 2008;58:15–25. | |
Murdaca G, Spano F, Puppo F. Long-term treatment of rheumatoid arthritis with adalimumab. Open Access Rheumatology. 2013;5:43–49. | |
Bonafede MM, Gandra SR, Watson C, et al. Cost per treated patient for etanercept, adalimumab, and infliximab across adult indications: a claims analysis. Adv Ther. 2012;29:234–248. | |
Schabert VF, Watson C, Gandra SR, et al. Annual costs of tumor necrosis factor inhibitors using real-world data in a commercially insured population in the United States. J Med Econ. 2012;15:264–275. | |
Bonafede M, Joseph GJ, Princic N, Harrison DJ. Annual acquisition and administration cost of biologic response modifiers per patient with rheumatoid arthritis, psoriasis, psoriatic arthritis, or ankylosing spondylitis. J Med Econ. 2013;9:1120–1128. | |
Immunex Corporation. Enbrel® (etanercept). Prescribing information. Thousand Oaks, CA, USA: Immunex Corporation; 2012. | |
Abbott Laboratories. Humira® (adalimumab). Prescribing information. North Chicago, IL, USA: Abbott Laboratories; 2012. | |
Centocor Ortho Biotech, Inc. Remicade® (infliximab). Prescribing information. Malvern, PA, USA: Centocor Ortho Biotech Inc.; 2011. | |
Fisher M, Polinski J, Servi A, et al. Prior authorization for biologic disease-modifying antirheumatic drugs: a description of US Medicaid programs. Arthritis Rheum. 2008;59:1611–1617. | |
Bullano MF, McNeeley BJ, Yu YF, et al. Comparison of costs associated with the use of etanercept, infliximab, and adalimumab for the treatment of rheumatoid arthritis. Manag Care Interface. 2006;19:47–53. | |
Etemad L, Yu EB, Wanke LA. Dose adjustment over time of etanercept and infliximab in patients with rheumatoid arthritis. Manag Care Interface. 2005;18:21–27. | |
Gilbert TD Jr, Smith D, Ollendorf DA. Patterns of use, dosing, and economic impact of biologic agent use in patients with rheumatoid arthritis: a retrospective cohort study. BMC Musculoskelet Disord. 2004;5:36. | |
Moots RJ, Haraoui B, Matucci-Cerinic M, et al. Differences in biologic dose-escalation, non-biologic and steroid intensification among three anti-TNF agents: evidence from clinical practice. Clin Exp Rheumatol. 2011;29:26–34. | |
Ollendorf DA, Klingman D, Hazard E, et al. Differences in annual medication costs and rates of dosage increase between tumor necrosis factor-antagonist therapies for rheumatoid arthritis in a managed care population. Clin Ther. 2009;31:825–835. | |
Blom M, Kievit W, Fransen J, et al. The reason for discontinuation of the first tumor necrosis factor (TNF) blocking agent does not influence the effect of a second TNF blocking agent in patients with rheumatoid arthritis. J Rheumatol. 2009;36:2171–2177. | |
Medicaid.gov. Cost sharing out of pocket costs. Available from: http://www.medicaid.gov/Medicaid-CHIP-Program-Information/By-Topics/Cost-Sharing/Cost-Sharing-Out-of-Pocket-Costs.html. Accessed May 5, 2014. | |
Medicare 2011 National Physician Fee Schedule Relative Value File, April 2012 Update. Available from: http://www.cms.gov/Medicare/Medicare-Fee-for-Service-Payment/PhysicianFeeSched. Accessed June 3, 2014. | |
Schabert VF, Bruce B, Ferrufino CF, et al. Disability outcomes and dose escalation with etanercept, adalimumab, and infliximab in rheumatoid arthritis patients: a US-based retrospective comparative effectiveness study. Curr Med Res Opin. 2012;28:569–580. | |
Bonafede MM, Gandra SR, Fox KM, et al. Tumor necrosis factor blocker dose escalation among biologic naive rheumatoid arthritis patients in commercial managed-care plans in the 2 years following therapy initiation. J Med Econ. 2012;15:635–643. | |
Bartelds GM, Krieckaert CL, Nurmohamed MT, et al. Development of antidrug antibodies against adalimumab and association with disease activity and treatment failure during long-term follow-up. JAMA. 2011;305:1460–1468. | |
Agarwal SK, Maier AL, Chibnik LB, et al. Pattern of infliximab utilization in rheumatoid arthritis patients at an academic medical center. Arthritis Rheum. 2005;53:872–878. | |
Berger A, Edelsberg J, Li TT, et al. Dose intensification with infliximab in patients with rheumatoid arthritis. Ann Pharmacother. 2005;39:2021–2025. | |
Wu E, Chen L, Birnbaum H, et al. Retrospective claims data analysis of dosage adjustment patterns of TNF antagonists among patients with rheumatoid arthritis. Curr Med Res Opin. 2008;24:2229–2240. | |
Ogale S, Hitraya E, Henk HJ. Patterns of biologic agent utilization among patients with rheumatoid arthritis: a retrospective cohort study. BMC Musculoskelet Disord. 2011;12:204. | |
Li P, Blum, M, Von Feldt J, et al. Adherence, discontinuation, and switching of biologic therapies in medicaid enrollees with rheumatoid arthritis. Value Health. 2010;13:805–812. | |
Holahan J, Buettgens M, Carroll C, Dorn S. The cost and coverage implications of the ACA Medicaid expansion: national and state-by-state analysis. The Urban Institute, 2012. Available from: http://www.kff.org/medicaid/upload/8384.pdf. Accessed November 17, 2012. | |
Department of Health and Human Services, Centers for Medicare and Medicaid Services. Frequently asked questions on exchanges, market reforms and Medicaid. December 10, 2012. Available from: http://www.medicaid.gov/State-Resource-Center/Frequently-Asked-Questions/Downloads/Governor-FAQs-12-10-12.pdf. Accessed December 18, 2012. | |
Iikuni N, Sato E, Hoshi M, et al. The influence of sex on patients with rheumatoid arthritis in a large observational cohort. J Rheumatol. 2009;36:508–511. | |
Tengstrand B, Ahlmén M, Hafström I. The influence of sex on rheumatoid arthritis: a prospective study of onset and outcome after 2 years. J Rheumatol. 2004;31:214–222. | |
American Congress of Obstetricians and Gynecologists. Protect Medicaid and Women’s Health. Available from: http://www.acog.org/~/media/Departments/Government%20Relations%20and%20Outreach/2012ProtectMedicaid.pdf. Accessed November 17, 2012. |
 © 2014 The Author(s). This work is published and licensed by Dove Medical Press Limited. The full terms of this license are available at https://www.dovepress.com/terms.php and incorporate the Creative Commons Attribution - Non Commercial (unported, v3.0) License.
By accessing the work you hereby accept the Terms. Non-commercial uses of the work are permitted without any further permission from Dove Medical Press Limited, provided the work is properly attributed. For permission for commercial use of this work, please see paragraphs 4.2 and 5 of our Terms.
© 2014 The Author(s). This work is published and licensed by Dove Medical Press Limited. The full terms of this license are available at https://www.dovepress.com/terms.php and incorporate the Creative Commons Attribution - Non Commercial (unported, v3.0) License.
By accessing the work you hereby accept the Terms. Non-commercial uses of the work are permitted without any further permission from Dove Medical Press Limited, provided the work is properly attributed. For permission for commercial use of this work, please see paragraphs 4.2 and 5 of our Terms.