")
Back to Journals » Clinical Interventions in Aging » Volume 9
Correlation between nutritional status and comprehensive physical performance measures among older adults with undernourishment in residential institutions
Authors Singh D , Abdul Manaf Z, Yusoff NAM, Muhammad NA, Phan MF, Shahar S
Received 27 March 2014
Accepted for publication 6 June 2014
Published 25 August 2014 Volume 2014:9 Pages 1415—1423
DOI https://doi.org/10.2147/CIA.S64997
Checked for plagiarism Yes
Review by Single anonymous peer review
Peer reviewer comments 3
Devinder KA Singh,1 Zahara A Manaf,2 Noor Aini M Yusoff,3 Nur A Muhammad,2 Mei Fang Phan,1 Suzana Shahar2
1Physiotherapy Program, School of Rehabilitation Sciences, 2Nutrition and Dietetics Program, School of Health Care Sciences, Universiti Kebangsaan Malaysia, Kuala Lumpur, 3ASIA Metropolitan University, Cheras, Malaysia
Purpose: The consequences of combined undernourishment and decreased physical performance in older adults are debilitating and increases cost of care. To date, the information regarding the association between nutritional status and physical performance does not provide a complete picture. Most studies used limited or self-reported measures to evaluate physical performance. The objective of this study was to examine the correlation between nutritional status and comprehensive physical performance measures among undernourished older adults who reside in residential institutions.
Methods: Forty-seven older adults (26 males, 21 females) aged ≥60 (69.23±8.63) years who were identified as undernourished from two residential institutions participated in this study. A battery of physical performance tests (10 m gait speed test, dominant hand grip strength test, timed five-repetition sit-to-stand test, ten step test, arm curl test, scratch test, and respiratory muscle strength test), biochemical profiles (serum albumin, hemoglobin, serum ferritin, and prealbumin levels), and falls risk using the short-form Physiological Profile Approach were performed. The Functional Ability Questionnaire and Geriatric Depression Scale were also administered.
Results: The results demonstrated that generally older adults with undernourishment scored poorly on the physical performance tests, had depression, and a high risk of falls. Biochemical results demonstrated that 10.9% of the participants were anemic, 63% had hypoalbuminemia (<3.5 g/dL), and 21.7% were at risk of protein energy malnutrition with prealbumin level (100–170 mg/L). A significant correlation (P<0.05) was demonstrated between hand grip strength and ferritin, between self-reported mobility dependence and prealbumin levels, and between self-reported mobility tiredness and body mass index.
Conclusion: These results confirm that older adults with undernutrition have poor physical function, higher falls risk, and depression. Clinically, overall health that includes nutritional status, physical function, and depression level should be taken into consideration in the assessment and treatment of older adults residing at residential institutions.
Keywords: undernutrition, physical performance, falls risks, older adults
Introduction
Undernutrition has emerged as a common phenomenon globally among older adults. Undernourishment is defined as “a nutrition state in which a deficiency of one or more essential nutrients causes measurable adverse effects on tissue/body form (body shape, size, and composition) and function, and clinical outcome.”1 The prevalence of undernourishment among older adults varies depending on the study settings. A study involving data from 12 countries examining undernutrition among older adults from different settings reported an overall undernourishment prevalence of approximately 23%.2 Generally, older adults living in residential institutions were found to have a higher risk of undernourishment.3,4 For example, approximately 67% older adults in nursing homes were found to be undernourished.2
Similar trends of undernutrition among older adults have been reported in government-funded residential institutions in Malaysia.5,6 Previous studies have demonstrated that 14%–17% of older adults in these residential institutions are undernourished.6,7 This scenario is asserted to exist as older adults in such residential institutions are mostly from rural areas with poor education, already lower financial support, and poor social- and family-supported backgrounds.7,8 These are some of the predisposing risk factors that may lead to undernutrition among older adults. There is also a probability that these older adults may already be undernourished before admission to the residential institutions.
Undernutrition and aging is associated with progressive deterioration of health and physical performance in older adults.9–12 This leads to dependency in activities of daily living, poor quality of life, and further decrease in physical activities.13,14 Physical functional performance is defined as the ability to perform optimum function through effective movements achieved with the integration of the cardiovascular, musculoskeletal, and neuromuscular systems.15 Prerequisites to optimum physical performance include muscle strength, muscle and cardiovascular endurance, flexibility, fitness, agility, and balance.
Nutritional status also acts as a determination factor for physical performance with aging.16–18 Nutritional status has been reported to deteriorate with aging, partly due to the loss of muscle mass and declined food intake.19 Physiologically, undernutrition causes depletion of body fat stores, muscle wasting,20 and symptoms such as fatigue or tiredness.21 Deterioration of these prerequisites of optimum physical function results in poorer physical performance measured either using self-reported or performance measures among older adults with undernutrition.22,23
Undernutrition is also one of the intrinsic risk factors that can result in falls among older adults.24 Approximately, two-fifths of undernourished older patients were demonstrated to have experienced one or more falls in the last year.25 However, assessment of nutritional status is rarely performed among older adult fallers.26 There is a positive relationship between falls and undernutrition among older adults that are hospitalized or residing at care homes.10,26 In contrast, this was not applicable to community-dwelling older adults.27
The consequences of combined undernutrition and decreased physical performance, fatigue, and increased risk of falls among older adults can be debilitating. This will further increase the cost of long-term care for the aging population. Hence, nutritional status is an important factor that has to be considered in relation to physical performance, fatigue, and falls in older adults.28,29 To date, the information regarding the association between nutritional status, physical function, fatigue, and falls does not provide a complete picture. Most studies used limited or self-reported measures to evaluate physical function.22,30,31 Performance-based measures are required since it evaluates physical function in a more objective way, provides higher test sensitivity, and executes real effort from participants to perform a variety of tasks.32 Therefore, the aim of this study was to examine the correlation between nutritional status and comprehensive physical performance measures among undernourished older adults who reside in residential institutions.
Materials and methods
This cross-sectional study involved older adults from two residential institutions in Malaysia, aged ≥60 years. Flyers regarding this study were distributed at these two centers and the residents who volunteered were assessed by a dietitian a week before the other tests were performed. Participants who were identified as undernourished by a dietitian using Subjective Global Assessment and had a body mass index (BMI) <22 kg/m2 were recruited to participate in this study. Subjective Global Assessment was assessed using a combination of subjective assessment of weight and appetite changes, gastrointestinal symptoms, functional ability, and metabolic stress as well as physical examination of the evidence of muscle and fat loss. Based on these criteria, the assessor subjectively rated the participants as normal or malnourished (mild-to-moderate and severe).33 Participants with mild-to-moderate and severe malnutrition and a BMI <22 kg/m2 were categorized as undernourished. Participants were excluded if they had the following conditions: cancer, uncontrolled diabetic, unable to eat orally, having renal failure, bedridden or unable to walk, uncontrolled blood pressure, and dementia. Written and verbal information was provided to the participants before obtaining an informed consent. Ethical approval and permission was obtained from the Secretariat for Research and Ethics of Universiti Kebangsaan Malaysia (NN-104-2010) and Department of Social Welfare, Malaysia, respectively.
The height and weight of participants was measured using a Seca portable Leicester stadiometer (Seca GmbH, Hamburg, Germany) and Tanita HD-306 (Tanita Corporation, Tokyo, Japan), respectively. The Malay version of the Geriatric Depression Scale (GDS; scores from 0–15) was used to measure depression.34 Biochemical profiles consisting of serum albumin, hemoglobin, serum ferritin, and prealbumin levels were obtained from 10 mL venous blood samples taken by phlebotomists from Gribbles Pathology (Malaysia) Sdn. Bhd. Blood samples were collected into an ethylenediaminetetraacetic acid tube and all the analysis except for prealbumin were carried out at Gribbles Pathology (Malaysia) Sdn. Bhd. using rocket immunoelectrophoresis (Hoffman-La Roche Ltd., Basel, Switzerland). A 3 mL blood sample was collected into an ethylenediaminetetraacetic acid tube for prealbumin analysis and the serum prealbumin levels were determined by rocket immunoelectrophoresis.
Physical performance tests
Participants were instructed to perform a battery of physical performance tests with at least a 10-minute rest between each test, administered by trained final year physiotherapist undergraduates.
10 m gait speed test
Participants were required to walk a standard distance of a 20 m pathway (5 m of acceleration, 10 m of steady walk, and 5 m of deceleration). Markers were placed at the start (5 m) and finish (15 m) and participants started walking at their own comfortable speed. The time was recorded from when the participants’ foot crossed the start line to when the participant’s second foot crossed the finished line. Three repetitions were carried out with a rest of 5 minutes in between each test and the average time of three tests was calculated. Distance walked (m) divided by the time (seconds) provided the gait speed (m/second).
Dominant hand grip strength test
Hand grip strength was measured by instructing participants to hold a Jamar® hand dynamometer (Patterson Medical Holdings, Inc, Warrenville, IL, USA) in their dominant hand palm with the handle on the middle of their four fingers. The arm was positioned at a 90 degree angle, with the elbow at the side of the body. Participants were then instructed to squeeze the hand as hard as possible, maintaining the squeeze for 5 seconds. The reading taken was in unit kg.
Timed five-repetition sit-to-stand test
This test was performed with participants sitting on a chair (42 cm height and 47.5 cm depth) with their arms crossed and back leaning on the back of the chair. The participants were instructed to sit and stand five times as quickly as they could. The time taken for five sit-to-stand repetitions was recorded in seconds using a stopwatch.
Ten step test
The ten step test is a valid and reliable modified agility test for older adults.35 Participants were instructed to step one foot onto a block (10 cm height) and then quickly place the foot down on the floor and repeat again with the alternate foot. The time taken to complete ten repetitions of the movement was recorded. The ten step test was conducted twice with a 5-minute rest in between after a preparation trial; the quickest time of the two trials was used for analysis. If the participant failed to perform the task accurately, the test was repeated.
Arm curl test
This test measures strength and endurance of upper limbs in older adults. The test–retest reliability for the arm curl test under the senior fitness test has shown good reliability with an intraclass correlation coefficient of 0.96.36 Participants were asked to sit on a chair and do as many arm curls in 30 seconds holding a weight (2.3 kg and 3.6 kg for women and men, respectively) in their hand with their palms up and arms at the side of the body. The arms must be fully flexed (ie, touching the examiner’s hand that was placed on the participants’ biceps) and fully extended during the test.37 The number of arm curls was recorded.
Scratch test
This test measures upper limb flexibility in older adults.37 The test–retest reliability for the scratch test under the senior fitness test has shown good reliability with an intraclass correlation coefficient of 0.98.36 Participants were required to place one arm over their shoulder (preferred side) and the other behind the back and try to reach as close as possible trying to touch the fingers of both hands. The distance between the middle fingers was measured using a tape measure and recorded in cm.
Respiratory muscle strength test
Respiratory muscle strength was measured using a respiratory pressure meter (Micro Medical Ltd, Kent, UK) with the participant sitting on a chair. The method used in a previous study38 was used. The test was demonstrated to the participants and they were allowed a trial session before the actual test. Participants had their nose clamped and were instructed to inhale with their mouth sealed around the respiratory pressure meter mouthpiece. For maximal inspiratory pressure, participants were instructed to “slowly exhale completely and then inhale hard like you are sucking in milkshake.” Participants had to maintain inspiratory pressure for 1.5 seconds. The highest negative pressure maintained for approximately 1 second was recorded via computer software (Puma; Micro Medical Ltd). The test was repeated three times with a 1-minute rest between tests. For maximal expiratory pressure, participants were instructed to “slowly inhale completely and then exhale hard.” The highest positive pressure maintained for approximately 1 second was recorded via the computer software. The test was repeated three times with a 1-minute rest between tests. The mean value of the three measurements was taken as the measurements of maximal inspiratory pressure and maximal expiratory pressure in cm H2O.
Falls risk using the Physiological Profile Approach
Falls assessment was performed using the short-form Physiological Profile Approach (PPA). The short-form PPA comprises five physiological tests on vision, peripheral sensation, muscle force, reaction time, and balance.39 The accuracy of identifying older adult fallers using PPA has been reported as high as 79%. The reliability of all five tests was demonstrated to have an intraclass correlation coefficient of 0.51–0.97.39 Participants were required to perform the five tasks. The measurements were recorded in the web-based program FallScreen® computer software (Neuroscience Research Australia, Randwick, Australia). This program was developed from large-scale studies and provides an individual’s falls risk in relation to age-matched normative data.
Fatigue level using the Functional Ability Questionnaire
The Functional Ability Questionnaire was used to measure fatigue or tiredness levels when performing activities of daily life.40 Questions asked were about fatigue levels and the level of help needed when performing 16 daily activities, which indicates the mobility of the trunk, upper and lower limbs. Fatigue level and the level of help needed that is not reduced is coded as one while zero is coded for the opposite result. A higher score value describes better function while a lower score value describes poorer function.40 This questionnaire was back-to-back translated into a Malay version by the researchers. Fifteen older adults who could read and comprehend both English and Malay answered both versions of the questionnaire after a 1-day lapse. Cronbach’s α was calculated to be 0.89 for the two questionnaires, and the Malay version was considered to be reliable to be used in this study.
Data analysis
Data were analyzed using SPSS® version 19 (IBM Corporation, Armonk, NY, USA). The correlation between nutritional status, physical performance, falls risk, and fatigue level was assessed using Pearson’s correlation for normally distributed data and Spearman’s rank correlation for not normally distributed data. A statistical significance level of P<0.05 was used.
Results
Forty-seven participants (men: n=26; women: n=21) who were identified as undernourished participated in this study. Demographic characteristics and participants’ physical performance data are presented in Tables 1 and 2, respectively. These results are provided according to sex because sex differences in the average scores are expected for many of the parameters. Falls risk profiles of the participants that were measured using PPA are depicted in Figure 1.
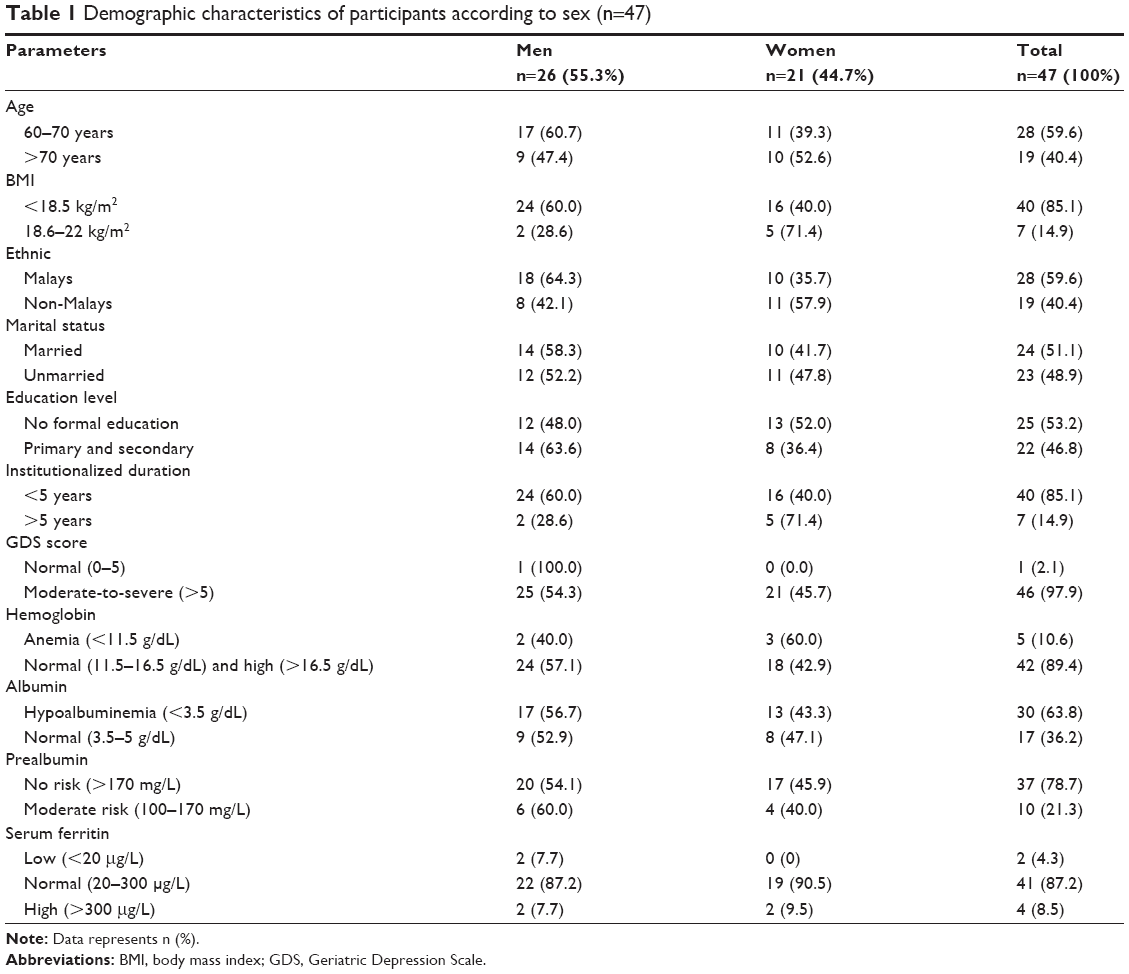 | Table 1 Demographic characteristics of participants according to sex (n=47) |
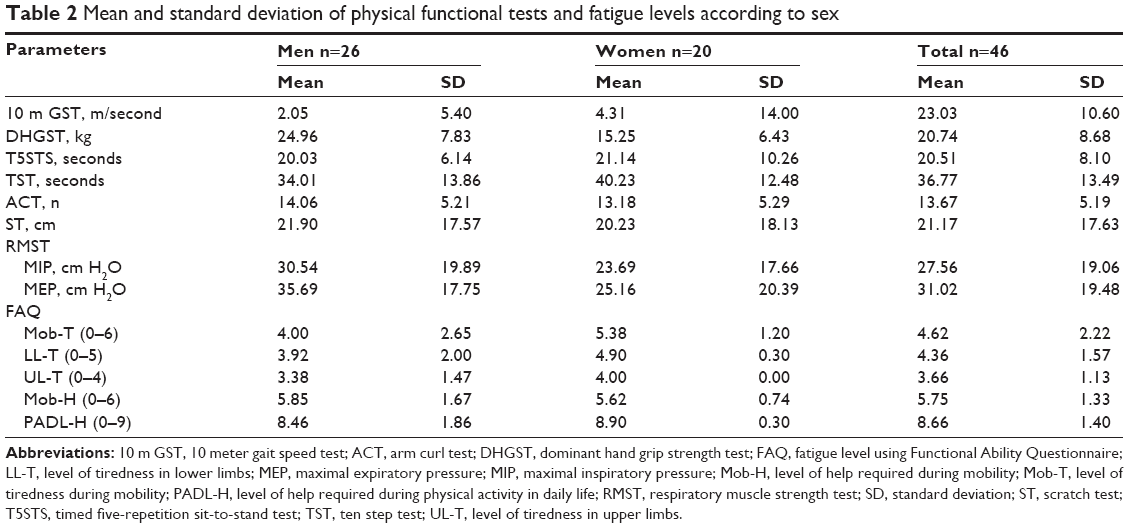 | Table 2 Mean and standard deviation of physical functional tests and fatigue levels according to sex |
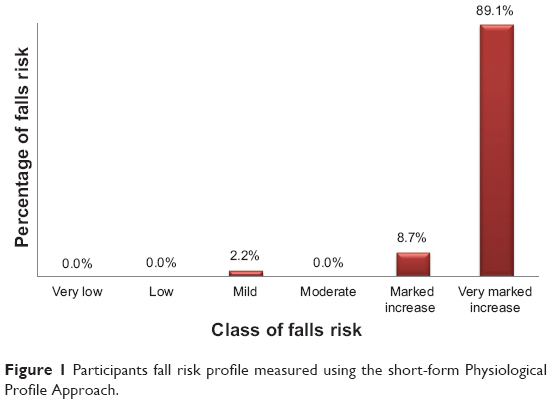 | Figure 1 Participants fall risk profile measured using the short-form Physiological Profile Approach. |
Approximately 98% of the participants had depression according to the GDS score and were recorded as having a marked-to-very marked risk of falls. Biochemical results demonstrated that 10.9% of the participants were anemic, 63% had hypoalbuminemia (<3.5 g/dL), and 21.7% were at risk of protein energy malnutrition with prealbumin level (100–170 mg/L).
A significant correlation (P<0.05) was only demonstrated between hand grip strength and ferritin and between self-reported mobility dependence and prealbumin levels (Table 3). A negative significant correlation (P<0.01) was found between self-reported mobility tiredness and BMI (Table 3).
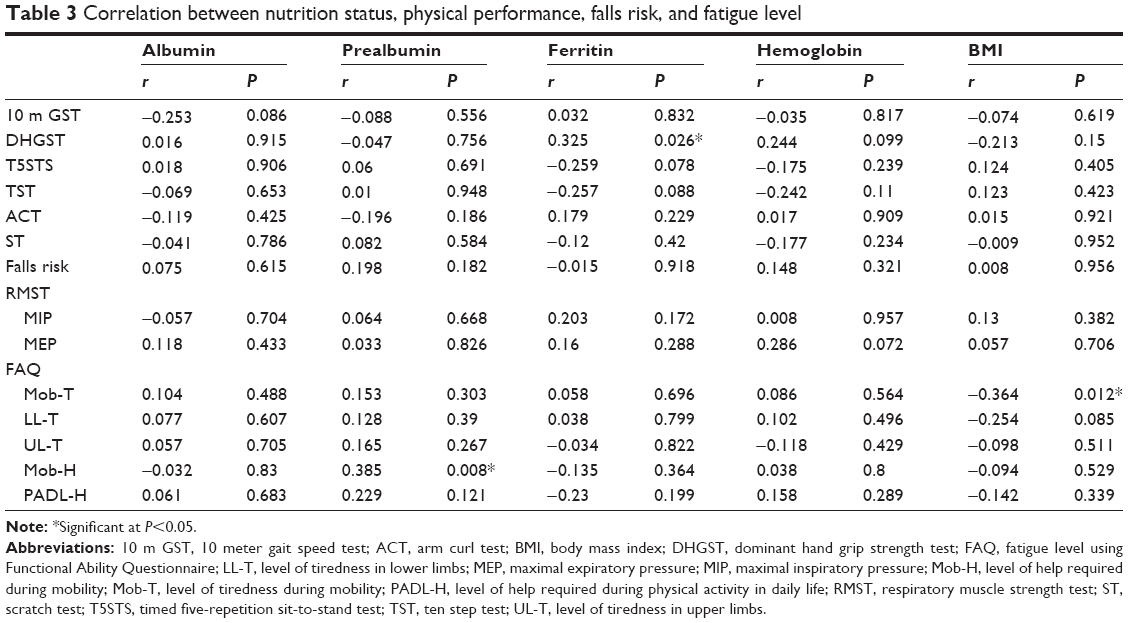 | Table 3 Correlation between nutrition status, physical performance, falls risk, and fatigue level |
The Mahalanobis distance value for all variables was below eleven. A general linear regression was performed separately for both hand grip strength and ferritin as the dependent variables, with age, sex, and GDS score included as the independent variables. No significant (P>0.05) relationship was demonstrated for either hand grip strength or ferritin with age, sex, and GDS score.
Discussion
The objective of this study was to examine the relationship between nutritional status, physical function, fatigue level, and falls among older adults with undernourishment living in residential institutes. This is the first study that included a performance-based comprehensive physical function assessment that comprised of gait speed, upper and lower limb strength, agility, flexibility, respiratory muscle strength, and fall risks. Fatigue levels were examined using the Functional Ability Questionnaire. The results demonstrate that there was a significant positive correlation between hand grip strength and ferritin and between self-reported mobility dependence and prealbumin levels. A significant negative correlation was also found between self-reported mobility tiredness and BMI.
Most physical functional measures were found to be reduced among older adults with undernourishment in this study. This group was noted to have below average scores compared to the aged-matched population-based normative hand grip data.41 Based on the average range of 11.4 seconds for the timed five-repetition sit-to-stand test in older adults aged 60–69 years,42 approximately 80% of older adults with undernourishment scored below this average range for lower limb strength. Similarly, respiratory muscle strength also exhibited a significant reduction in both men and women in comparison to respiratory muscle strength scores of healthy older adults reported in an earlier study.38
Muscle endurance measured using the arm curl test and flexibility measured using the scratch test were 40% and 75% below average values, respectively, documented in a previous study37 in both men and women. Approximately, two-fifths of older adults with undernourishment in the present study scored below the known norm of preferred gait speed for men (0.95 m/second) and women (0.87 m/second) aged 60–69 years.43 Poor performance was also noted on the agility test. The time taken to complete this test was noted to be approximately five-to-six times higher that of the average time taken by age-matched healthy Japanese older adults who scored a mean ± standard deviation of 6.68±1.05 seconds.35 The reason for this may be due to impairments in the prerequisites for agility, which includes muscle strength and balance ability. It is noteworthy that older adults with undernourishment in the present study also scored poorly in lower limb strength using the timed five-repetition sit-to-stand test and balance ability in the falls risk test using PPA.
Older adults with undernourishment in the present study were not experiencing tiredness in activities of daily living. Self-reported fatigue has been linked to poor health among older adults.40 In healthy people, including older adults, fatigue was seen to be decreased.44 Theoretically, someone with undernourishment would be lacking raw material to produce energy and this can lead to fatigue. Fatigue is a broad term and the results of the present study using a self-administered questionnaire may have been prejudiced by perceptions that fatigue was related to physical loads. This was contrary to the physical lifestyle of these older adults. It was noted that most of the older adults in these residential institutions were sitting around, reading newspapers, watching television, or chatting with friends.
In older adults with undernourishment, decreased physical performance can be expected as undernutrition is known to have a negative effect on most organ systems.45 The results of the present study demonstrating poor physical performance among older adults with undernourishment are corroborated by the study results of previous studies.46,47 Hand grip strength was significantly correlated with ferritin (r=0.325; P=0.026) in the present study. A deficiency in ferritin or iron can result in impaired work performance by promoting skeletal muscle fatigue.48 The benefits of iron supplementation on physical performance are apparent as it decreases blood lactate concentration and increases oxygen uptake.49,50
It has been reported that an unintentional ≥15% loss of body weight can lead to decreased muscle strength and respiratory function, reduction in physical fitness, and an increased risk of depression.11,51 This may explain the present results demonstrating a significant correlation between hand grip strength and ferritin and between self-reported mobility dependence and prealbumin levels. A negative significant correlation (P<0.01) was also found between self-reported mobility tiredness and BMI. Similarly, it was shown that older adults with poorer muscle endurance perceived higher fatigue levels in their daily life.52
Ninety-eight percent of the older adults in the present study had a marked-to-very marked increase risk of falls, measured using PPA. These results can be expected as undernourishment, depression, and poor health are identified risk factors related to falls and poor physical performance.10,26,28,53 Falls were reported to be lower in protein/energy-supplemented older adults.54 Moreover, hospitalized undernourished older adults were found to have fewer falls after being discharged with combined energy- and protein-enriched supplements, oral nutritional supplements, calcium/vitamin D supplements, and follow-up with telephone counseling by a dietitian.55
Based on GDS scoring, it can be deduced that the mental health of older adults with undernourishment in the present study was affected. An association between depression, physical performance, and poor nutritional status has been reported among older adults in the literature.52,56 Depression has been found to be a strong mediator in older adults with undernutrition.56,57 Similarly, depression is also a risk factor for poor physical function.58 Moreover, management of depression among older adults resulted in improved physical performance.59
The strength of the present study is that a comprehensive physical performance assessment was performed. The reason for a comprehensive physical performance assessment was due to controversial results in the literature using different physical performance measurements. It should also be noted that falls risk was measured by a composite score, assessed using PPA compared to self-reported methods in previous studies. The limitation of this study is that the daily physical activity of older adults with undernourishment was not taken into consideration. However, participants in the present study had a similar routine of daily living activities. In addition, post hoc analysis demonstrated that for a correlation of 0.325, P<0.05, and a sample size of 47, the statistical power of this study was only 0.73. A sample size of 57 was required to provide a statistical power of 0.80.
Future studies should consider a larger sample size and older adults with undernourishment from different settings. This will be useful for generalization of the study results. Further research employing similar work to examine the effectiveness of interventions among older adults with undernourishment is also desirable.
Conclusion
This study confirms and adds to the knowledge that older adults with undernourishment have poor physical performance, higher risk of falls, and depression. The association between malnutrition, physical performance, fatigue level, and falls risk among older adults is intricate and the causal relationship is still unclear. Hence, it is important to consider the overall health in the care of older adults in residential homes that includes their nutritional status, physical performance, and psychological issues such as depression.
Acknowledgments
The authors would like to thank all the participants and the management of the senior citizen’s residential homes for their cooperation. Funding for this research was provided by a grant from Kotra Pharma (M) Sdn Bhd.
Disclosure
The authors report no conflicts of interest in this work.
References
Elia M. Guidelines for the Detection and Management of Malnutrition. Maidenhead: British Association for Parenteral and Enteral Nutrition; 2000. | ||
Kaiser MJ, Bauer JM, Ramsch C, et al. Frequency of malnutrition in older adults: a multinational perspective using the mini nutritional assessment. J Am Geriatr Soc. 2010;58(9):1734–1738. | ||
Patel MD, Martin FC. Why don’t elderly hospital inpatients eat adequately? J Nutr Health Aging. 2008;12(4):227–231. | ||
Soini H, Muurinen S, Routasalo P, et al. Oral and nutritional status: is the MNA a useful tool for dental clinics? J Nutr Health Aging. 2006;10(6): 495–499. | ||
Chen ST, Ngoh HJ, Harith S. Prevalence of malnutrition among institutionalized elderly people in Northern Peninsular Malaysia: gender, ethnicity, and age specific. Sains Malaysiana. 2012;41(1):141–148. | ||
Suzana S, Earland J, Suriah AR, Warnes AM. Social and health factors influencing poor nutritional status among rural elderly Malays. J Nutr Health Aging. 2002;6(6):363–369. | ||
Visvanathan R, Zaiton A, Sherina MS, Muhamad YA. The nutritional status of 1,081 elderly people residing in publicly funded shelter homes in Peninsular Malaysia. Eur J Clin Nutr. 2005;59(3):318–324. | ||
Shahar S, Earland J, Rahman SA. Social and health profiles of rural elderly Malays. Singapore Med J. 2001;42(5):208–213. | ||
Margetts BM, Thompson RL, Elia M, Jackson AA. Prevalence of risk of undernutrition is associated with poor health status in older people in the UK. Eur J Clin Nutr. 2003;57(1):69–74. | ||
Vivanti A, Ward N, Haines T. Nutritional status and associations with falls, balance, mobility, and functionality during hospital admission. J Nutr Health Aging. 2011;15(5):388–391. | ||
Allison SP. Malnutrition, disease, and outcome. Nutrition. 2000;16(7–8): 590–593. | ||
Toraman NF, Ayceman N. Effects of 6 weeks of detraining on retention of functional fitness of old people after 9 weeks of multicomponent training. Br J Sports Med. 2005;39(8):565–568. | ||
Papparotto C, Bidoli E, Palese A. Risk factors associated with malnutrition in older adults living in Italian nursing homes: a cross-sectional study. Res Gerontol Nurs. 2013;6(3):187–197. | ||
Chen CC, Schilling LS, Lyder CH. A concept analysis of malnutrition in the elderly. J Adv Nurs. 2001;36(1):131–142. | ||
Cress ME, Buchner DM, Questad KA, Esselman PC, deLateur BJ, Schwartz RS. Continuous-scale physical functional performance in healthy older adults: a validation study. Arch Phys Med Rehabil. 1996; 77(12):1243–1250. | ||
Alipanah N, Varadhan R, Sun K, Ferrucci L, Fried LP, Semba RD. Low serum carotenoids are associated with a decline in walking speed in older women. J Nutr Health Aging. 2009;13(5):170–175. | ||
Cesari M, Pahor M, Bartali B, et al. Antioxidants and physical performance in elderly persons: the Invecchiare in Chianti (InCHIANTI) study. Am J Clin Nutr. 2004;79(2):289–294. | ||
Houston DK, Stevens J, Cai J, Haines PS. Dairy, fruit, and vegetable intakes and functional limitations and disability in a biracial cohort: the Atherosclerosis Risk in Communities Study. Am J Clin Nutr. 2005; 81(2):515–522. | ||
Volkert D. Malnutrition in the elderly – prevalence, causes, and corrective strategies. Clin Nutr. 2002;21(Suppl 1):110–112. | ||
Vellas B, Baumgartner RN, Wayne SJ, et al. Relationship between malnutrition and falls in the elderly. Nutrition. 1992;8(2):105–108. | ||
Furman EF. Undernutrition in older adults across the continuum of care: nutritional assessment, barriers, and interventions. J Gerontol Nurs. 2006;32(1):22–27. | ||
Ferdous T, Cederholm T, Razzaque A, Wahlin A, Nahar Kabir Z. Nutritional status and self-reported and performance-based evaluation of physical function of elderly persons in rural Bangladesh. Scand J Public Health. 2009;37(5):518–524. | ||
Kiesswetter E, Pohlhausen S, Uhlig K, et al. Malnutrition is related to functional impairment in older adults receiving home care. J Nutr Health Aging. 2013;17(4):345–350. | ||
Johnson CS. The association between nutritional risk and falls among frail elderly. J Nutr Health Aging. 2003;7:247–250. | ||
Saka B, Kaya O, Ozturk GB, Erten N, Karan MA. Malnutrition in the elderly and its relationship with other geriatric syndromes. Clin Nutr. 2010;29(6):745–748. | ||
Baker-Venturini M, Sucher K, Fee C. Nutrition status as a risk factor for falls among older adults. J Am Diet Assoc. 2011;111(9):A108. | ||
Isenring E, Baker J, Kerr G. Malnutrition and falls risk in community-dwelling older adults. J Nutr Health Aging. 2013;17(3):277–279. | ||
Lin CH, Liao KC, Pu SJ, Chen YC, Liu MS. Associated factors for falls among the community-dwelling older people assessed by annual geriatric health examinations. PLoS One. 2011;6(4):e18976. | ||
Sakato Y, Tanabe K, Nishijima T, Fukunaga T, Kuno S. Relationships between nutrition intake status, nutritional condition, and physical fitness in elderly women. Int J Sport Health Sci. 2006;4(Special Issue 2):544–554. | ||
Sharkey JR. The interrelationship of nutritional risk factors, indicators of nutritional risk, and severity of disability among home-delivered meal participants. Geontologist. 2004;42(3):373–380. | ||
Tomey KM, Sowers MR, Crandall C, Johnston J, Jannausch M, Yosef M. Dietary intake related to prevalent functional limitations in mid-life women. Am J Epidemiol. 2008;167(8):935–943. | ||
Curb JD, Ceria-Ulep CD, Rodriguez BL, et al. Performance-based measures of physical function for high-function populations. J Am Geriatr Soc. 2006;54(5):737–742. | ||
Detsky AS, McLaughlin JR, Baker JP, et al. What is subjective global assessment of nutritional status? J Parenter Enteral Nutr. 1987;11(1): 8–13. | ||
Teh EE, Hasanah CI. Validation of Malay version of Geriatric Depression Scale among elderly inpatients. 2004. Available from: http://www.priory.com/psych/MalayGDS.htm. Accessed August 5, 2014. | ||
Miyamoto K, Takebayashi H, Takimoto K, Miyamoto S, Morioka S, Yagi F. A new simple performance test focused on agility in elderly people: the ten step test. Gerontology. 2008;54(6):365–372. | ||
Miotto JM, Chodzko-Zajko WJ, Reich JL, Supler MM. Reliability and validity of the Fullerton functional fitness test: an independent replication study. J Aging Phys Act. 1997;7(4):339–353. | ||
Rikli RE, Jones CJ. Development and validation of a functional fitness test for community-residing older adults. J Aging Phys Act. 1999;7(2): 129–161. | ||
Enright PL, Kronmal RA, Manolio TA, Schenker MB, Hyatt RE. Respiratory muscle strength in the elderly. Correlates and reference values. Am J Respir Crit Care Med. 1994;149(2 Pt 1):430–438. | ||
Lord SR, Menz HB, Tiedemann A. A physiological profile approach to falls risk assessment and prevention. Phys Ther. 2003;83(3): 237–252. | ||
Avlund K. Fatigue in older adults: an early indicator of the aging process? Aging Clin Exp Res. 2010;22(2):100–115. | ||
Massy-Westropp NM, Gill TK, Taylor AW, Bohannon RW, Hill CL. Hand grip strength: age and gender stratified normative data in a population-based study. BMC Res Notes. 2011;4:127. | ||
Bohannon RW. Reference values for the five-repetition sit-to-stand test: a descriptive meta-analysis of data from elders. Percept Mot Skills. 2006;30(1):215–222. | ||
Bohannon RW. Gait performance with wheeled and standard walkers. Percept Mot Skills. 1997;85(3 Pt 2):1185–1186. | ||
Watt T, Groenvold M, Bjorner JB, Noerholm V, Rasmussen NA, Bech P. Fatigue in the Danish general population. Influence of sociodemographic factors and disease. J Epidemiol Community Health. 2000;54(11):827–833. | ||
Silberman H. Consequences of malnutrition. In: Silberman H, editor. Parenteral and Enteral Nutrition. Norwalk, CT: Appleton and Lange; 1989:1–18. | ||
Bianchetti A, Rozzini R, Carabellese C, Zanetti O, Trabucchi M. Nutritional intake, socioeconomic conditions, and health status in a large elderly population. J Am Geriatr Soc. 1990;38(5):521–526. | ||
Sem SW, Nes M, Engedal K, Pederson JI, Trygg K. An attempt to identify and describe a group of non-institutionalized elderly with the lowest nutritional score. Compr Gerontol A. 1988;2(2):60–66. | ||
Centers for Disease Control and Prevention. Recommendations to prevent and control iron deficiency in the United States. MMWR Recomm Rep. 1998;47(RR-3):1–29. | ||
Gardner GW, Edgerton VR, Barnard RJ, Bernauer EH. Cardiorespiratory, hematological, and physical performance responses of anemic subjects to iron treatment. Am J Clin Nutr. 1975;28(9):982–988. | ||
Hilton PS, Giordano C, Brownlie T, Haas JD. Iron supplementation improves endurance after training in iron-depleted, nonanemic women. J Appl Physiol (1985). 2000;88(3):1103–1111. | ||
Thompson A, Damaniovich A, Madapallipattam A, Mikalus D, Allard J, Jeejeebhoy KN. 31P-nuclear magnetic resonance studies of bioenergetic changes in skeletal muscle in malnourished human adults. Am J Clin Nutr. 1998;67(1):39–43. | ||
Bautmans I, Njemini R, Predom H, Lemper JC, Mets T. Muscle endurance in elderly nursing home residents is related to fatigue perception, mobility, and circulating tumor necrosis factor-α, interleukin-6, and heat shock protein 70. J Am Geriatr Soc. 2008;56(3):389–396. | ||
Todd C, Skelton D. What are the Main Risk Factors for Falls Among Older People and What are the Most Effective Interventions to Prevent These Falls? Copenhagen: WHO Regional Office for Europe; 2004. Available from: http://www.euro.who.int/document/E82552.pdf. Accessed July 16, 2014. | ||
Gray-Donald K, Payette H, Boutier V. Randomized clinical trial of nutritional supplementation shows little effect on functional status among free-living frail elderly. J Nutr. 1995;125(12):2965–2971. | ||
Neelemaat F, Lips P, Bosmans JE, Thijs A, Seidell JC, Van Bokhorst-de van der Schueren MA. Short-term oral nutritional intervention with protein and vitamin D decreases falls in malnourished older adults. J Am Geriatr Soc. 2012;60(4):691–699. | ||
Smoliner C, Norman K, Wagner KH, Hartig W, Lochs H, Pirlich M. Malnutrition and depression in the institutionalized elderly. Br J Nutr. 2009;102(11):1663–1667. | ||
German L, Feldblum I, Bilenko N, Castel H, Harman-Boehm I, Shahar DR. Depressive symptoms and risk for malnutrition among hospitalized elderly people. Nutr Health Aging. 2008;12(5):313–318. | ||
Hamer M, Bates CJ, Mishra GD. Depression, physical function, and risk of mortality: National Diet and Nutrition Survey in adults older than 65 years. Am J Geriatr Psychiatry. 2011;19(1):72–78. | ||
Callahan CM, Kroenke K, Counsell SR, et al. Treatment of depression improves physical functioning in older adults. J Am Geriatr Soc. 2005;53(3):367–373. |
 © 2014 The Author(s). This work is published and licensed by Dove Medical Press Limited. The full terms of this license are available at https://www.dovepress.com/terms.php and incorporate the Creative Commons Attribution - Non Commercial (unported, v3.0) License.
By accessing the work you hereby accept the Terms. Non-commercial uses of the work are permitted without any further permission from Dove Medical Press Limited, provided the work is properly attributed. For permission for commercial use of this work, please see paragraphs 4.2 and 5 of our Terms.
© 2014 The Author(s). This work is published and licensed by Dove Medical Press Limited. The full terms of this license are available at https://www.dovepress.com/terms.php and incorporate the Creative Commons Attribution - Non Commercial (unported, v3.0) License.
By accessing the work you hereby accept the Terms. Non-commercial uses of the work are permitted without any further permission from Dove Medical Press Limited, provided the work is properly attributed. For permission for commercial use of this work, please see paragraphs 4.2 and 5 of our Terms.