")
Back to Journals » Clinical Interventions in Aging » Volume 10
Comparison of percentage body fat and body mass index for the prediction of inflammatory and atherogenic lipid risk profiles in elderly women
Authors Schwerz Funghetto S , Silva ADO , Frade de Sousa NM , Morato Stival M , Alsamir Tibana R, Pereira L , Antunes MLC, Ramos de Lima L , Prestes J , Jaco R, Tiradentes Dutra M , Souza V, da Cunha Nascimento D , Gomes de Oliveira Karnikowski M
Received 20 June 2014
Accepted for publication 29 July 2014
Published 13 January 2015 Volume 2015:10 Pages 247—253
DOI https://doi.org/10.2147/CIA.S69711
Checked for plagiarism Yes
Review by Single anonymous peer review
Peer reviewer comments 3
Editor who approved publication: Dr Richard Walker
Silvana Schwerz Funghetto,1 Alessandro de Oliveira Silva,2 Nuno Manuel Frade de Sousa,3 Marina Morato Stival,1 Ramires Alsamir Tibana,4 Leonardo Costa Pereira,1 Marja Letícia Chaves Antunes,1 Luciano Ramos de Lima,1 Jonato Prestes,4 Ricardo Jacó Oliveira,1 Maurílio Tiradentes Dutra,2 Vinícius Carolino Souza,1,4 Dahan da Cunha Nascimento,4 Margô Gomes de Oliveira Karnikowski1
1University of Brasília (UnB), Brasília, DF, Brazil; 2Center University of Brasilia (UNICEUB), Brasilia, DF, Brazil; 3Laboratory of Exercise Physiology, Faculty Estácio de Sá of Vitória, ES, Brazil; 4Catholic University of Brasília, Brasília, DF, Brazil
Objective: To compare the clinical classification of the body mass index (BMI) and percentage body fat (PBF) for the prediction of inflammatory and atherogenic lipid profile risk in older women.
Method: Cross-sectional analytical study with 277 elderly women from a local community in the Federal District, Brazil. PBF and fat-free mass (FFM) were determined by dual energy X-ray absorptiometry. The investigated inflammatory parameters were interleukin 6 and C-reactive protein.
Results: Twenty-five percent of the elderly women were classified as normal weight, 50% overweight, and 25% obese by the BMI. The obese group had higher levels of triglycerides and very low-density lipoproteins than did the normal weight group (P≤0.05) and lower levels of high-density lipoproteins (HDL) than did the overweight group (P≤0.05). According to the PBF, 49% of the elderly women were classified as eutrophic, 28% overweight, and 23% obese. In the binomial logistic regression analyses including age, FFM, and lipid profile, only FFM (odds ratio [OR]=0.809, 95% confidence interval [CI]: 0.739–0.886; P<0.0005) proved to be a predictor of reaching the eutrophic state by the BMI. When the cutoff points of PBF were used for the classification, FFM (OR=0.903, CI=0.884–0.965; P=0.003) and the total cholesterol/HDL ratio (OR=0.113, CI=0.023–0.546; P=0.007) proved to be predictors of reaching the eutrophic state.
Conclusion: Accurate identification of obesity, systemic inflammation, and atherogenic lipid profile is key to assessing the risk of cardiometabolic diseases. Classification based on dual energy X-ray absorptiometry measures, along with biochemical and inflammatory parameters, seems to have a great clinical importance, since it allows the lipid profile eutrophic distinction in elderly overweight women.
Keywords: lipids, aging, body fat, women, body mass index, health profile
Introduction
Obesity is emerging as a major public health problem worldwide. The main reasons for this include its high prevalence and associated comorbidities such as type 2 diabetes, cardiovascular disease, cancer, metabolic syndrome, among others.1,2 Alterations in women’s biophysical profile over the years, particularly during the menopausal and postmenopausal periods, may result in weight gain and increased body fat as well as in changes in the fat composition and distribution.3 These changes can lead to obesity and thereby contribute to the development of metabolic abnormalities involved in the genesis and progression of several inflammatory disturbances associated with aging, as well as to the development of cardiovascular diseases.4
For many years, obesity was considered the consequence of a positive caloric balance alone, triggered by excessive food intake and lack of exercise (sedentary behavior).5 However, recent investigations have shown that this clinical event is also related to chronic inflammation denoted by increased inflammatory markers (eg, in elderly and obese women serum levels of several cytokines are elevated).6,7 Interleukin 6 (IL-6), interleukin 1β (IL-1β), and C-reactive protein (CRP) are some examples of serum proinflammatory markers that are altered in the elderly and obese.8–10 Other equally important parameters in the clinical evaluation of elderly women are the increase in levels of total cholesterol (TC) and its subfractions in the blood, as well as the low concentration of high-density lipoproteins (HDL), considered risk factors for the occurrence of coronary events.11
Several methods have been developed to determine body composition (BC). However, there is still hesitation regarding the best technique to be used. Well-known methods include assessments that might be more or less complex, such as the skinfolds, bioelectrical impedance, dual energy X-ray absorptiometry (DEXA), hydrodensitometry, neutron activation analysis in vivo, total body potassium, nuclear magnetic resonance, and, more recently, computed tomography.12–16 Moreover, simple anthropometric measures, for example, body mass index (BMI) associated with inflammatory and biochemical parameters, could be helpful to diagnose and monitor the health status of elderly people.17,18
Although BMI is the most widely used method to evaluate the nutritional status of populations in clinical practice, it might have some fragility to accurately determine the nutritional status and body fat in elderly subjects.18,19 In contrast, DEXA allows direct noninvasive measurement of the three major components of BC: fat-free mass (FFM), percentage body fat (PBF), and bone mass.20 Thus, it has been commonly used in scientific studies.21,22
In the present investigation, it was hypothesized that older women with a lower PBF will have lower inflammatory markers and atherogenic risk factors. Therefore, the purpose of this study was to compare the clinical classification of BMI and PBF for the prediction of inflammatory and atherogenic lipid risk profile in elderly women.
Materials and methods
Subjects
Participant screening is presented in Figure 1. This transversal and analytical study selected 277 elderly women from a local community at the Federal District, Brazil. Participants were not specifically representative of the Brazilian population and were recruited on a voluntary basis from the local community through posters and lectures about the study. On the first visit, they completed an anamnesis form and a physical activity questionnaire and underwent anthropometric measures. The following day they underwent BC analysis by DEXA. Selection criteria included sedentary women aged 60 years or more and the completion of all anthropometric testing. Sedentary women were chosen in view of the higher risk of metabolic complications in this population.1 The sedentary status was determined by the International Physical Activity Questionnaire.23 Individuals diagnosed with inflammatory, rheumatic, or autoimmune conditions that could modulate BC, as well as those under medications (β-blockers and metformin), were excluded. Enrollment was voluntary, and written consent was obtained from each participant. The methodology of the present study was approved by the local Ethics Committee for Human Research (protocol 035/2011), and the procedures were conducted in accordance with guidelines for experimentation with human participants.
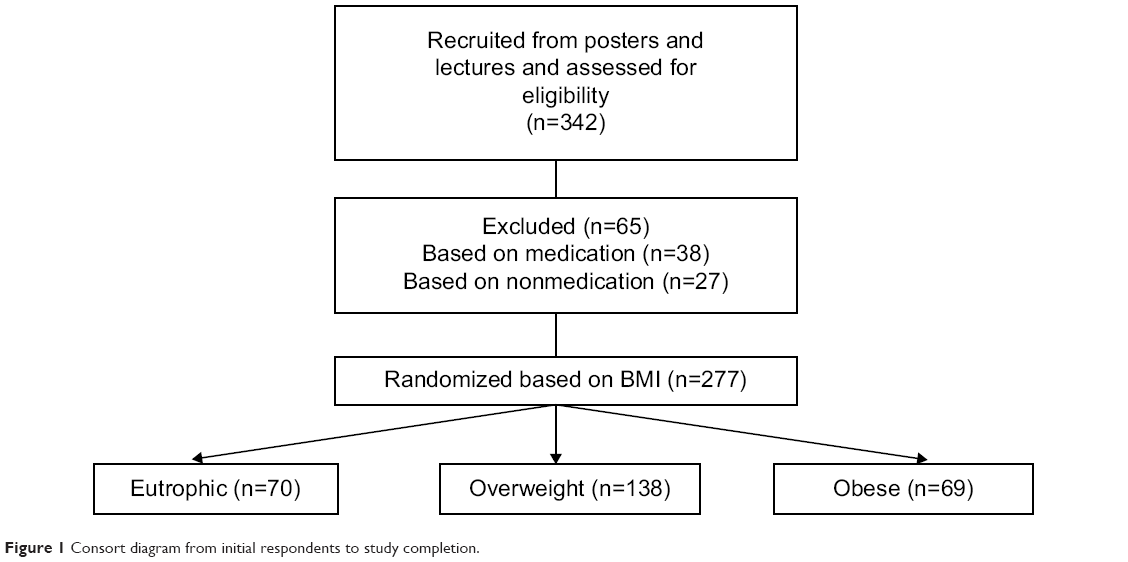 | Figure 1 Consort diagram from initial respondents to study completion. |
Anthropometric measures
Anthropometric status was investigated by the following measures: height (to the nearest 0.1 cm) and body mass (to the nearest 0.1 kg). BMI was then calculated (body mass/height2). PBF and FFM were determined by DEXA (General Electric-GE model 8548 BX1L, Lunar DPX type, software Encore 2005, Rommelsdorf, Germany). PBF values were distributed according to the recommendations of Gallagher et al24 classification, assuming the following cutoff points for elderly women: normal, 25.0%–37.9%, overweight, 38.0%–42.9%, obese, ≥43.0%. Obesity levels determined by BMI followed the classification of the World Health Organization.25
Biochemical measurements
Blood samples were collected from the subjects’ peripheral vein in the morning after a fasting period of 10–12 hours. The samples were immediately centrifuged at 4°C. The plasma was then used for analysis of lipid profile (including TC, triglycerides [TGs], low-density-lipoprotein [LDL] cholesterol, very-low-density-lipoprotein [VLDL] cholesterol, and HDL cholesterol). Briefly, TGs, cholesterol, and its subfractions were measured using an automated analyzer (Olympus AU5400, Tokyo, Japan).
Inflammatory parameters
The inflammatory parameters investigated were IL-6 and CRP. IL-6 was assessed by commercial enzyme-linked immunosorbent assay kits (Quantikine or Quantikine High Sensitivity, R&D Systems, Minneapolis, MN, USA). The intra-assay coefficient of variation of the kits was 1.5%–5.6%, while the interassay coefficient of variation was 4.3%–6.4%. Plasma CRP was determined using high-sensitivity turbidimetry according to the manufacturer’s protocol (Boehringer Mannheim GmbH, Mannheim, Germany). All measures were performed in triplicate.
Statistical analysis
The results of anthropometric, lipid, and inflammatory parameters are presented as means (95% confidence interval [CI]). The subjects were divided into three groups: eutrophic, overweight, and obesity, according to the BMI and PBF classifications. Differences between groups were checked by the nonparametric independent-samples Kruskal–Wallis test. The assumption of normality for lipid and inflammatory data was not satisfied, as assessed by Kolmogorov–Smirnov test (P<0.05). Binomial logistic regressions were used to check the association of lipid and inflammatory profiles (continuous variables) with the eutrophic/noneutrophic status of the subjects, according to the BMI and PBF classifications. Binomial logistic regression is suitable for predicting the outcome of a categorical criterion variable that can take on only two possible outcomes, in this case, the eutrophic or noneutrophic status. Adjusted odds ratios (ORs) were derived from logistic regression models. OR greater than 1 indicates that the independent variable is positively associated with the eutrophic state, and OR less than 1 indicates negative association. Finally, the sensitivity is the percentage of cases that had the observed characteristic (eutrophic or noneutrophic) which were correctly predicted by the model, and the specificity is the percentage of cases that did not have the observed characteristic and were also correctly predicted as not having the observed characteristic (eutrophic or noneutrophic). The level of significance was P≤0.05, and SPSS version 20.0 software was used.
Results
The elderly women (n=277) had a mean age of 68.6 (67.9–69.3) years, BMI 27.2 (26.7–27.7) kg/m2, PBF 38.5% (37.7%–39.2%), and FFM 36.8 (36.3–37.3) kg. Table 1 presents the anthropometric, lipid, and inflammatory profiles of the eutrophic, overweight, and obese subjects according to the BMI classification. Twenty five percent of the elderly women were classified as eutrophic, 50% as overweight, and 25% as obese. Regarding the lipid profile, the obese group had higher levels of TGs and VLDL than did the eutrophic group (P≤0.05), and lower levels of HDL than did the overweight group (P≤0.05). No differences were observed (P>0.05) in the TC, LDL, non-LDL, and lipid ratios between groups. As for the inflammatory profile, only IL-6 was increased (P≤0.05) in the obesity and overweight groups (Table 1).
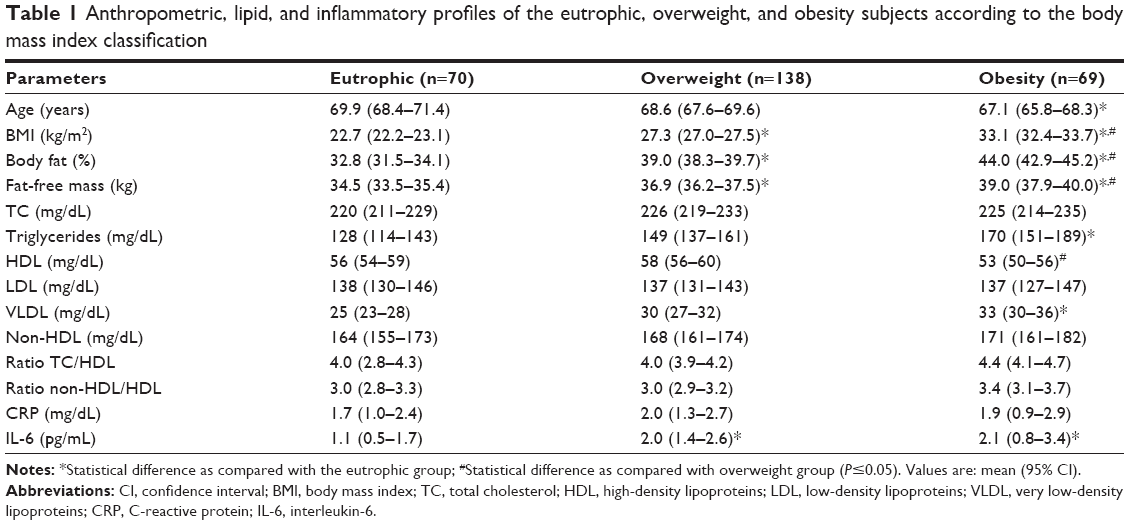 | Table 1 Anthropometric, lipid, and inflammatory profiles of the eutrophic, overweight, and obesity subjects according to the body mass index classification |
Table 2 presents the anthropometric, lipid, and inflammatory profiles considering the PBF according to the cutoff points published by Gallagher et al.24 According to the PBF cutoff points, 49% of the elderly women were classified as eutrophic, 28% as overweight, and 23% as obese. The TGs and lipid ratios were increased (P≤0.05) in the obesity and overweight PBF groups and the HDL levels were decreased (P≤0.05) as compared with those in the normal weight group. There were no differences (P>0.05) in TC, LDL, VLDL, and non-LDL between PBF groups. Regarding the inflammatory profile, the CRP was decreased (P≤0.05) in obesity PBF group and the IL-6 was increased (P≤0.05) in overweight and obesity PBF groups as compared with those in the normal weight group (Table 2).
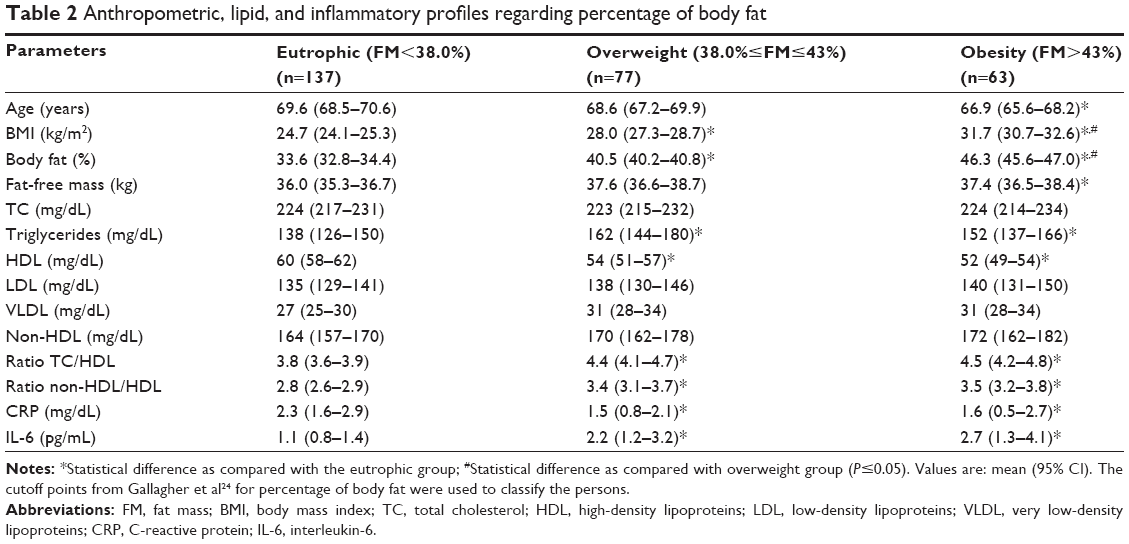 | Table 2 Anthropometric, lipid, and inflammatory profiles regarding percentage of body fat |
With the regard to the high number of individuals classified as eutrophic considering the PBF when compared to the classification of BMI, the lipid and inflammatory profiles of the individuals who were overweight by BMI but eutrophic by PBF were analyzed. Those individuals were within the normal limits of lipid and inflammatory profiles (TC: 225 [215–247] mg/dL; TGs: 155 [137–173] mg/dL; HDL: 62 [59–65] mg/dL; LDL: 134 [124–144] mg/dL; VLDL: 31 [28–35] mg/dL; PCR: 2.6 [1.4–3.8] mg/dL; IL-6: 1.0 [0.7–1.3] pg/mL) and with no statistically significant difference for eutrophic by PBF (P≥0.05).
In the binomial logistic regression analyses including age, FFM, and lipid profile as continuous independent variables, only FFM (OR=0.809, 95% CI=0.739–0.886; P<0.0005) proved to be a predictor of reaching the eutrophic state, according to the BMI nutritional status classification. On the other hand, when the cutoff points of PBF were used for the nutritional status classification, FFM (OR=0.903, CI=0.884–0.965; P=0.003) and specially the TC/HDL ratio (OR=0.113, CI=0.023–0.546; P=0.007) proved to be predictors (negatively associated) of reaching the eutrophic state (Table 3).
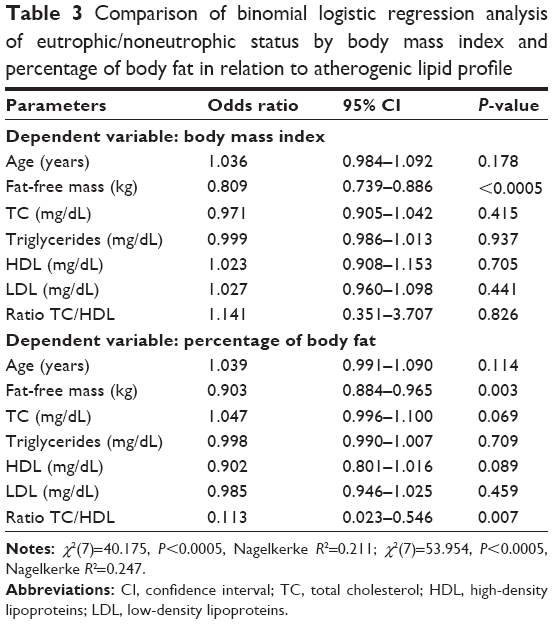 | Table 3 Comparison of binomial logistic regression analysis of eutrophic/noneutrophic status by body mass index and percentage of body fat in relation to atherogenic lipid profile |
The model correctly classified 77.2% of cases using BMI and 69.2% using PBF (being eutrophic or being noneutrophic). However, the BMI classification had low sensitivity (28.4%). Differently, for the PBF classification, sensitivity was 73.6% and specificity was 65.2%. Regarding the inflammatory profile, the binomial logistic regression analysis revealed that the eutrophic state was significantly and positively associated with age and significantly and negatively associated with FFM in both BMI and PBF classifications (Table 4).
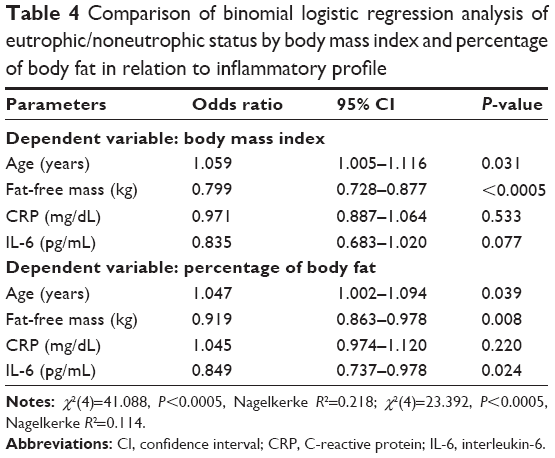 | Table 4 Comparison of binomial logistic regression analysis of eutrophic/noneutrophic status by body mass index and percentage of body fat in relation to inflammatory profile |
Meanwhile, IL-6 proved to be a predictor (negatively associated) of reaching the eutrophic state only for the PBF classification. Although the model correctly classified 78.5% of the nutritional status using BMI and 60.5% using PBF, BMI classification had low sensitivity (27.3% for BMI versus 54.0% for PBF classification).
Discussion
The aim of the present study was to compare the clinical classifications of BMI and PBF for the prediction of inflammatory and atherogenic lipid risk profiles in elderly women. The main finding of the present study was that the classification of PBF by DEXA, along with biochemical tests, are more reliable predictors for identifying obesity, systemic inflammation, and atherogenic lipid profile in elderly women, compared with BMI.
The percentage of obese individuals was very similar between the classifications adopted (BMI and PBF). However, the BMI method tends to classify a greater number of individuals as overweight, compared with the PBF, which classifies them as normal. Moreover, for both classifications, obese individuals exhibit a higher atherogenic lipid risk profile than do normal weight individuals. On the other hand, CRP was elevated in normal individuals when the classification followed the PBF. This fact can be explained in part by the high levels of insulin, which notoriously inhibit the production of CRP induced by IL-6 and tumor necrosis factor α.26 It is noteworthy that insulin was not measured in our study, but it is postulated that it may be increased in the circulation because of metabolic disorders involving carbohydrates often found in elderly and obese.
It is relevant to mention that the CRP values presented by the subjects of this study, regardless of the classification, are below the cutoff value of 2.78 mg/dL proposed by Harris et al27 with respect to cardiovascular risk. The binomial regression model for both classifications has shown that, despite normal individuals having been older and presented less FFM, their overweight and obese counterparts were prone to present changes in lipid profile when considering the PBF classification. In addition, FFM proved to be a predictive factor for noneutrophic nutritional status in both classifications (BMI and PBF). Despite the fact that older obese women in the present investigation presented a high PBF, they also presented greater FFM. So, FFM is a parameter to be monitored during the aging process, as it is related to functional capacity and the development of obesity, sarcopenia, and sarcopenic obesity.1
With regard to the atherogenic factors, the obese elderly presented higher levels of TGs and lower levels of VLDL and HDL than did the normal weight group when classified by the BMI. Other studies have also found high levels of TGs among overweight elderly people and a strong correlation between the concentration of TGs and measures of abdominal obesity.1,6 In addition, when the classification of nutritional status was done by PBF, not only the concentration of TGs in obese individuals was increased, but also lipid ratios were found to be negatively altered. Previous studies demonstrated that the use of TC/HDL and non-HDL/HDL ratios are more efficient parameters for the stratification of cardiovascular risk than the isolated usage of serum lipids.18,28 Moreover, the classification based on DEXA measure of PBF was able to differentiate the atherogenic status of eutrophic individuals as compared with those classified as overweight and obese. Thus, we can state that the PBF classification through DEXA associated with biochemical tests allows the distinction of cardiovascular risk factors with greater accuracy, since differences between normal weight and overweight are observed. On the other hand, BMI classification allows only the identification of differences between normal weight and obese. Reinforcing the data discussed earlier, the PBF classification of the elderly revealed that the TC/HDL ratio is also a predictor of the eutrophic state. Previous studies have already shown the clinical importance of the lipid profile as regards the health disorders in the elderly population.29,30 The results presented here also allow inferring that the lipid profile presents an intimate relationship with nutritional status. This association appears to be more reliable when the nutritional status is assessed by DEXA measures of PBF and FFM.
Both overweight and obese subjects presented increased serum levels of IL-6 when compared with those in the normal weight individuals regardless of the classification method. In addition, participants classified as obese presented serum IL-6 values at the upper limit (≥2.08 pg/mL) according to the recommendation of Harris et al.27 To note, this cutoff has an association with mortality of approximately 50 per 1,000 per year in the elderly. However, only in PBF classification, overweight and obesity were predictive of elevated serum IL-6 levels. This fact may be linked to the sensitivity and specificity evidenced by the binomial regression model for the two methods of classification. BMI had a low sensitivity, indicating that when the levels of IL-6 are low, this method considers only 27.3% of individuals as actually eutrophic.
On the other hand, when using the PBF defined by DEXA, there was a higher accuracy in terms of nutritional status classification according to the levels of IL-6. Augmented levels of inflammatory cytokines in the serum during aging, particularly IL-6, may reflect underlying inflammation, which can trigger a series of immunological and metabolic changes related to chronic diseases, such as diabetes and cardiovascular disease.31,32
In summary, the classification of obesity based on DEXA measures, along with biochemical and inflammatory parameters, appears to be a more accurate method and to have a major clinical importance as compared with BMI, as it allows the differentiation of the lipid profile between eutrophic and overweight older women. Thus, in the elderly women studied, the usage of BMI as a method to determine the nutritional status classification fails to precisely detect a negatively altered lipid or inflammatory profile. Accurate identification of obesity, systemic inflammation, and atherogenic lipid profile is key for risk assessment of cardiometabolic diseases, which may assist health professionals in the prevention and management of this cluster of diseases.
Acknowledgments
The authors thank the Department of Research and Graduation Program at the University of Brasilia and Catholic University of Brasilia.
Disclosure
The authors report no conflicts of interest, financial or otherwise, in this work.
References
Silva AO, Tibana RA, Karnikowski MGO, Funghetto SS, Prestes J. Inflammatory status in older women with and without metabolic syndrome: is there a correlation with risk factors? Clin Interv Aging (Online). 2013;8:361–367. | ||
Sadeghi M, Pourmoghaddas Z, Hekmatnia A, et al. Abdominal fat distribution and serum lipids in patients with and without coronary heart disease. Arch Iran Med. 2013;16(3):149–153. | ||
Milewicz A. Menopausal obesity and metabolic syndrome – PolSenior study. Minerva Endocrinol. 2012;37(1):93–101. | ||
Dick TJM, Lesser IA, Leipsic JA, Mancini GBJ, Lear SA. The effect of obesity on the association between liver fat and carotid atherosclerosis in a multi-ethnic cohort. Atherosclerosis. 2013;226(1):208–213. | ||
Harrington J, Lee-Chiong T. Obesity and Aging. Clin Chest Med. 2009;30(3):609–614. | ||
Silva A, Karnikowski M, Funghetto S, et al. Association of body composition with sarcopenic obesity in elderly women. Int J Gen Med. 2013;6:25–29. | ||
Tonet A, Karnikowski M, Moraes C, et al. Association between the −174 G/C promoter polymorphism of the interleukin-6 gene and cardiovascular disease risk factors in Brazilian older women. Braz J Med Biol Res. 2008;41:47–53. | ||
Moleres T, Rendo-Urteaga C, Azcona JA, et al; AVENA group. IL6 gene promoter polymorphism (−174G/C) influences the association between fat mass and cardiovascular risk factors. J Physiol Biochem. 2009;65(4):405–414. | ||
Bruunsgaard H, Skinhøj P, Schroll M. Ageing, tumour necrosis factor-alpha (TNF-α) and atherosclerosis. Clin Exp Immunol. 2000;121:255–260. | ||
Bruunsgaard H, Andersen-Ranberg K, Jeune B, Pedersen AN, Skinhøj P, Pedersen BK. A high plasma concentration of TNF-alpha is associated with dementia in centenarians. J Gerontol A Biol Sci Med Sci. 1999;54(7):M357–M364. | ||
Aronow WS. Lipids and the elderly. Rev Endocr Metab Disord. 2004;5:359–364. | ||
Jaffrin MY. Body composition determination by bioimpedance: an update. Curr Opin Clin Nutr Metab Care. 2009;12(5):482–486. | ||
Leonard CM, Roza MA, Barr RD, Webber CE. Reproducibility of DXA measurements of bone mineral density and body composition in children. Pediatr Radiol. 2009;39(2):148–154. | ||
Hill GL, Jonathan E. Rhodes lecture. Body composition research: implications for the practice of clinical nutrition. JPEN J Parenter Enteral Nutr. 1992;16(3):197–218. | ||
Pierson RN Jr, Wang J, Thornton JC, Itallie TBV, Colt EW. Body potassium by four-pi 40K counting: an anthropometric correction. Am J Physiol. 1984;246:F234–F239. | ||
Sohlström A, Forsum E. Changes in total body fat during the human reproductive cycle as assessed by magnetic resonance imaging, body water dilution, and skinfold thickness: a comparison of methods. Am J Clin Nutr. 1997;66:1315–1322. | ||
Xavier HT, Izar MC, Faria Neto JR, et al; Sociedade Brasileira de Cardiologia. V Diretriz Brasileira de Dislipidemias e Prevenção da Aterosclerose. [V Brazilian guidelines on dyslipidemias and prevention of atherosclerosis]. Arq Bras Cardiol. 2013;102(4):1–22. Portuguese. | ||
Perk J, De Backer G, Gohlke H, et al. European guidelines on cardiovascular disease prevention in clinical practice (version 2012). The Fifth Joint Task Force of the European Society of Cardiology and Other Societies on Cardiovascular Disease Prevention in Clinical Practice (constituted by representatives of nine societies and by invited experts). Eur Heart J. 2012;33(13):1635–1701. | ||
Han T, Tajar A, Lean M. Obesity and weight management in the elderly. Br Med Bull. 2011;97:169–196. | ||
Shaw KA, Srikanth VK, Fryer JL, Blizzard L, Dwyer T, Venn AJ. Dual energy X-ray absorptiometry body composition and aging in a population-based older cohort. Int J Obes (Lond). 2007;31(2):279–284. | ||
Lustgarten MS, Fielding RA. Assessment of analytical methods used to measure changes in body composition in the elderly and recommendations for their use in phase II clinical trials. J Nutr Health Aging. 2011;15(5):368–375. | ||
Ochiai H, Shirasawa T, Nishimura R, et al. Relationship of body mass index to percent body fat and waist circumference among schoolchildren in Japan – the influence of gender and obesity: a population-based cross-sectional study. BMC Public Health. 2010;10:493. | ||
Matsudo S, Araújo T, Matsudo V, et al. Questionário Internacional de atividade física (IPAQ): estudo de validade e reprodutibilidade no Brasil. [International physical activity questionnaire (IPAQ): study of validity and reliability in Brazil]. Rev Bras Ativ Fís Saúde. 2001;6(2):5–18. Portuguese. | ||
Gallagher D, Heymsfield SB, Heo M, Jebb SA, Murgatroyd PR, Sakamoto Y. Healthy percentage body fat ranges: an approach for developing guidelines based on body mass index. Am J Clin Nutr. 2000;72(3):694–701. | ||
World Health Organization. Obesity: Preventing and Managing the Global Epidemic. WHO Technical Report Series No 894. Geneva: World Health Organization; 2000. Available from http://apps.who.int/bookorders/anglais/detart1.jsp?codlan=1&codcol=10&codcch=894 Accessed 11 October 2014. | ||
Ingle PV, Patel DM. C-reactive protein in various disease condition – an overview. Asian J Pharm Clin Res. 2011;4(1):9–14. | ||
Harris T, Ferrucci L, Tracy R, et al. Associations of elevated interleukin-6 and C-reactive protein levels with mortality in the elderly. Am J Med. 1999;106:506–512. | ||
Eliasson B, Gudbjörnsdottir S, Zethelius B, Eeg-Olofsson K, Cederholm J; NDR. LDL-cholesterol versus non-HDL-to-HDL-cholesterol ratio and risk for coronary heart disease in type 2 diabetes. Eur J Prev Cardiol. Epub 2013 Jun 17. | ||
Chung JY, Kang HT, Lee DC, Lee HR, Lee YJ. Body composition and its association with cardiometabolic risk factors in the elderly: a focus on sarcopenic obesity. Arch Gerontol Geriatr. 2013;56(1):270–278. | ||
Félix-Redondo FJ, Grau M, Baena-Díez JM, et al. Prevalence of obesity and associated cardiovascular risk: the DARIOS study. BMC Public Health. 2013;13(1):542. | ||
Lee JK, Bettencourt R, Brenner D, Le T-A, Barrett-Connor E, Loomb R. Association between serum interleukin-6 concentrations and mortality in older adults: the Rancho Bernardo study. PLoS One. 2012;7(4):e34218. | ||
Galic S, Oakhill JS, Steinberg GR. Adipose tissue as an endocrine organ. Mol Cell Endocrinol. 2010;316(2):129–139. |
 © 2015 The Author(s). This work is published and licensed by Dove Medical Press Limited. The full terms of this license are available at https://www.dovepress.com/terms.php and incorporate the Creative Commons Attribution - Non Commercial (unported, v3.0) License.
By accessing the work you hereby accept the Terms. Non-commercial uses of the work are permitted without any further permission from Dove Medical Press Limited, provided the work is properly attributed. For permission for commercial use of this work, please see paragraphs 4.2 and 5 of our Terms.
© 2015 The Author(s). This work is published and licensed by Dove Medical Press Limited. The full terms of this license are available at https://www.dovepress.com/terms.php and incorporate the Creative Commons Attribution - Non Commercial (unported, v3.0) License.
By accessing the work you hereby accept the Terms. Non-commercial uses of the work are permitted without any further permission from Dove Medical Press Limited, provided the work is properly attributed. For permission for commercial use of this work, please see paragraphs 4.2 and 5 of our Terms.