")
Back to Journals » International Journal of Chronic Obstructive Pulmonary Disease » Volume 9 » Issue 1
Comparison of disease-severity measures within severe and very severe COPD patients: results from a nationally representative chart review and patient survey
Authors Solem C , Sun S, Liu S, Macahilig C, Katyal M, Gao X , Shorr A
Received 25 April 2014
Accepted for publication 29 June 2014
Published 23 September 2014 Volume 2014:9(1) Pages 991—998
DOI https://doi.org/10.2147/COPD.S66798
Checked for plagiarism Yes
Review by Single anonymous peer review
Peer reviewer comments 4
Caitlyn T Solem,1 Shawn X Sun,2 Sizhu Liu,1 Cynthia Macahilig,3 Monica Katyal,3 Xin Gao,1 Andrew F Shorr4
1Pharmerit International, Bethesda, MD, 2Forest Research Institute, Jersey City, NJ, 3Medical Data Analytics, Parsippany, NJ, 4Pulmonary Critical Care, Washington Hospital Center and Georgetown University, Washington, DC, USA
Objective: This study aimed to compare spirometry- and risk + symptom-based classification systems to physician-based severity assessment and find which system is most predictive of patient-reported health status, as measured by the St George's Respiratory Questionnaire for COPD (chronic obstructive pulmonary disease; SGRQ-C).
Materials and methods: In this chart review/patient survey, 99 physicians recruited patients with physician-assessed severe or very severe COPD who had recently experienced a moderate or severe exacerbation. A cross-tabulation was undertaken comparing physician report, spirometry (mild/moderate, forced expiratory volume in 1 second [FEV1] ≥50%; severe, 30% ≤ FEV1 <50%; very severe, FEV1 <30% predicted), and risk + symptom-based (A, low risk/fewer symptoms; B, low risk/more symptoms; C, high risk/fewer symptoms; D, high risk/more symptoms) severity systems. Analysis of covariance models were run for SGRQ-C, varying COPD-severity systems.
Results: Of 244 patients, 58.6% were severe and 34.8% very severe by physician report, 70% had FEV1 ≤50% at their most recent visit, and 86% fell into quadrant D. Spirometry and physician report had 57.4% agreement, with physicians often indicating higher severity. Physician report and risk + symptom agreement was high (81.2% severe/very severe and D). Physician-reported severity, risk + symptoms, exacerbations in the previous year, and symptoms were significant SGRQ-C predictors, while spirometry was not.
Conclusion: For recently exacerbating severe or very severe COPD patients, risk + symptoms more closely aligned with physician-reported severity and SGRQ-C versus spirometry.
Keywords: COPD, disease-severity measures, pharmacoepidemiology
Introduction
Chronic obstructive pulmonary disease (COPD) is a progressive condition that currently affects approximately 24 million adults in the US, including 12 million diagnosed patients and 12 million undiagnosed,1 and is predicted to be the fourth-leading cause of death worldwide by 2030.2 GOLD (Global initiative for chronic Obstructive Lung Disease) aims to improve prevention and treatment of COPD, and has released numerous iterations of guidelines related to the diagnosis and treatment of COPD. While GOLD guidelines published in 2007 classify patient severity primarily based on spirometry (ratio of forced expiratory volume in 1 second to forced vital capacity [FEV1/FVC] and FEV1% predicted; mild, FEV1 ≥80% predicted; moderate, 50% ≤ FEV1 <80% predicted; severe, 30% ≥ FEV1 <50% predicted; very severe, FEV1 <30% predicted; all FEV1/FVC <70%),3 the 2011 update to the GOLD guidelines contains a number of revisions, including a new patient-classification system based on symptoms in addition to risk of exacerbation, as measured by a combination of spirometry and exacerbation history (A, low risk, fewer symptoms; B, low risk, more symptoms; C, high risk, fewer symptoms; D, high risk, more symptoms).4
While spirometry is regarded as the most reproducible and objective measurement of airflow limitation available, there have been controversies regarding the validity of spirometric testing and its value in the management of patients with known COPD. While spirometry measurement improves early detection of COPD in general practice,5 it is often imprecise due to lack of adequate training in use and interpretation,6 and may not accurately reflect the true burden of disease or patient experience. This study aimed to measure and compare 2007 (spirometry-based) and 2011 (risk + symptom-based) GOLD classification systems to physician-based severity assessment and to assess which system is most predictive of patient-reported health status.
Materials and methods
Study design
This was a secondary analysis of a combination chart review and patient survey that focused on patients diagnosed with severe or very severe COPD (based on physician assessment) who had recently experienced a moderate-to-severe COPD exacerbation. As a primary end point, GOLD 2007 (spirometry) and 2011 (exacerbation risk + symptoms) systems were cross-tabulated against each other and against the physician’s severity assessment to compare the overlap of these classification systems. These systems were then compared in terms of their explanatory power as predictors of patient-reported health status, as measured by the St George’s Respiratory Questionnaire for COPD (SGRQ-C) total scores.7
Patient selection
A stratified random quota sample of 100 physicians was recruited from a national database provided by a mailing list provider company (F1rstmark, Inc., Campton, NH, US). Physician specialty and census region (Northeast, Midwest, South, and West) were used as key sampling variables to ensure the equal representation by pulmonologists (PULMs) and primary care physicians (PCPs) in equal proportions from the four major census regions of the US. Included physicians needed to currently manage/treat severe and/or very severe COPD patients as defined by 2007 GOLD guidelines3 and be willing to comply with study instructions.
Each physician randomly selected up to four patients from all patients eligible at his/her practice using patient birth month and day for selection criteria, with each physician randomly assigned a month and day as a starting point for selection. Patients who were 40 years or older and who had been diagnosed with severe or very severe COPD for ≥12 months prior to their most recent visit, had had a chronic productive cough for ≥3 months, and who had experienced a moderate or severe exacerbation (based on American Thoracic Society/European Respiratory Society proposed categories for COPD-exacerbation severity)8 within the previous 12 months were eligible for inclusion.
Data collection
Recruitment and measurement occurred between November 2011 and March 2012. Patients were administered a survey via computer assisted telephone interview or hard-copy survey that included a brief introductory screening of whether patients met inclusion/exclusion criteria, questions regarding the frequency and severity of exacerbations in the previous 12 months, and smoking status and validated patient-reported outcome instruments, including the SGRQ-C.9 These instruments were licensed and administered in a format consistent with their original format and content. Physicians completed case-report forms (CRFs) based on patients’ medical records in order to collect demographic, treatment, and clinical information, including the number of moderate and severe exacerbations that had occurred within 12 months of the CRF completion date. For this analysis, only patients whose spirometric data were available and who reported a FEV1/FVC <70% at their most recent visit were included. This study was conducted in accordance with the amended Declaration of Helsinki. Institutional review board exemption for this study was obtained from the New England Institutional Review Board (11-391); informed patient consent was not required, since patient identity was only known to participating physicians, who assigned a unique identifier for each patient recruit for the purpose of tracking.
COPD-severity metrics
For patients included in the study, COPD severity was classified according to clinical opinion (as documented on the CRF; mild, moderate, severe, or very severe), by spirometry alone, and using a risk/symptom-classification system consistent with 2011 GOLD guidelines. Based on 2007 GOLD guidelines, patients’ severity was classified into categories based on spirometry alone: mild/moderate when FEV1 was ≥50% predicted (mild and moderate considered together due to low sample sizes within each group), severe when 30% ≤ FEV1 <50% predicted, and very severe when FEV1 <30% predicted.
The risk + symptom-based classification system reflected the subgroups defined in the 2011 GOLD guidelines: group A having low risk and fewer symptoms, group B with low risk and more symptoms, group C with high risk and fewer symptoms, and group D having high risk and more symptoms. Consistent with these guidelines, patients were considered high risk if their FEV1 was <50% predicted or the patient had experienced two or more exacerbations in the previous 12 months. As the COPD Assessment Test (CAT) was not originally included within the chart review, symptom scores were calculated based on a transformation of patients’ responses on the SGRQ-C scores. This approach was consistent with that used by a previous study that validated the conversion from CAT to SGRQ-C score.10 In this analysis, SGRQ-C item responses were mapped to CAT scores utilizing Rasch analysis (partial credit model run in Winsteps® 3.7.4; JM Linacre, Beaverton, OR, USA). classifying patients with predicted CAT scores ≥10 as having more symptoms and CAT scores <10 as having fewer symptoms, consistent with GOLD 2011 guidelines. The number of moderate and severe exacerbations occurring within the previous 12 months was collected both from patients’ medical charts (primary source) and direct patient reports (secondary source). Only the primary source was used for calculating patient-exacerbation risk.
Patient-reported health status
As one measurement of health status from the patient’s perspective, SGRQ-C total scores were compared across COPD-severity classification systems. The SGRQ-C is a 14-item questionnaire that can be summarized as a total score, as well as by three component scores for symptoms (effect of respiratory symptoms, their frequency and severity), activities (any activities that cause or are limited by breathlessness), and impacts (aspects concerned with social functioning and psychological disturbances resulting from airway disease). Total and component scores were calculated according to algorithms provided in the SGRQ-C instruction manual.9
Statistical analyses
This study was primarily descriptive in nature. Chi-squared tests were utilized for bivariate comparisons of categorical end points, and analysis of variance or Student’s t-test for continuous outcomes across patients with different severity classifications.
To address our primary objective of describing the overlap between COPD-severity metrics, a cross-tabulation of each measure (physician report, GOLD 2011 risk + severity category, GOLD 2007 spirometry), including exacerbations and symptom scores, was undertaken. Within the first data row and column, the percentages for patients in each category out of a denominator of the entire population are provided. Each cross-sectional cell (eg, physician report by GOLD 2011 category) provides the proportion of patients who would meet both classifications (eg, physician-reported very severe COPD AND GOLD D), with the sum of all cells in the cross section equaling 100%, and percentages in cell rows and columns equaling the marginal percentages (eg, percentage physician-reported moderate and GOLD 2011 D + percent physician-reported severe and GOLD 2011 D + physician-reported very severe and GOLD 2011 D = percentage GOLD 2011 D). Cells were colored such that higher percentages were shaded with a darker color; cells that did not overlap were shaded black.
To examine which COPD-severity system aligned most closely with patient-reported health status, a series of analysis of covariance models were run by using SGRQ-C score as the dependent variable, each controlling for patient characteristics (race, age, sex, smoking status [never, former, current], type of physician), but varying the metric used to evaluate COPD severity: model 1 included physician-reported COPD severity, model 2 included spirometric assessment alone, model 3 utilized the GOLD 2011 classification system, and model 4 included separate variables for spirometric assessment, exacerbations in the previous year, and CAT score. All statistical tests assumed an unadjusted P-value of 0.05 for statistical significance.
Results
Of the 208 physicians successfully contacted and screened between November 23, 2011 and March 30, 2012, 174 met study-inclusion criteria (83.6% completion rate); from these, 45 PULMs and 54 PCPs contributed patients. The majority of physicians had a single-specialty group practice (42%), with approximately 2,600 patients being treated on average per practitioner. PULMs and PCPs estimated that an average of 40.6% and 13.4% of their patients, respectively, were diagnosed with COPD. Of the 314 severe or very severe COPD patients recruited, 244 had documented spirometry at their most recent visit and were retained for analysis. The majority of the study population was white (86.1%), with an average age 67.9±9.9 years, and 54.1% were treated for their COPD only by a PCP (Table 1). Almost all patients (94.3%) were former or current smokers. There were no statistically significant differences in demographic/clinical characteristics across GOLD 2011 risk + symptom categories.
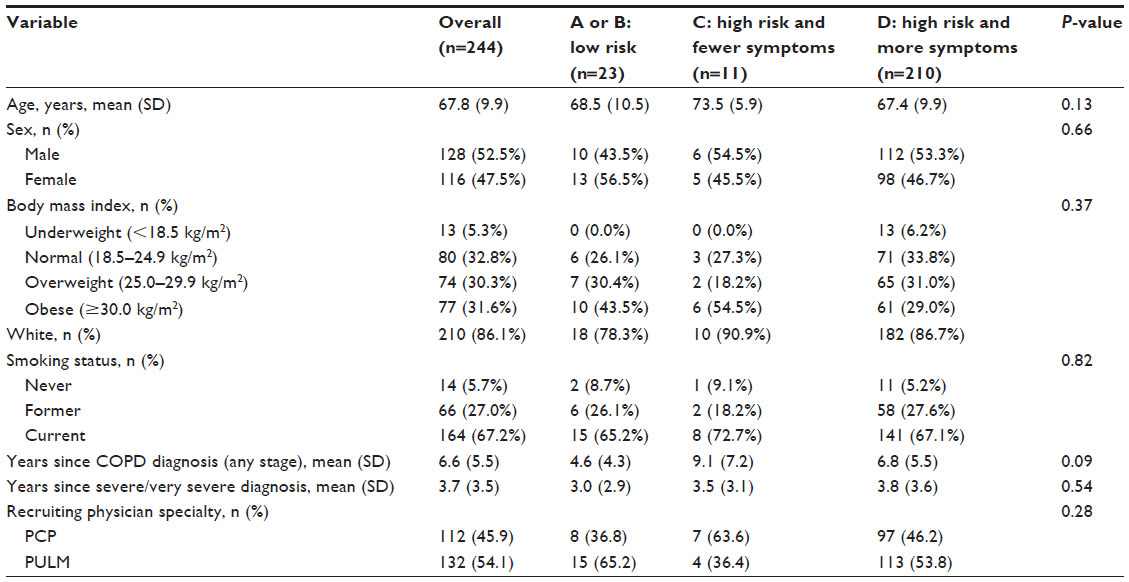 | Table 1 Demographic and clinical characteristics by GOLD 2011 quadrant (symptoms and risk) |
COPD severity
There was 57.4% agreement between spirometry-based and physician-reported systems, with the majority of patients classified as severe by both systems (4.9% of patients classified as mild/moderate, 40.6% severe, and 11.9% very severe; Figure 1). Physicians were more likely to indicate a higher level of severity than spirometry alone: while physicians classified 58.6% of the cohort as severe and 34.8% as very severe, 58.2% and 11.9% were classified as severe and very severe, respectively, based on spirometry alone.
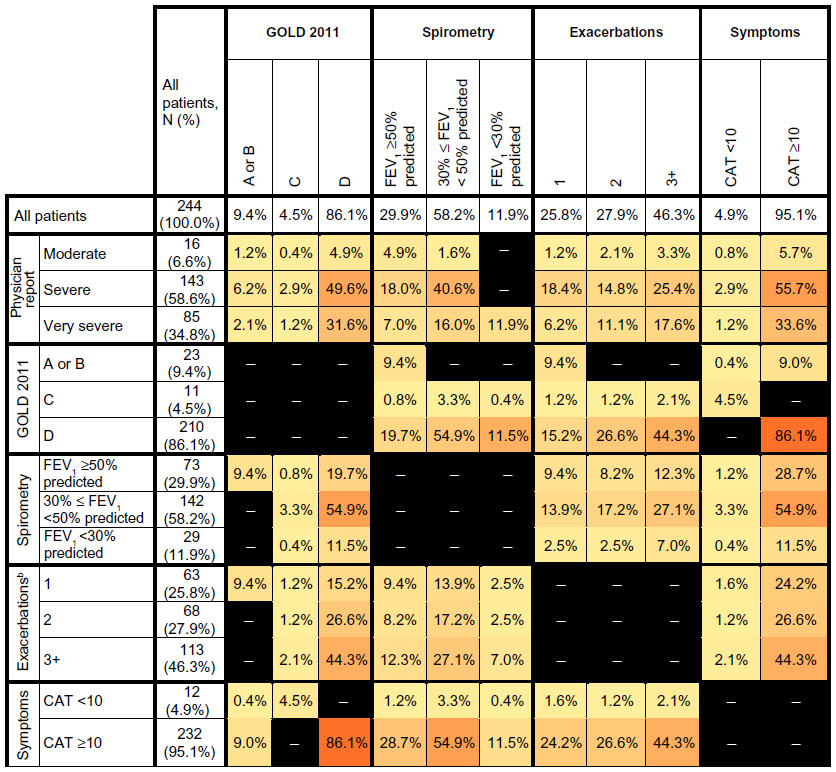 | Figure 1 Pair-wise comparisons of COPD-severity measures.a |
A total of 86% of patients fell into GOLD 2011 quadrant D, with 17.7% meeting high-risk criteria based on spirometry alone, 23.0% based on exacerbations, and 59.3% both. Agreement between physician-reported severity and GOLD 2011 was relatively high: 81.2% of patients were classified as severe (49.6%) or very severe (31.6%) by physicians and also fell into GOLD 2011 category D. The vast majority (95.1%) of patients also had more symptoms as measured by a CAT score ≥10, but were most frequently classified as having severe COPD by physicians.
SGRQ-C scores
Across all patients, the mean ± standard deviation SGRQ-C scores were 64.8±20.9 for the total and 71.3±18.7 for symptoms, 77.9±22.5 for activities, and 54.8±25.3 for impacts (Table 2). Physician-reported COPD severity, risk + symptom group (GOLD 2011), number of exacerbations in the previous year, and symptoms were all significant predictors of SGRQ-C total scores in both bivariate and multivariable analysis, while spirometry was not a predictor of SGRQ-C total scores in either analysis. Models that measured severity according to spirometry, exacerbations, and CAT separately were the best predictors of SGRQ-C total scores, followed by GOLD 2011 risk + symptom categories and physician-reported severity, after controlling for age, sex, body mass index, physician specialty, current or former smoking, and number of COPD medication classes used (Table 3). Variables for spirometry continued to be not significant in multivariable models. Patients who were in GOLD 2011 category C (fewer symptoms, high risk) had much lower symptom, activity, and impact scores compared to patients in categories A, B, or D, although the sample size for this subgroup (category C) was low (n=11).
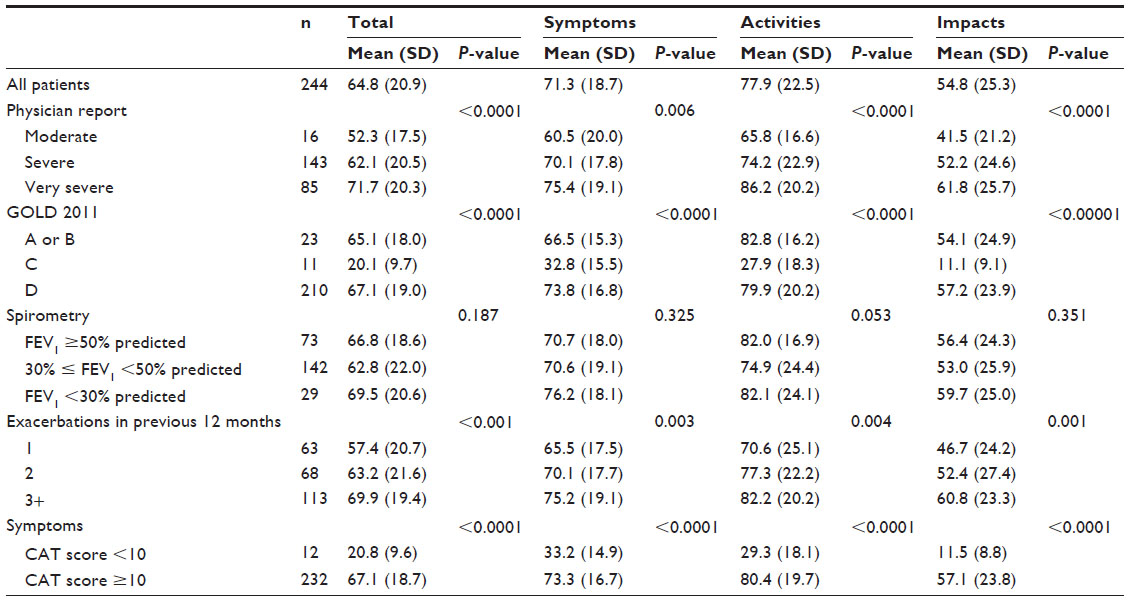 | Table 2 SGRQ-C scores by COPD-severity measure |
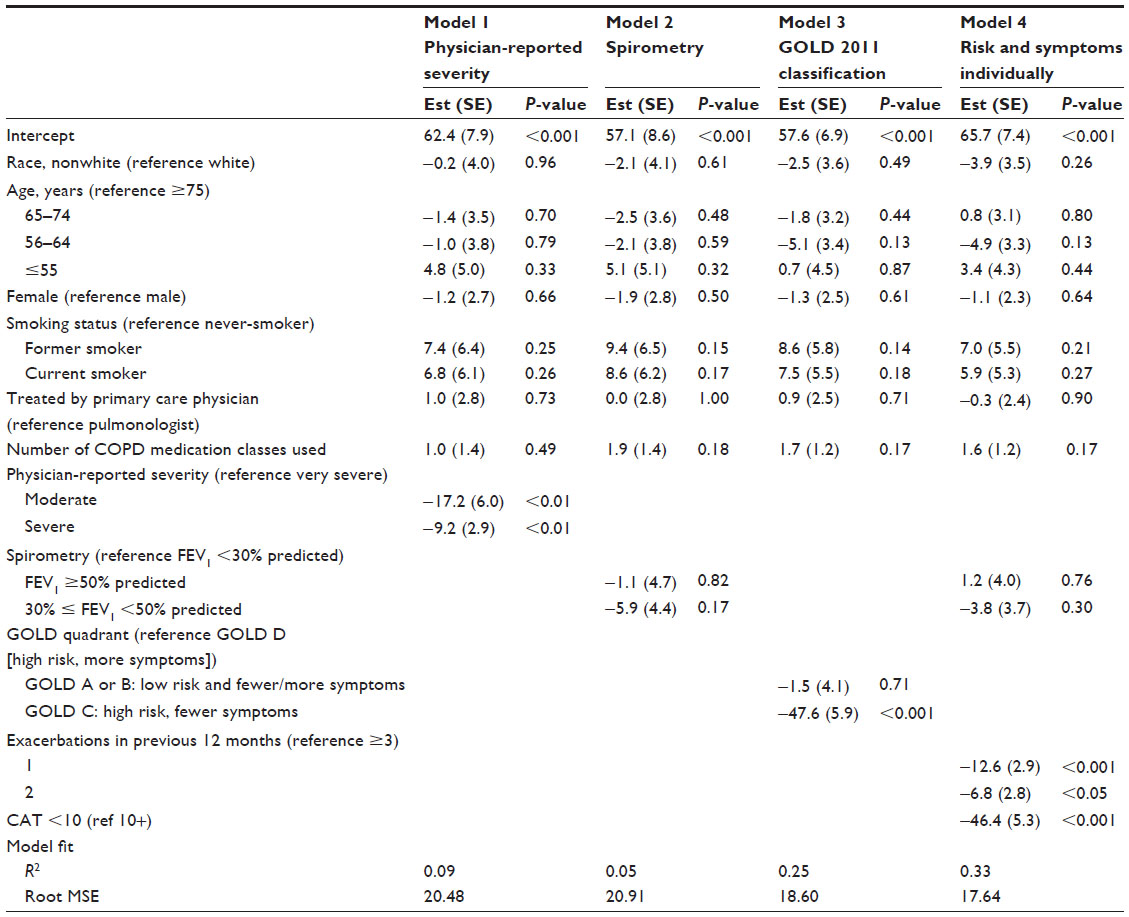 | Table 3 Multivariable models of SGRQ-C scores |
Discussion
Within this cohort of primarily severe and very severe COPD patients, the majority of patients were classified as severe or very severe by their physicians, and fell into 2011 GOLD category D. There was poor agreement between GOLD 2007 spirometry measures of COPD and physician-reported severity. In comparison, there was better agreement between the GOLD 2011 classification system and physician assessment after patient reports of symptoms were incorporated within the assessment of severity. This study also notes the poor correlation of spirometry results with quality of life, and confirms the substantial impact of exacerbations on quality of life, alone or as incorporated within the GOLD 2011 severity-classification system.
Spirometric assessment alone was not associated with changes in the SGRQ-C score. The finding that spirometry was not predictive of SGRQ scores is consistent with previous literature comparing SGRQ-C to spirometry metrics,11 although it should be noted that these studies were comparing change in SGRQ-C to change in FEV1 over time, whereas our study was cross-sectional. Moreover, it should be noted that model R2 values (a measure of model fit) ranged from 0.05 to 0.33, indicating poor model fit, particularly for models containing spirometry alone and also physician-reported severity alone. In terms of the relationship between exacerbation frequency and SGRQ-C score, our study was consistent in finding increased SGRQ-C scores with increasing exacerbations.12,13 For example, the long-term UPLIFT (Understanding Potential Long-term Impacts on Function with Tiotropium) trial documented an increase in SGRQ-C total scores of 0.38 (placebo)/0.72 (tiotropium) for patients who did not experience any exacerbations, and 2.86 (controls)/1.99 (tiotropium) for patients who had experienced more than two exacerbations during follow-up.13 Within our analysis, patients with one exacerbation in the year prior to measurement had an SGRQ-C score that was 12.6 points lower on average compared to patients with three or more exacerbations.
Our cohort focused on patients with severe and very severe COPD who had recently experienced an exacerbation, capturing a “snapshot” during a period of increased disease activity. This was done deliberately to understand the impact of exacerbations on patient-reported health status, but also provides an interesting case study for evaluating the application of the A–D grouping system. The majority of our patients fell into quadrant D, which would be expected given the original cohort-selection criteria: patients were required to have been diagnosed with severe or very severe COPD at some point within their treatment history. This does limit the generalizability of these results beyond patients with more severe COPD. Few patients had mild or moderate disease at their most recent visit, which limits our ability to fully understand what was occurring at the lower ends of the COPD-severity spectrum. Moreover, although random selection criteria were utilized to select patients at the practice level and the study aimed to represent all regions of the US, study designs such as these are predisposed to selection bias. For example, physicians in this study included those who could be contacted and were willing to participate, and these may have differed from those who did not wish to participate. Not all participating physicians had the same number of patients, and some of the results may possibly be over- or underrepresented by patients from a particular practice.
Since the 2011 update of the GOLD guidelines was released around the time that this chart review was conducted, it is unclear as to whether this would impact physician self-report. It should also be emphasized that the CAT scores utilized within this analysis were derived directly from SGRQ-C items. The lack of access to CAT and Medical Research Council dyspnea scores potentially affects the symptom estimation in this study. Although a previous study showed the feasibility of relating CAT scores to health status of COPD,10 interdependence between this measure of symptoms and the SGRQ-C as an outcome cannot be avoided. In addition, there was no assessment of spirometric quality within the primary care setting: given the data collected, we were unable to distinguish between pulmonary function tests performed at referral laboratories rather than simply by hand-held spirometer in the office. Further analysis should be conducted to evaluate the impact of spirometric quality on COPD-severity assessment. Lastly, this chart review did not collect data regarding comorbid conditions that may have an impact on quality of life, and thus this remains unmeasured within the present study. Nevertheless, this study also has a number of strengths. This chart review was less likely to be biased by the characteristics of one particular physician practice as many practices were included within the study, including both patients treated by PULMs as well as PCPs. The combination chart-review/patient-survey data-collection format allowed for the side-by-side collection of patient-reported data, including measures of health status, and chart-documented clinical information, including exacerbations requiring treatment within the previous 12 months and spirometry.
From this analysis, we can conclude that for recently exacerbating patients with primarily severe or very severe COPD, the GOLD 2011 use of both exacerbation risk and symptoms in classifying COPD severity more closely aligns with physician-reported classification of COPD severity, as well as patient-reported health status, when compared to spirometry-based definitions alone. This is a promising finding, as interest continues in use of patient-reported outcomes to inform clinical decision making. Future studies to compare descriptive COPD classification systems are warranted, particularly for patients with mild COPD.
Acknowledgments
The research funding of this study was provided by Forest Research Institute, Inc. Assistance with editing and formatting of the manuscript for submission by Prescott Medical Communications Group (Chicago, IL, USA) was made possible by funding from Forest Research Institute, Inc., (Jersey City, NJ, USA), a wholly owned subsidiary of Forest Laboratories (New York, NY, USA). The authors would also like to acknowledge and thank the peer reviewers of this manuscript for their feedback.
Disclosure
CS, SL, and XG are employees of Pharmerit International, and were paid consultants to Forest Research Institute in the development and execution of this study and manuscript. CM and MK are employees of Medical Data Analytics, and were paid consultants to Forest Research Institute, Inc., for conducting survey and data collection. SXS is an employee of Forest Research Institute, the sponsor of this study. AS has served as an investigator to, consultant for, or speaker for Astellas, Bayer, Cubist, Forest, Pfizer, Theravance, and Trius Therapeutics. The authors have no further conflicts of interest in this work.
References
Mannino DM, Buist AS. Global burden of COPD: risk factors, prevalence, and future trends. Lancet. 2007;370(9589):765–773. | |
Mathers CD, Loncar D. Projections of global mortality and burden of disease from 2002 to 2030. PLoS Med. 2006;3(11):e442. | |
Rabe KF, Hurd S, Anzueto A, et al. Global strategy for the diagnosis, management, and prevention of chronic obstructive pulmonary disease: GOLD executive summary. Am J Respir Crit Care Med. 2007;176(6):532–555. | |
Vestbo J, Hurd S, Agustí A, et al. Global strategy for the diagnosis, management, and prevention of chronic obstructive pulmonary disease: GOLD executive summary. Am J Respir Crit Care Med. 2013;187(4):347–365. | |
Buffels J, Degryse J, Heyrman J, Decramer M, Study D. Office spirometry significantly improves early detection of COPD in general practice: the DIDASCO Study. Chest. 2004;125(4):1394–1399. | |
Bolton CE, Ionescu AA, Edwards PH, Faulkner TA, Edwards SM, Shale DJ. Attaining a correct diagnosis of COPD in general practice. Respir Med. 2005;99(4):493–500. | |
Meguro M, Barley EA, Spencer S, Jones PW. Development and Validation of an Improved, COPD-Specific Version of the St George Respiratory Questionnaire. Chest. 2007;132(2):456–463. | |
Celli BR, MacNee W, Force AE. Standards for the diagnosis and treatment of patients with COPD: a summary of the ATS/ERS position paper. Eur Respir J. 2004;23(6):932–946. | |
Jones P, Terrace C. St George’s Respiratory Questionnaire for COPD Patients (SGRQ-C) Manual. London: St George’s University of London; 2008. | |
Jones PW, Tabberer M, Chen WH. Creating scenarios of the impact of COPD and their relationship to COPD Assessment Test (CAT) scores. BMC Pulm Med. 2011;11:42. | |
Oga T, Nishimura K, Tsukino M, Sato S, Hajiro T, Mishima M. Longitudinal deteriorations in patient reported outcomes in patients with COPD. Respir Med. 2007;101(1):146–153. | |
Spencer S, Calverley PM, Burge PS, Jones PW. Impact of preventing exacerbations on deterioration of health status in COPD. Eur Respir J. 2004;23(5):698–702. | |
Halpin DM, Decramer M, Celli B, Kesten S, Liu D, Tashkin DP. Exacerbation frequency and course of COPD. Int J Chron Obstruct Pulmon Dis. 2012;7:653–661. |
 © 2014 The Author(s). This work is published and licensed by Dove Medical Press Limited. The full terms of this license are available at https://www.dovepress.com/terms.php and incorporate the Creative Commons Attribution - Non Commercial (unported, v3.0) License.
By accessing the work you hereby accept the Terms. Non-commercial uses of the work are permitted without any further permission from Dove Medical Press Limited, provided the work is properly attributed. For permission for commercial use of this work, please see paragraphs 4.2 and 5 of our Terms.
© 2014 The Author(s). This work is published and licensed by Dove Medical Press Limited. The full terms of this license are available at https://www.dovepress.com/terms.php and incorporate the Creative Commons Attribution - Non Commercial (unported, v3.0) License.
By accessing the work you hereby accept the Terms. Non-commercial uses of the work are permitted without any further permission from Dove Medical Press Limited, provided the work is properly attributed. For permission for commercial use of this work, please see paragraphs 4.2 and 5 of our Terms.