")
Back to Journals » International Journal of Nanomedicine » Volume 11
Comparison of cellular effects of starch-coated SPIONs and poly(lactic-co-glycolic acid) matrix nanoparticles on human monocytes
Authors Gonnissen D, Qu Y, Langer K, Öztürk C, Zhao Y, Chen C, Seebohm G, Düfer M, Fuchs H, Galla HJ, Riehemann K
Received 17 February 2016
Accepted for publication 11 May 2016
Published 14 October 2016 Volume 2016:11 Pages 5221—5236
DOI https://doi.org/10.2147/IJN.S106540
Checked for plagiarism Yes
Review by Single anonymous peer review
Peer reviewer comments 2
Editor who approved publication: Dr Thomas Webster
Dominik Gonnissen,1 Ying Qu,1,2 Klaus Langer,3 Cengiz Öztürk,4 Yuliang Zhao,2 Chunying Chen,2 Guiscard Seebohm,5 Martina Düfer,6 Harald Fuchs,1 Hans-Joachim Galla,7 Kristina Riehemann1
1Center for Nanotechnology, Institute of Physics, University of Münster, Münster, Germany; 2National Center for Nanoscience and Technology, Chinese Academy of Sciences, Beijing, People’s Republic of China; 3Institute of Pharmaceutical Technology and Biopharmacy, University of Münster, Münster, 4chemicell GmbH, Berlin, 5Department of Cardiovascular Medicine, Institute for Genetics of Heart Diseases, University Hospital Münster, 6Department of Pharmacology, Institute of Pharmaceutical and Medicinal Chemistry, 7Department of Cell Biology/Biophysics, Institute of Biochemistry, University of Münster, Münster, Germany
Abstract: Within the last years, progress has been made in the knowledge of the properties of medically used nanoparticles and their toxic effects, but still, little is known about their influence on cellular processes of immune cells. The aim of our comparative study was to present the influence of two different nanoparticle types on subcellular processes of primary monocytes and the leukemic monocyte cell line MM6. We used core-shell starch-coated superparamagnetic iron oxide nanoparticles (SPIONs) and matrix poly(lactic-co-glycolic acid) (PLGA) nanoparticles for our experiments. In addition to typical biocompatibility testing like the detection of necrosis or secretion of interleukins (ILs), we investigated the impact of these nanoparticles on the actin cytoskeleton and the two voltage-gated potassium channels Kv1.3 and Kv7.1. Induction of necrosis was not seen for PLGA nanoparticles and SPIONs in primary monocytes and MM6 cells. Likewise, no alteration in secretion of IL-1β and IL-10 was detected under the same experimental conditions. In contrast, IL-6 secretion was exclusively downregulated in primary monocytes after contact with both nanoparticles. Two-electrode voltage clamp experiments revealed that both nanoparticles reduce currents of the aforementioned potassium channels. The two nanoparticles differed significantly in their impact on the actin cytoskeleton, demonstrated via atomic force microscopy elasticity measurement and phalloidin staining. While SPIONs led to the disruption of the respective cytoskeleton, PLGA did not show any influence in both experimental setups. The difference in the effects on ion channels and the actin cytoskeleton suggests that nanoparticles affect these subcellular components via different pathways. Our data indicate that the alteration of the cytoskeleton and the effect on ion channels are new parameters that describe the influence of nanoparticles on cells. The results are highly relevant for medical application and further evaluation of nanomaterial biosafety.
Keywords: actin cytoskeleton, cell elasticity, AFM, ion channels, patch clamp, TEVC
Introduction
Nanoparticles are low-sized materials established in the medical field. Due to their high surface/volume ratio which is related to the small size, and the variety of surface modifications, nanoparticles are suitable for applications like medical imaging or drug delivery.1,2 With regard to material and architecture, there are different species of nanoparticles described. Two general classes of nanoparticles are the core–shell3 and the matrix4 nanoparticles. Core–shell nanoparticles, which in our case are based on a magnetite core and a starch shell, are built up by two main components: the central part which is usually the active agent in the medical field and an encasing, for example, targeting or to improve bioavailability. The matrix nanoparticles on the other hand consist of a component where the active agent is entrapped.5 In our work, we used poly(lactic-co-glycolic acid) (PLGA) as a carrier material. These two systems were chosen because of their comparable hydrodynamic diameters, zeta potentials, and densities. Both types of nanoparticles are intensely used in diagnostics and therapy and have been reported to be highly biocompatible and nontoxic as well.5,6 Thus, they act as well-defined model systems for our studies on the influence of nanomaterials on cellular reactions.
As soon as nanomaterials come into contact with biological fluids, they are covered with a protein layer,7 the so-called protein corona, a process which is dependent on nanoparticle characteristics8–10 and serves as a mechanism protecting the body against unwanted side reactions caused by nanoparticles. Nonetheless, nanoparticle–cell interaction may result in different molecular reactions, like change in gene expression and signaling events or alteration of calcium homeostasis,11 even if the nanoparticles are covered by a protein layer. To prevent unwanted or life-threatening side reactions like allergic shock, it is crucial to know about the effects of nanoparticles on key cells of the immune system. Macrophages and their precursors, the monocytes, play a pivotal role in the identification of foreign materials. As soon as the nanomaterials enter the blood stream, they mediate the following reaction of the immune system by activation of phagocytosis and secretion of chemokines. Accordingly, for the successful medical application of nanoparticles, these cells play a central role. Monocytes of the peripheral blood are in our focus because these primary cells present reactions of healthy cells, while MM6 cells reflect the reactivity related to cancerous conditions. In the case of ion channels, we tested whether the results obtained from transfected oocytes can be transferred to a leukemic cell line, as an overexpression of Kv channels was reported for cancer cells.12 MM6 cells provided the advantage to study potential effects of nanoparticles on potassium channels, while their phenotype is still closely related to mature monocytes.13
During the first contact between cells and nanoparticles, the latter might interfere with ion channels located at the cell surface. Ion channels are pivotal in processes like maintaining osmolarity and membrane potential,14 shaping action potentials,15 or regulating other physiological signals.16 They can also play a relevant part in the development of cancer12 and are needed for differentiation and activation of cells.17 For developmental processes in immune cells, especially potassium channels have a significant impact.18 The connection between ion channels and the cytoskeleton is tight and quite important to keep the ion channels working. With proteins like cortactin, the connections between ion channels and cytoskeleton are established. This is reported to help maintain the function and integrity of the channels.19 The actin cytoskeleton is also directly and indirectly bound to lipid rafts which are known for the enrichment of Kv channels.20 A change in cytoskeleton may cause alteration of the ion channels or vice versa. This effect is known especially in highly mobile, secreting cells like macrophages.21 Alteration of the actin cytoskeleton is also described to be a symptom for cancerous transformation of cells22 and is related to cell properties like protrusion and adhesion during cellular migration.23 In general, the cytoskeleton is responsible for the location of proteins embedded within the membrane.24 The elasticity of cells is a significant marker of the change in the status of the cytoskeleton network.25
In this work, we investigated the influence of starch-coated superparamagnetic iron oxide nanoparticles (SPIONs) and PLGA nanoparticles as examples for core–shell and matrix nanoparticles, respectively, on primary monocytes and the leukemic monocyte cell line MM6. In particular, we compared the formation of protein corona, nanoparticle uptake, induction of interleukin (IL) secretion, modulation of cell elasticity, and influence on distribution of the actin cytoskeleton in primary monocytes as well as the MM6 cell line. To investigate cytokine secretion, we analyzed IL-1β as an inflammatory marker,26 IL-10 as an anti-inflammatory marker,27 and IL-6 as a marker of cancer and autoimmune diseases.28–31
Modulation of ion channel activation was studied in a proof-of-concept experiment on two voltage-gated potassium channels in a Xenopus laevis oocyte expression system using the two-electrode voltage clamp (TEVC) setup. The obtained results demonstrate that clinically relevant nanoparticles can modify basic structural assemblies like cytoskeleton proteins and functional properties like ion channel function or IL secretion.
Materials and methods
Nanoparticles
Commercially available SPIONs (nano-screenMAG/R-D 200 nm), used for magnetic resonance imaging diagnostic procedure and covalent coupling of bioligands, were obtained from chemicell GmbH (Berlin, Germany). SPIONs coated with a red fluorescent (excitation/emission maximum of 578/613 nm) dye and an outer layer of starch with a hydrodynamic diameter of 200 nm were chosen for experiments.
The PLGA nanoparticles were prepared according to the method described by Grünebaum et al.32 PLGA nanoparticles with 5,10,15,20-Tetrakis-(3-hydroxyphenyl)-porphyrin (mTHPP) as entrapped active agent and a hydrodynamic diameter of 240 nm were used for this work. The active agent mTHPP has an excitation/emission maximum of 420/650 nm. The properties of the nanoparticles are summarized in Table 1.
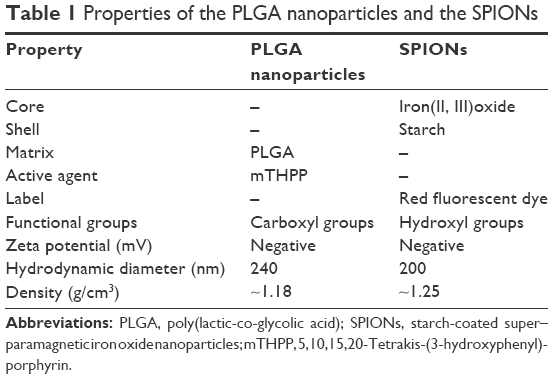 | Table 1 Properties of the PLGA nanoparticles and the SPIONs |
Isolation and cultivation of human monocytes of the peripheral blood
Primary monocytes were isolated from healthy donor buffy coats obtained from the German Red Cross (Muenster, Germany). A modified isolation method33,34 using Ficoll gradient centrifugation followed by a magnetic-activated cell sorting using anti-CD14-coated beads (Miltenyi Biotec, Bergisch Gladbach, Germany) was applied. Enrichment of CD14-positive CD80-negative cells was routinely verified using monoclonal antibodies against CD14 and CD80, whereas the CD14-positive fraction had to be >90% and the CD80-positive fraction <10%. The cells were cultured in McCoy’s 5A modified medium with 15% fetal bovine serum (FBS), 1X nonessential amino acids, 20 mM L-glutamine, and 1 mM sodium pyruvate (Biochrom GmbH, Berlin, Germany) at 37°C and 5% CO2.
Cell culture of the MM6 cell line
The MM6 cell line was acquired from the “Deutsche Sammlung für Mikroorganismen und Zellkulturen” (Braunschweig, Germany). Cell culture medium was Rosewell Park Memorial Institute 1640 supplemented with 10% FBS, 2 mM L-glutamine, 1X nonessential amino acids, 1 mM sodium pyruvate (Biochrom), and 10 μg/mL human insulin (Sigma-Aldrich Co., St Louis, MO, USA). The cells were subcultured every 5 days and seeded at a concentration of 3×10⁵ cells/mL in 12 mL medium in a 75 cm2 cell culture flask (Greiner Bio-One, Kremsmünster, Austria) and kept in a humidified incubator at 37°C and 5% CO2.
Cytotoxicity assay
The cytotoxicity was determined by using the CytoTox-Glo assay kit from Promega Corporation (Fitchburg, WI, USA) according to Niles et al35 and manufacturer’s protocol. Shortly, 2.5×10⁵ cells were seeded in black μClear 96-well plates (Greiner Bio-One), and incubated overnight prior to adding controls and samples to the cells. The exposure time to the substances was 4 hours. Digitonin (50 μg/mL) was used as cytotoxicity standard (positive control), cell culture medium as negative control, and water to exclude toxic effects of the solvent. The measured data were blank-corrected and normalized to the negative control.
Cytokine detection via ELISA
Leukocytes were incubated at a concentration of 5×10⁵ cells with 500 ng/mL nanoparticles, 1 μg/mL lipopolysaccharide (LPS), and water or cell culture media for 12 hours. The suspension was filled into vials and centrifuged for 10 minutes at 13,000 rpm. The supernatant was used as samples for the enzyme-linked immunosorbent assay. Assays were done with commercially available enzyme-linked immunosorbent assay detection kit for IL-1β, IL-6, and IL-10 (Thermo Fisher Scientific, Waltham, MA, USA) according to the manufacturer’s protocols. For the experiments, 96-well Nunc Maxisorp plates (Thermo Fisher Scientific) were used. The detection of the colorimetric reaction was performed within 30 minutes in a plate photometer at 450 nm.
Protein corona formation
Nanoparticles were incubated at a concentration of 500 ng/mL in 4 mL cell culture medium for 4 hours. All experiments were performed with cell culture medium containing the same charge of FBS to get comparable results. The nanoparticles were spun down for 15 minutes at 13,000 rpm, washed twice with phosphate-buffered saline (PBS), and resuspended in 20 μL water. A 20 μL aliquot sodium dodecyl sulfate (SDS) polyacrylamide gel electrophoresis sample buffer (0.5 M Tris, 5.2 mM SDS, 15% [v/v] glycerol, 65 mM dithiothreitol, 14 μM bromophenol blue; pH 6.8) was added, and the samples were boiled for 5 minutes at 95°C. SDS polyacrylamide gel electrophoresis was performed on a 10% resolution gel stacked with a 4% stacking gel in MOPS buffer (50 mM MOPS, 50 mM Tris, 3.5 mM SDS, 1 mM ethylene diamine tetraacetic acid, 5 mM sodium bisulfite; pH 7.7) at 200 V for 45 minutes. Protein transfer was done with the semidry sandwich technique on polyvinylidene difluoride membrane (Merck Millipore, Billerica, MA, USA) in Towbin transfer buffer (25 mM Tris, 192 mM glycine, 20% [v/v] methanol; pH 8.3) for 1 hour with 56 mA per 7×8 cm gel. Membranes were stained with Coomassie G-250 solution (40% [v/v] ethanol, 10% [v/v] acetic acid, 0.1% [w/v] Coomassie G-250) for the protein pattern. The membrane was visualized via specific immuno-staining. For the specific immuno-staining, the membrane was blocked overnight with 5% casein in Tris-buffered saline (TBS) (50 mM Tris, 150 mM NaCl; pH 7.6), washed with TBS, and incubated for 2 hours with a mixture of 200 ng/mL rabbit anti-bovine serum albumin (BSA) antibody (Abcam, Cambridge, UK) and 50 ng/mL goat anti-rabbit immunoglobulin G (IgG) antibody, coupled to alkaline phosphatase (Abcam) in 1% casein in TBS with 0.1% (v/v) Tween-20. Subsequently, the membranes were washed with TBS with Tween-20 prior to developing the protein pattern via nitro-blue tetrazolium chloride/5-bromo-4-chloro-3′-indoylphosphate p-toluidine salt staining technique (Sigma-Aldrich Co.). A stained protein ladder for the range 10–180 kDa (Abcam) was used to determine the molecular weight of the proteins.
Cellular uptake of nanoparticles
Cells were seeded at a density of 2.5×10⁵ cells/mL in 1 mL medium on coated glass coverslips and grown overnight. For the primary monocytes, 250 μg/mL fibronectin was used, and for the MM6 cell line, 100 μg/mL collagen was used. The cells were incubated with 500 ng/mL nanoparticles for 4 hours. Subsequently, the coverslips were washed twice with PBS, fixated with 4% paraformaldehyde in PBS for 15 minutes at 37°C, and mounted with a non-hardening 1:20 mixture of Vectashield 4′,6-diamidino-2-phenylindole (DAPI) mounting medium to Vectashield mounting medium (Vector Labs, Burlingame, CA, USA). Localization of nanoparticles was analyzed on a DM IRE2 confocal microscope (Leica Microsystems, Wetzlar, Germany) with a HCX PL APO ×63 oil-immersion objective (Leica Microsystems) and Type F immersion liquid (Leica Microsystems). For excitation, lasers with wavelengths of 405 (DAPI and mTHPP) and 594 nm (SPIONs) were used. The emission was detected between 451 and 471 nm (DAPI), 640 and 660 nm (mTHPP), or 603 and 623 nm (SPIONs).
Fluorescence imaging of F-actin
For F-actin staining, cells were seeded as described for the uptake experiments. Cells were fixed in 4% paraformaldehyde in PBS for 15 minutes at 37°C and permeabilized for 10 minutes with 0.1% Triton X-100. F-actin was stained with Alexa Fluor 555-conjugated phalloidin (Thermo Fisher Scientific). Cells were also stained with DAPI for the identification of nuclei. All steps during the staining process were conducted at room temperature in a dark room. After staining, cells were sandwiched between the glass coverslip and a glass slide and mounted with Fluoromount (Sigma-Aldrich Co.). Images were obtained with an Eclipse TE2000-U fluorescent microscope (Nikon Corporation, Tokyo, Japan) with a Plain Apo VC ×100 oil-immersion objective (Nikon Corporation) and Type F immersion liquid (Leica Microsystems).
Western blot of potassium channels
Samples were prepared from the same charge of cells to get comparable results by collecting 1×10⁷ cells in a tube and centrifuged for 10 minutes at 13,000 rpm. The pellet was washed twice with PBS and incubated with lysis buffer (150 mM NaCl, 50 mM Tris, 1% [v/v] Triton X-100; pH 8) with protease inhibitor cocktail (Sigma-Aldrich Co.) 1:10 (v/v) for 30 minutes on ice. The aqueous solution was sonicated with UP400S (Hielscher, Berlin, Germany) for 10 seconds with 0.5 cycles and 20% amplitude. To determine the protein content, a bicinchoninic acid assay (Thermo Fisher Scientific) was performed. Samples were brought to a concentration of 1 μg/mL with sample buffer (described earlier). Western blot was performed according to the aforementioned method.
Fluorescence staining of potassium channels
Cells from the same charge as used for the Western blot were seeded as described for the uptake experiments. After 15-minute fixation with 4% paraformaldehyde in PBS and 5-minute permeabilization with 0.1% Triton X-100 in PBS, free binding sites were blocked with 1% BSA in PBS for 30 minutes. Samples were incubated with rabbit anti-Kv1.3 (3 μg/mL), rabbit anti-Kv7.1 (4 μg/mL), or unspecific rabbit IgG (4 μg/mL) antibody, washed, and then incubated with goat anti-rabbit IgG coupled to Alexa Fluor 594 (10 μg/mL) prior to mounting them with Fluoromount. The used antibodies were anti-Kv1.3 (APC-002) (Alomone Labs, Jerusalem, Israel), anti-Kv7.1 (AB5932) (Merck Millipore), unspecific rabbit IgG (ab27478) (Abcam), and goat anti-rabbit IgG (A11012) (Thermo Fisher Scientific). Imaging was performed with the fluorescence microscope mentioned earlier.
TEVC technique
For these experiments, X. laevis oocytes (EcoCyte Bioscience, Austin, TX, USA) were cultured in Barth’s media (EcoCyte Bioscience) and measured in ND96 solution (96 mM NaCl, 4 mM KCl, 1.8 mM MgCl2, 1 mM CaCl2, 5 mM 4-(2-hydroxyethyl)-1-piperazineethanesulfonic acid [HEPES]; pH 7.6). The oocytes were microinjected with 1 ng Kv1.3 cRNA or 6 ng Kv7.1 plus 1.2 ng KCNE1 cRNA. The cRNA was kindly provided by the working group of Professor Seebohm from the Department of Cardiovascular Medicine of the Institute for Genetics of Heart Diseases of the University Hospital Muenster. The oocytes were incubated for 72 hours at 19°C for the protein expression of the injected RNA. Both nanoparticles were coated with a 250 μg/mL BSA solution in a 1:5 ratio for at least 24 hours on a rocking shaker. Prior to measuring, oocytes expressing the ion channels and uninjected control oocytes were incubated for 4 hours in ND96 media with 500 ng/mL nanoparticles, protected from light, and kept at 19°C. The measurement was done with a TEC-10 CX Amplifier (NPI Electronics, Tamm, Germany) and a Digidata 2000 Acquisition system (Molecular Devices LLC, Sunnyvale, CA, USA) connected to a computer with the ClampEx 9.2 software (Molecular Devices LLC). For measuring the Kv1.3 channel beginning from a holding potential of −80 mV, 2,000 ms square pulses from −70 to 60 mV with increments of 10 mV were used, and for the Kv7.1 channel, 3,000 ms square pulses from −100 to 60 mV with increments of 20 mV were used.
Patch clamp technique
Whole-cell currents were recorded with the patch clamp technique. An EPC 10 USB Amplifier (HEKA, Lambrecht, Germany) connected to a computer with the PatchMaster software (HEKA) was used for data acquisition. Patch electrodes with a resistance of 8–11 MΩ were produced in a DMZ Universal Puller (Zeitz, Martinsried, Germany) from borosilicate glass capillaries (Harvard Apparatus, Holliston, MA, USA) with an outer diameter of 1.5 mm and an inner diameter of 0.86 mm. The extracellular solution was composed of 120 mM NaCl, 5.4 mM KCl, 2 mM CaCl2, 1 mM MgCl2, 10 mM HEPES, and 25 mM D-glucose with a pH of 7.4 adjusted with NaOH. The capillaries were filled with 120 mM KCl, 1 mM CaCl2, 2 mM MgCl2, 10 mM HEPES, 11 mM ethylene glycol tetraacetic acid, and 20 mM D-glucose adjusted to pH 7.3 with KOH. After establishing a high-resistance seal, the leak current was set to zero. To measure voltage-gated potassium currents, from the −60 mV holding potential, a 0 mV square pulse of 200 ms was generated.
Cell elasticity measurements by AFM
Force spectroscopy experiments on the cells were done with an atomic force microscope MFP-3D Stand Alone (Asylum Research, Santa Barbara, CA, USA). PNPL-SiO colloidal cantilevers (sQube) with 6 μm spherical tips, 200 μm length, and a force constant of 0.08 N/m (NanoAndMore GmbH, Darmstadt, Germany) were used in the experiments and changed after each experiment. Spring constant values were measured via the thermal tuning method. One-day-old cells were seeded on 250 μg/mL fibronectin-coated glass coverslips at a density of 5×10⁴ cells/mL in 1 mL medium and attached overnight. The samples were incubated with 5 ng/mL tumor necrosis factor-α (TNF-α), 2 μg/mL LPS, 1 μM latrunculin A, 500 ng/mL SPIONs, or 500 ng/mL PLGA nanoparticles for 4 hours at 37°C and 5% CO2. Cells treated with TNF-α or LPS were taken as positive control, and cells treated with latrunculin A as negative control. Latrunculin A will increase the elasticity by preventing polymerization of G-actin to F-actin,36,37 and LPS as well as TNF-α will decrease the cell elasticity by triggering inflammatory processes in the cells.38 Cell viability was checked before starting measurement by adding Trypan blue (Biochrom) to the cell culture media for 3 minutes. Only living cells were used for measurements. All experiments were performed in Rosewell Park Memorial Institute 1640 culture medium (without phenol red) with 20 mM HEPES at room temperature. Force curves were acquired at the cytoplasmic area avoiding the nucleus. Measurements were done within 1 hour. To avoid any influence from cell–cell interactions, only cells without any contact to neighboring cells were measured. At least 150 independent measurements were performed for each designed experimental condition. In each treatment, at least 20 healthy cells were chosen to measure three times at three different positions. The indentation depth was controlled to be within 300 nm in order to better simulate cytoskeleton deformations which occur beneath the cell membrane. The force-versus-indentation curves from each measurement were analyzed using a Hertz model39 to obtain the Young’s modulus of each cell. Measurements on the cells with complete actin skeleton and destroyed actin skeleton were displayed comparatively. Young’s moduli were calculated as average values ± standard error of the mean.
Statistical analysis
Data are shown as mean value ± standard error of the mean. Statistical analysis was done with Prism 6 (GraphPad Software, Inc., La Jolla, CA, USA) using one-way analysis of variance followed by a Kruskal–Wallis test.
Results
Toxicity of nanoparticles
In order to use doses of investigated nanoparticles close to in vivo conditions, we chose a particle concentration of 500 ng/mL. Neither the PLGA nanoparticles nor the SPIONs showed any toxic effects on primary monocytes (Figure 1A) and the MM6 cell line (Figure 1B) at this concentration.
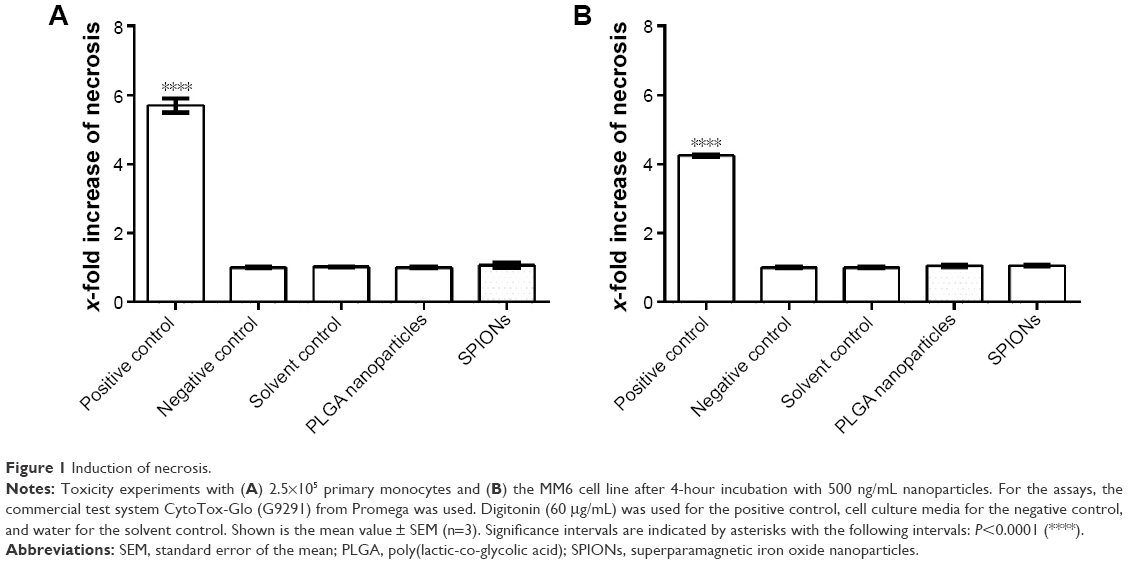 | Figure 1 Induction of necrosis. |
Protein corona
Nanoparticles incubated in cell culture medium with FBS as an additive formed a protein corona. BSA, an abundant protein in FBS, was visualized using Western blot followed by Coomassie G-250 or specific immuno-staining (Figure 2). The three parts of each subfigure originated from one gel. Just the relevant lanes are presented. The unspecific Coomassie G-250 staining (Figure 2A and B) revealed more proteins in the samples than the specific antibody staining (Figure 2C and D) indicating that the nanoparticles absorb other proteins in addition to BSA. BSA was detected for both types of nanoparticles in the FBS-containing cell culture medium (Figure 2C), whereas in the serum-free media (Figure 2D), no bands were detected. BSA, FBS, and cell culture media with FBS and without FBS served as markers. These results showed that BSA is part of the protein corona developed around the nanoparticles used for these experiments.
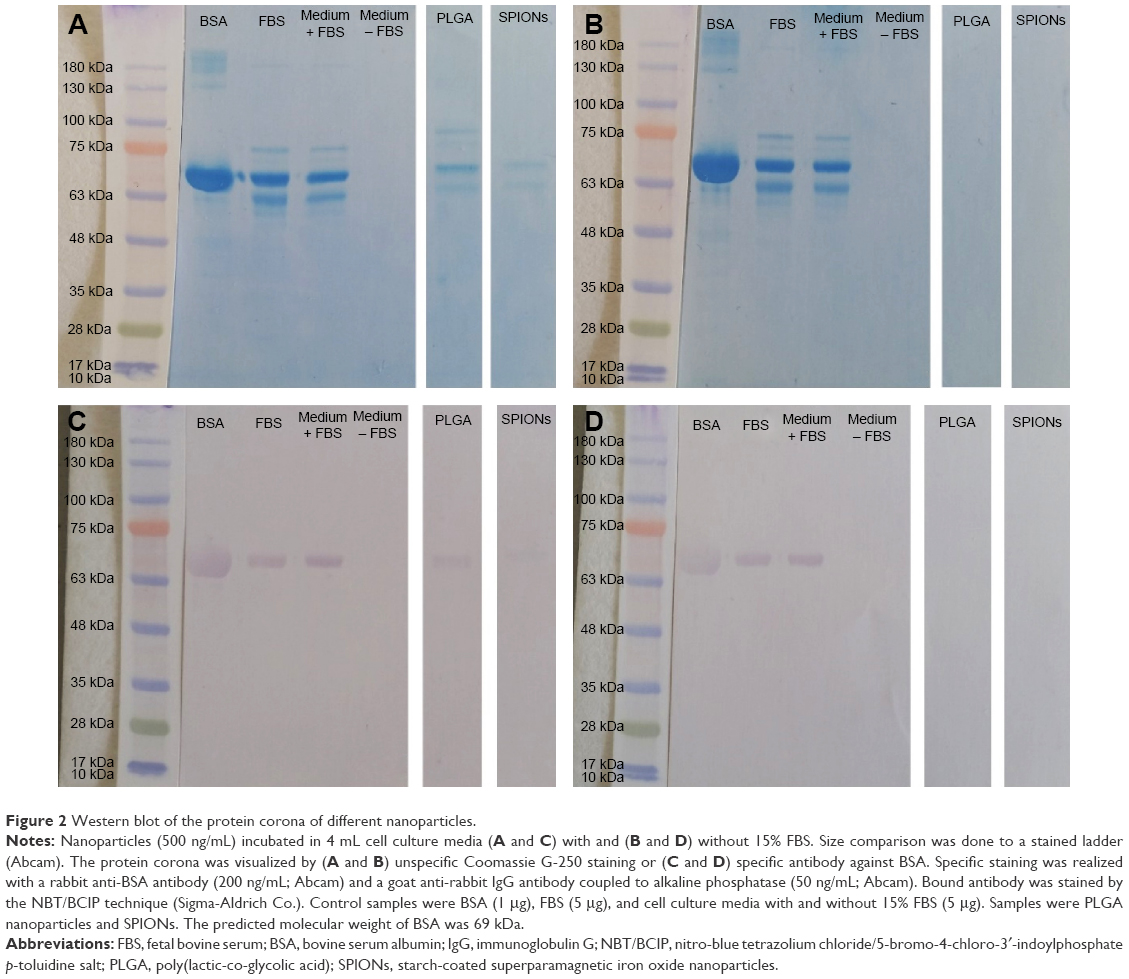 | Figure 2 Western blot of the protein corona of different nanoparticles. |
Uptake of nanoparticles
Experiments for uptake of nanoparticles were performed with primary monocytes and the MM6 cell line. Uptake of nanoparticles was visualized by confocal laser scanning microscopy. During imaging, one layer within the cell was visualized. The images for primary monocytes (Figure 3A and B) and MM6 cells (Figure 3C and D), respectively, show an enrichment of PLGA particles in the endosomal cell compartment. In case of SPIONs, neither for the primary monocytes (Figure 3E and F) nor for the MM6 cell line (Figure 3G and H), any red fluorescence indicative of nanoparticle accumulation was observed. Thus, there is obviously no indication for an enrichment or directed uptake of the nanoparticles.
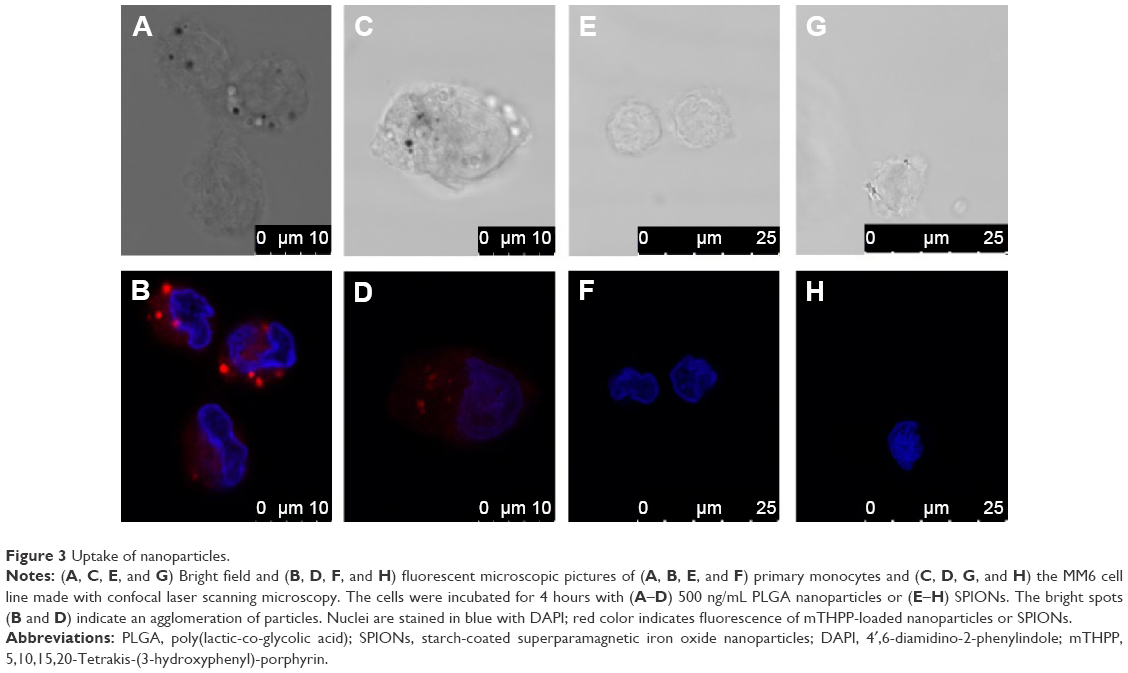 | Figure 3 Uptake of nanoparticles. |
Secretion of cytokines
For the MM6 cell line and the primary monocytes, PLGA nanoparticles and SPIONs did not affect the secretion of IL-1β or IL-10 compared to a negative control without nanoparticles (data not shown). For IL-6, secretion was reduced in primary monocytes but not in MM6 cells (Figure 4). IL-6 secretion of primary monocytes was reduced to approximately 20% compared to the negative control.
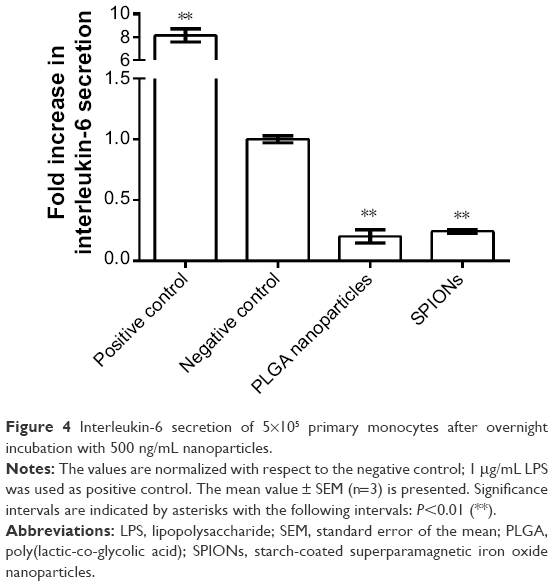 | Figure 4 Interleukin-6 secretion of 5×10⁵ primary monocytes after overnight incubation with 500 ng/mL nanoparticles. |
Identification of voltage-gated potassium channels in different cell systems
In these experiments, the effects of nanoparticles on two selected voltage-gated potassium channels, Kv1.3 and Kv7.1, were examined. To validate the existence of these channels, Western blots and immunocytochemistry were done with primary monocytes and the MM6 cell line. The Western blots (Figure 5) show selected bands of one gel. These indicate that in the leukemic monocyte cell line MM6, for the Kv1.3 ion channel, no protein of 63 kDa but a fragment of 35 kDa was observed (Figure 5A), which could be the Kvβ2 subunit of 39 kDa, whereas for the Kv7.1 ion channel, only unspecific staining and no protein of 75 kDa was identified (Figure 5B). For the primary monocytes (M0), no expression of Kv1.3 (Figure 5A) or Kv7.1 (Figure 5B) was detected.
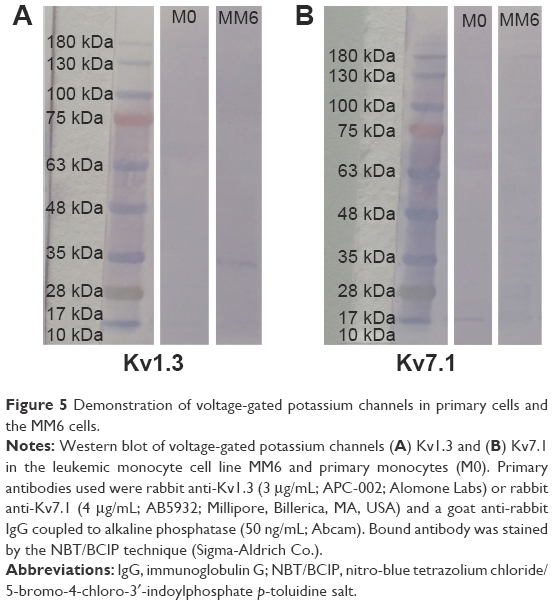 | Figure 5 Demonstration of voltage-gated potassium channels in primary cells and the MM6 cells. |
To verify the results of the Western blot experiments, immunocytochemistry was performed. In the fluorescent pictures (Figure 6) for the primary cells no signal of the Kv1.3 channel could be detected (Figure 6A) while a brighter fluorescence for the MM6 cell line can be observed (Figure 6B). For the Kv7.1 channel (Figure 6C and D) and the unspecific IgG staining (Figure 6E and F) no significant difference in fluorescence can be observed.
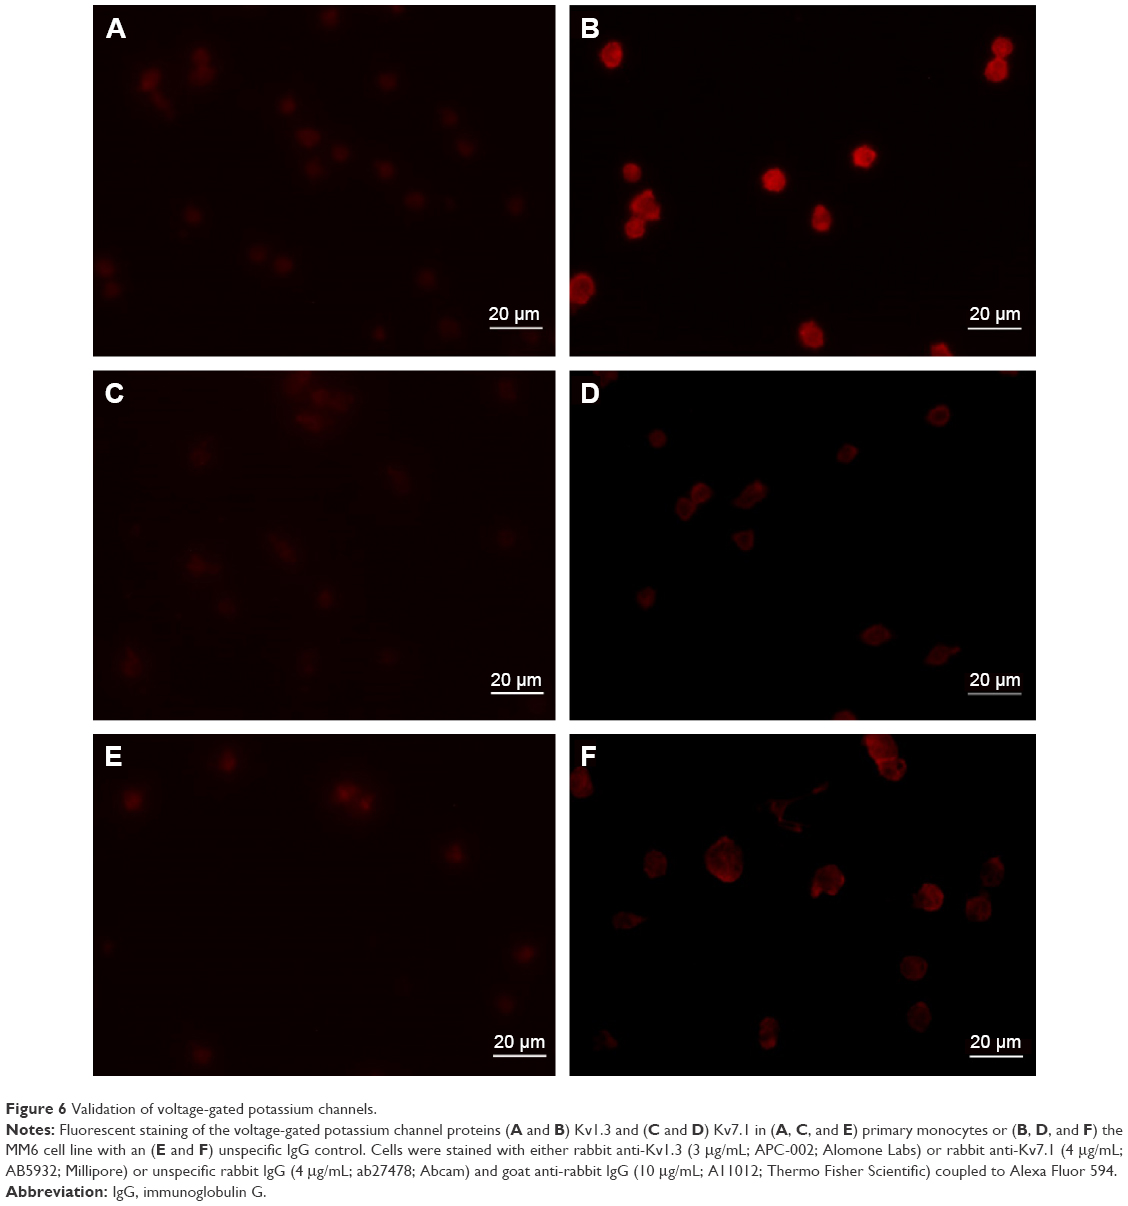 | Figure 6 Validation of voltage-gated potassium channels. |
Ion channel function
To investigate the effects of the nanoparticles on these voltage-gated potassium channels, two different experimental setups were used. First, we performed patch clamp experiments with primary monocytes and the MM6 cell line. In the “Supplementary materials” section, an example measurement (Figure S1) is presented, together with an inhibition experiment with tetraethylammonium (Figure S2) to ensure that the measured ion currents result from the activation of voltage-gated potassium channels.
In primary monocytes, no channel activity was measured (data not shown). This is in agreement with the negative results for protein expression. In the MM6 cell line that has been shown to express at least a subunit of Kv1.3, currents were detected (Figure 7). These currents were not reduced after preincubation with PLGA nanoparticles or SPIONs.
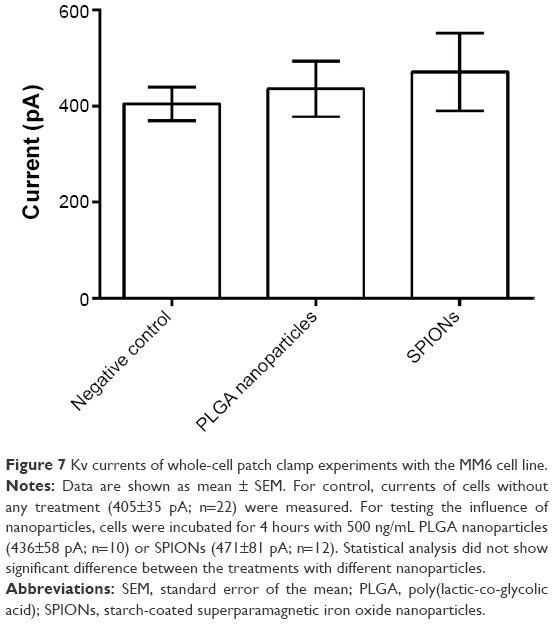 | Figure 7 Kv currents of whole-cell patch clamp experiments with the MM6 cell line. |
To investigate the impact of nanoparticles on one channel at a time, we used the TEVC setup with oocytes overexpressing Kv1.3 or 7.1. The TEVC experiments (Figure 8) indicated that the currents of both voltage-gated potassium channels were downregulated after incubation with nanoparticles. This is visible by comparing the curve of the control cells (Figure 8, black curve), which were injected with ion channel cRNA but not incubated with any substances, with the curve of ion channel expressing cells preincubated with PLGA nanoparticles (Figure 8, blue curve) or SPIONs (Figure 8, red curve). The current was clearly lowered by both nanoparticles but to a different extent. Whereas the SPIONs had a high impact on the ion currents, the PLGA nanoparticles showed a smaller effect. This observation was made for both voltage-gated potassium channels. The untransfected oocytes (Figure 8, green curve) showed no currents during the measurement. In this study, only the curve for the uninjected oocytes without nanoparticle incubation is shown as an example; the uninjected oocytes with nanoparticle incubation also showed no currents. Example measurements are presented in the “Supplementary materials” section (Figure S3).
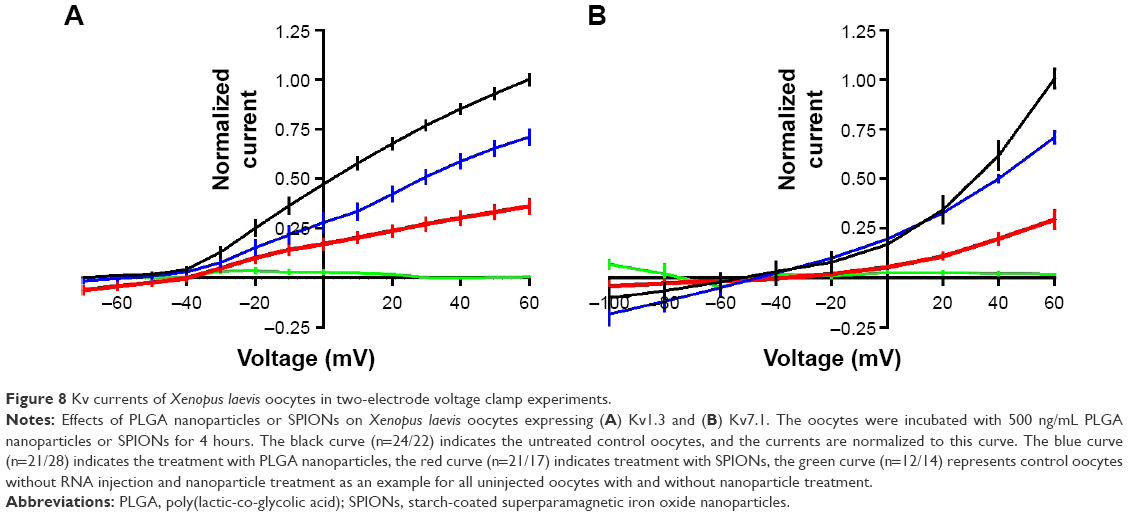 | Figure 8 Kv currents of Xenopus laevis oocytes in two-electrode voltage clamp experiments. |
Elasticity measurements
The terms elasticity and stiffness are reciprocally connected; that is, if the cell stiffness is increased, the elasticity decreases and vice versa. By comparing primary monocytes or the MM6 cell line incubated with nanoparticles to cells incubated with reagents with known effects on cell elasticity, it was possible to analyze the influence of the nanoparticles on cell stiffness. Experimental data are shown in Figure 9A for primary monocytes and Figure 9B for the MM6 cell line. An example measurement can be found in the “Supplementary materials” section (Figure S4). As expected, incubation of the cells with latrunculin A increased the elasticity of the cells, and induction of inflammatory processes via LPS or TNF-α decreased it. In comparison to these substances with known effects, the PLGA nanoparticles did not show an alteration of the elasticity, whereas the SPIONs increased it in an amount comparable to the latrunculin A control. To visualize and confirm the changes of the actin cytoskeleton, measured by AFM, staining experiments with phalloidin were done.
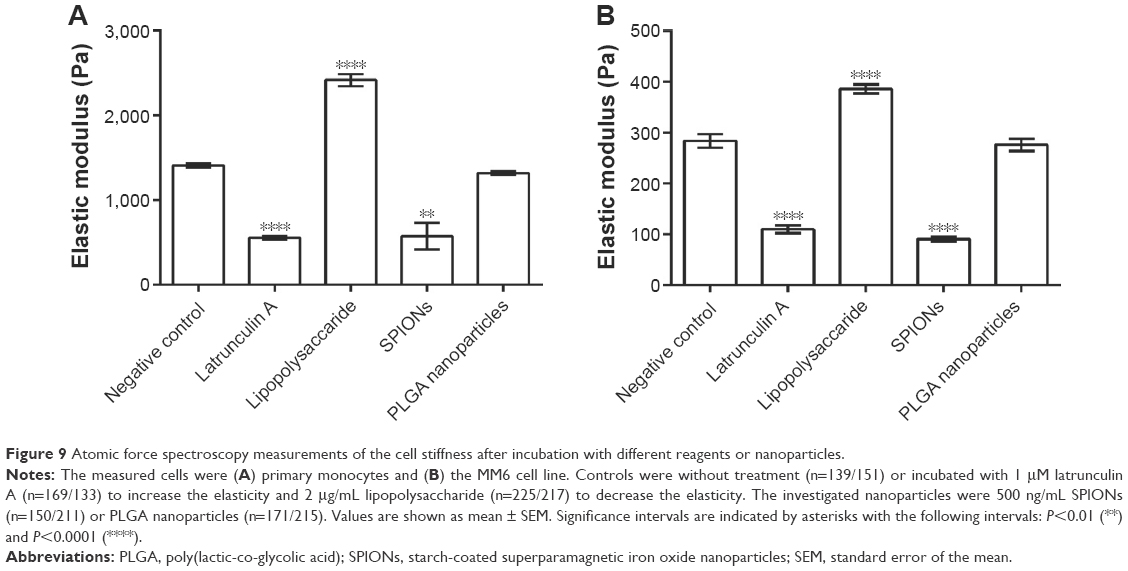 | Figure 9 Atomic force spectroscopy measurements of the cell stiffness after incubation with different reagents or nanoparticles. |
Visualization of changes in the actin cytoskeleton
The experiments with the AFM indicated that both the primary monocytes and the MM6 cell line responded in the same way to the nanoparticles. The SPIONs had an effect on the cells, whereas the PLGA nanoparticles did not. Consequently, we visualized the actin cytoskeleton by phalloidin staining. The actin cytoskeleton was examined after exposure to the different nanoparticles and compared to a control without any treatment. In Figure 10, the results for primary monocytes and MM6 cells are shown. By comparing the F-actin cytoskeleton of untreated controls and cells incubated with PLGA nanoparticles, no differences were observed which correlates with the results of the AFM experiments. Between the control and cells incubated with SPIONs, significant changes in the cytoskeleton were found. For both cell systems, the control cells and the PLGA-treated samples showed a widespread filamentous network, whereas the SPIONs-incubated samples lacked these filamentous spread of actin fibers. These results support our hypothesis that altered elasticity is linked to impairment of the actin cytoskeleton.
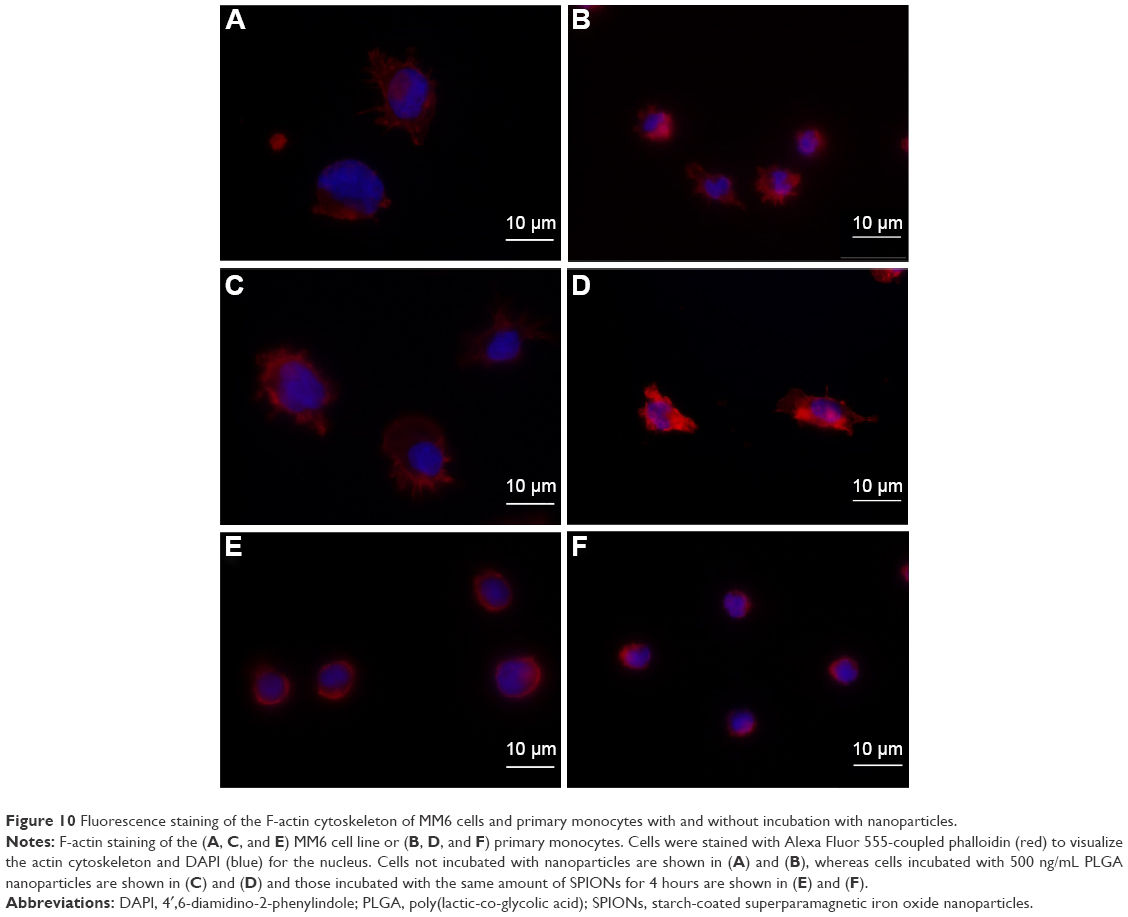 | Figure 10 Fluorescence staining of the F-actin cytoskeleton of MM6 cells and primary monocytes with and without incubation with nanoparticles. |
Discussion
With this work, we present a comparative study of the effects of two different nontoxic nanoparticles, their influence on ion channels, and alteration of cell elasticity caused by interactions with the actin cytoskeleton in primary monocytes and the MM6 cell line.
Prior to our investigation on cellular effects, we demonstrated the presence of a protein corona on the surface of our two nanoparticle systems. It is well known that nanoparticles form protein coronas after contact with biological fluids, a process that depends on nanoparticle characteristics.8–10 The effect of the commonly used nanoparticles on cells presented in this study is due to such a protein layer. PLGA nanoparticles and SPIONs are reported to be highly biocompatible and nontoxic.5,6,40–42 These findings are confirmed by our results that the nanoparticles in our experiments had no effects on primary monocytes or on the leukemic monocyte cell line MM6 in terms of necrosis. To describe their immunogenicity, we investigated the secretion of different ILs in both cell systems. As a result, secretion of neither IL-1β nor IL-10 was affected by the selected nanoparticles. This was supported by an experimental setup where the induction of IL-1β secretion was exclusively achieved by embedding LPS into the outer particle structure.43 Generally, PLGA is known to be a non-immunogenic material.44,45 Interestingly, IL-6 secretion was reduced in primary monocytes by both types of nanoparticles but not in MM6 cells, which fortifies again that biocompatibility and immunology studies with cancerous cells are not necessarily close to the response of a patient with a healthy immune system. This effect is described for macrophages after TiO2/protein corona contact, indicating a central role of this cytokine during interaction of specific nanoparticles with cells.46 The downregulation of IL-6 by the nanoparticles used for these experiments is a clear indication of their biocompatibility.
Voltage-gated potassium channels play a crucial role in the differentiation processes of monocytes and other cells of the immune system.18,47,48 Surprisingly, we could not confirm the existence of Kv1.3 channels in primary monocytes with any of the performed experiments, though they are described in the literature for their descendants, the macrophages.49–51 Nonetheless, it is also known that the expression levels of these tightly regulated proteins can differ depending on origin and differentiation status of the cells.18 On the other hand, the positive results for the leukemic monocyte cell line MM6 have proven that our experimental setups were working properly. While we were not able to show any regulatory effects of the nanoparticles in the patch clamp system, we could show that they have an impact on two voltage-gated potassium channels in a heterologous expression system. Unfortunately, the leukemic monocyte cell line MM6 is not yet characterized in terms of the expression of ion channels, though it is known that potassium channels, and especially the Kv1.3 and Kv1.5 channel complex, play a crucial role in the process of differentiation from monocytes to macrophages.18 Most likely, the effect of the nanoparticles depends on the type of Kv channel so that the cell might start to compensate the lack of function of one channel by increasing expression or upregulation of another channel. Another model would be that a certain amount of channels needs to be expressed before the regulative effects of the nanoparticles can be measured. Whereas the patch clamp system is better used to investigate effects on whole-cell systems, the TEVC system is better for investigating the effects on single channels. That nanoparticles can have a regulatory impact on ion channels was shown for SiO2 nanoparticles on TRP4 channels in a neuronal cell line.52 Ion channels are tightly connected to the cytoskeleton, especially to the actin fibers,19 either through bindings between specialized proteins and the fibers53 or through interaction between fibers and lipid rafts, in which the channels can be located.20 These connections allow the channels to maintain their function in the fluidic environment of the membrane.53 Next to these tasks, the investigation of cell elasticity is important as a marker of the healthiness of cells, since many processes are regulated by mechanical changes. For macrophages, the integrity of the cytoskeleton is of special interest, since the phagocytic activity is linked to the intact cytoskeleton.54 Alterations of cell elasticity can be associated with a variety of diseases,22,55,56 especially tumorous transformation of tissue or cells. Reorganization of the actin cytoskeleton is important for the migration of leukocytes into the tissue.57 Therefore, the increase of elasticity, as shown by the cells incubated with SPIONs, may have physiological impact such as reduced transmigration of monocytes through endothelial cells (Riehemann 2015, unpublished data). Though the influence of nanoparticles on the F-actin network was already described,58–60 no information to align these effects to structure, size, material, or other properties of the nanoparticles exists. It is well known that the actin cytoskeleton is the part of the cytoskeleton which is mostly responsible for cell stiffness, while the microtubule network only has a small effect on this parameter.25,55,56
As the actin cytoskeleton is important for the functionality and regulation61 of ion channels via the connection by proteins like cortactin,19 disruption can modulate the activity of different channels.24,62,63 Such an effect was, however, not observed in our patch clamp experiments with the MM6 cells. One explanation may be that expression and regulation of ion channels is so complex that the cell alters its expression pattern to maintain a working condition64 even with a disrupted actin cytoskeleton. Nevertheless, the disruptive effects of the SPIONs on the actin cytoskeleton alongside with the downregulating effect proven by the TEVC experiments could be connected. The PLGA nanoparticles on the other hand showed no alteration of the actin cytoskeleton but a downregulating effect on the ion channels. This could be the outcome of two different mechanisms of impact on the cell with the SPIONs altering the actin cytoskeleton via disruption of the actin network where the PLGA nanoparticles may work via disturbance of the membrane or the ion channels directly. How far this effect is caused by cellular uptake remains unclear. Though a high uptake of the PLGA nanoparticles was shown for two bile duct cancer cell lines,32 the little uptake of the SPIONs used in this work was shown for a comparable starch-coated magnetite nanoparticle.65 The effect of these findings is not obvious and has to be in focus of further investigations. In our systematic comparative study, we demonstrated that nanoparticles exposed to living system, for example, for medical purposes, alter the cellular processes at different levels.
Conclusion
In summary, our work demonstrates the alteration of selected potassium ion channels and the actin cytoskeleton by specific nanoparticles. The results show that in biological systems, nanomaterials may have more subtle effects than interference with cell death or inflammation. If these modifications are supporting or inhibiting, specific medical applications has to be investigated for each particle. We conclude that there are still more aspects to consider to open the opportunities of medical application of nanoparticles but also with respect to nanoparticle safety.
Acknowledgments
This work was financially supported by the German Ministry of Science and Education in context of the research projects MINAC (0315773A) and BioTraP for CCC (13N11390). The authors thank Judith Schmidt and Kathrin Hardes for perfect technical assistance.
Disclosure
The authors report no conflicts of interest in this work.
References
Na HB, Song IC, Hyeon T. Inorganic nanoparticles for MRI contrast agents. Adv Mater. 2009;21(21):2133–2148. | ||
Lü J, Wang X, Marin-Muller C, et al. Current advances in research and clinical applications of PLGA-based nanotechnology. Expert Rev Mol Diagn. 2009;9(4):325–341. | ||
Schärtl W. Current directions in core-shell nanoparticle design. Nanoscale. 2010;2(6):829–843. | ||
Langer R. Drug delivery and targeting. Nature. 1998;392(6679 Suppl):5–10. | ||
Danhier F, Ansorena E, Silva JM, Coco R, Le Breton A, Préat V. PLGA-based nanoparticles: an overview of biomedical applications. J Control Release. 2012;161(2):505–522. | ||
Lewinski N, Colvin V, Drezek R. Cytotoxicity of nanoparticles. Small. 2008;4(1):26–49. | ||
Ge C, Du J, Zhao L, et al. Binding of blood proteins to carbon nanotubes reduces cytotoxicity. Proc Natl Acad Sci U S A. 2011;108(41):16968–16973. | ||
Cedervall T, Lynch I, Lindman S, et al. Understanding the nanoparticle-protein corona using methods to quantify exchange rates and affinities of proteins for nanoparticles. Proc Natl Acad Sci U S A. 2007;104(7):2050–2055. | ||
Lundqvist M, Stigler J, Elia G, Lynch I, Cedervall T, Dawson KA. Nanoparticle size and surface properties determine the protein corona with possible implications for biological impacts. Proc Natl Acad Sci U S A. 2008;105(38):14265–14270. | ||
Sempf K, Arrey T, Gelperina S, et al. Adsorption of plasma proteins on uncoated PLGA nanoparticles. Eur J Pharm Biopharm. 2013;85(1):53–60. | ||
Roy R, Kumar S, Tripathi A, Das M, Dwivedi PD. Interactive threats of nanoparticles to the biological system. Immunol Lett. 2014;158(1–2):79–87. | ||
Kunzelmann K. Ion channels and cancer. J Membr Biol. 2005;205(3):159–173. | ||
Ziegler-Heitbroc HWL, Thiel E, Futterer A, Herzog V, Wirtz A, Riethmüller G. Establishment of a human cell line (mono mac 6) with characteristics of mature monocytes. Int J Cancer. 1988;41(3):456–461. | ||
McManus ML, Churchwell KB, Strange K. Regulation of cell volume in health and disease. N Engl J Med. 1995;333(19):1260–1266. | ||
Armstrong CM, Hille B. Voltage-gated ion channels and electrical excitability. Neuron. 1998;20(3):371–380. | ||
Blaustein MP, Lederer WJ. Sodium/calcium exchange: its physiological implications. Physiol Rev. 1999;79(3):763–854. | ||
Felipe A, Soler C, Comes N. Kv1.5 in the immune system: the good, the bad, or the ugly? Front Physiol. 2010;1:152. | ||
Vicente R, Escalada A, Coma M, et al. Differential voltage-dependent K+ channel responses during proliferation and activation in macrophages. J Biol Chem. 2003;278(47):46307–46320. | ||
Hajdu P, Martin GV, Chimote AA, Szilagyi O, Takimoto K, Conforti L. The C-terminus SH3-binding domain of Kv1.3 is required for the actin-mediated immobilization of the channel via cortactin. Mol Biol cell. 2015;26(9):1640–1651. | ||
Martens JR, O’Connell K, Tamkun M. Targeting of ion channels to membrane microdomains. Localization of KV channels to lipid rafts. Trends Pharmacol Sci. 2004;25(1):16–21. | ||
Etienne-Manneville S. Actin and microtubules in cell motility: which one is in control? Traffic. 2004;5(7):470–477. | ||
Xu W, Mezencev R, Kim B, Wang L, McDonald J, Sulchek T. Cell stiffness is a biomarker of the metastatic potential of ovarian cancer cells. PLoS One. 2012;7(10):e46609. | ||
Le Clainche C, Carlier M. Regulation of actin assembly associated with protrusion and adhesion in cell migration. Physiol Rev. 2008;88(2):489–513. | ||
Schubert T, Akopian A. Actin filaments regulate voltage-gated ion channels in salamander retinal ganglion cells. Neuroscience. 2004;125(3):583–590. | ||
Ketene AN, Roberts PC, Shea AA, Schmelz EM, Agah M. Actin filaments play a primary role for structural integrity and viscoelastic response in cells. Integr Biol. 2012;4(5):540–549. | ||
Dinarello CA. The biological properties of interleukin-1. Eur Cytokine Netw. 1994;5(6):517–531. | ||
Moore KW, de Waal Malefyt R, Coffman RL, O’Garra A. Interleukin-10 and the interleukin-10 receptor. Annu Rev Immunol. 2001;19:683–765. | ||
Samson M, Audia S, Janikashvili N, et al. Brief report: inhibition of interleukin-6 function corrects Th17/Treg cell imbalance in patients with rheumatoid arthritis. Arthritis Rheum. 2012;64(8):2499–2503. | ||
Simpson RJ, Hammacher A, Smith DK, Matthews JM, Ward LD. Interleukin-6: structure-function relationships. Protein Sci. 1997;6(5):929–955. | ||
Hirano T, Akira S, Taga T, Kishimoto T. Biological and clinical aspects of interleukin 6. Immunol Today. 1990;11:443–449. | ||
Yao X, Huang J, Zhong H, et al. Targeting interleukin-6 in inflammatory autoimmune diseases and cancers. Pharmacol Ther. 2014;141(2):125–139. | ||
Grünebaum J, Söbbing J, Mulac D, Langer K. Nanoparticulate carriers for photodynamic therapy of cholangiocarcinoma: in vitro comparison of various polymer-based nanoparticles. Int J Pharm. 2015;496(2): 942–952. | ||
de Almeida MC, Silva AC, Barral A, Barral Netto M. A simple method for human peripheral blood monocyte isolation. Mem Inst Oswaldo Cruz. 2000;95(2):221–223. | ||
Repnik U, Knezevic M, Jeras M. Simple and cost-effective isolation of monocytes from buffy coats. J Immunol methods. 2003;278(1–2):283–292. | ||
Niles AL, Moravec RA, Eric Hesselberth P, Scurria MA, Daily WJ, Riss TL. A homogeneous assay to measure live and dead cells in the same sample by detecting different protease markers. Anal Biochem. 2007;366(2):197–206. | ||
Coué M, Brenner SL, Spector I, Korn ED. Inhibition of actin polymerization by latrunculin A. FEBS Lett. 1987;213(2):316–318. | ||
Morton WM, Ayscough KR, McLaughlin PJ. Latrunculin alters the actin-monomer subunit interface to prevent polymerization. Nat Cell Biol. 2000;2(6):376–378. | ||
Honstettre A, Ghigo E, Moynault A, et al. Lipopolysaccharide from Coxiella burnetii is involved in bacterial phagocytosis, filamentous actin reorganization, and inflammatory responses through Toll-like receptor 4. J Immunol. 2004;172(6):3695–3703. | ||
Morkvėnaitė-Vilkončienė I, Ramanavičienė A, Ramanavičius A. Atomic force microscopy as a tool for the investigation of living cells. Medicina (Kaunas). 2013;49(4):155–164. | ||
Dinarvand R, Sepehri N, Manoochehri S, Rouhani H, Atyabi F. Polylactide-co-glycolide nanoparticles for controlled delivery of anticancer agents. Int J Nanomed. 2011;6:877–895. | ||
Fonseca C, Simões S, Gaspar R. Paclitaxel-loaded PLGA nanoparticles. Preparation, physicochemical characterization and in vitro anti-tumoral activity. J Control Release. 2002;83(2):273–286. | ||
Corot C, Robert P, Idée J, Port M. Recent advances in iron oxide nanocrystal technology for medical imaging. Adv Drug Deliv Rev. 2006;58(14):1471–1504. | ||
Demento SL, Eisenbarth SC, Foellmer HG, et al. Inflammasome-activating nanoparticles as modular systems for optimizing vaccine efficacy. Vaccine. 2009;27(23):3013–3021. | ||
Semete B, Booysen LIJ, Kalombo L, et al. In vivo uptake and acute immune response to orally administered chitosan and PEG coated PLGA nanoparticles. Toxicol Appl Pharmacol. 2010;249(2):158–165. | ||
Igartua M, Hernández R, Esquisabel A, Gascón A, Calvo M, Pedraz J. Enhanced immune response after subcutaneous and oral immunization with biodegradable PLGA microspheres. J Control Release. 1998;56(1–3):63–73. | ||
Borgognoni CF, Mormann M, Qu Y, et al. Reaction of human macrophages on protein corona covered TiO2 nanoparticles. Nanomedicine. 2015;11(2):275–282. | ||
Wu B, Wang X, Zhao B, et al. Electrophysiology properties of voltage-gated potassium channels in rat peritoneal macrophages. Int J Clin Exp Med. 2013;6(3):166–173. | ||
Villalonga N, David M, Bielanska J, et al. Immunomodulation of voltage-dependent K+ channels in macrophages: molecular and biophysical consequences. J Gen Physiol. 2010;135(2):135–147. | ||
Mackenzie AB, Chirakkal H, North RA. Kv1.3 potassium channels in human alveolar macrophages. Am J Physiol Lung Cell Mol Physiol. 2003;285(4):L862–L868. | ||
Vicente R, Escalada A, Villalonga N, et al. Association of Kv1.5 and Kv1.3 contributes to the major voltage-dependent K+ channel in macrophages. J Biol Chem. 2006;281(49):37675–37685. | ||
Villalonga N, Escalada A, Vicente R, et al. Kv1.3/Kv1.5 heteromeric channels compromise pharmacological responses in macrophages. Biochem Biophys Res Commun. 2007;352(4):913–918. | ||
Gilardino A, Catalano F, Ruffinatti FA, et al. Interaction of SiO2 nanoparticles with neuronal cells. Ionic mechanisms involved in the perturbation of calcium homeostasis. Int J Biochem Cell Biol. 2015;66:101–111. | ||
Mazzochi C, Benos DJ, Smith PR. Interaction of epithelial ion channels with the actin-based cytoskeleton. Am J Physiol Renal Physiol. 2006;291(6):F1113–F1122. | ||
Patel NR, Bole M, Chen C, et al. Cell elasticity determines macrophage function. PLoS One. 2012;7(9):e41024. | ||
Bhadriraju K, Hansen LK. Extracellular matrix- and cytoskeleton-dependent changes in cell shape and stiffness. Exp Cell Res. 2002;278(1):92–100. | ||
Rotsch C, Radmacher M. Drug-induced changes of cytoskeletal structure and mechanics in fibroblasts: an atomic force microscopy study. Biophys J. 2000;78(1):520–535. | ||
Barreiro O, Sánchez-Madrid F. Molecular basis of leukocyte–endothelium interactions during the inflammatory response. Rev Esp Cardiol. 2009;62(5):552–562. | ||
Huang X, Teng X, Chen D, Tang F, He J. The effect of the shape of mesoporous silica nanoparticles on cellular uptake and cell function. Biomaterials. 2010;31(3):438–448. | ||
Pi J, Yang F, Jin H, et al. Selenium nanoparticles induced membrane bio-mechanical property changes in MCF-7 cells by disturbing membrane molecules and F-actin. Bioorg Med Chem Lett. 2013;23(23):6296–6303. | ||
Gupta AK, Gupta M. Cytotoxicity suppression and cellular uptake enhancement of surface modified magnetic nanoparticles. Biomaterials. 2005;26(13):1565–1573. | ||
Janmey PA. The cytoskeleton and cell signaling: component localization and mechanical coupling. Physiol Rev. 1998;78(3):763–781. | ||
Negulyaev YA, Vedernikova EA, Maximov AV. Disruption of actin filaments increases the activity of sodium-conducting channels in human myeloid leukemia cells. Mol Biol Cell. 1996;7(12):1857–1864. | ||
Nakamura M, Sunagawa M, Kosugi T, Sperelakis N. Actin filament disruption inhibits L-type Ca2+ channel current in cultured vascular smooth muscle cells. Am J Physiol Cell Physiol. 2000;279(2):C480–C487. | ||
Rosati B, McKinnon D. Regulation of ion channel expression. Circ Res. 2004;94(7):874–883. | ||
Ruge CA, Kirch J, Cañadas O, et al. Uptake of nanoparticles by alveolar macrophages is triggered by surfactant protein A. Nanomedicine. 2011;7(6):690–693. |
Supplementary materials
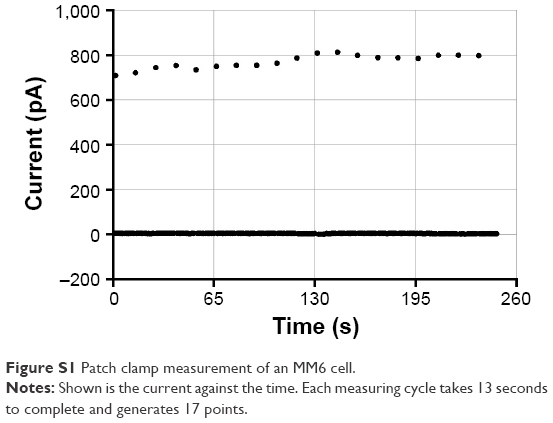 | Figure S1 Patch clamp measurement of an MM6 cell. |
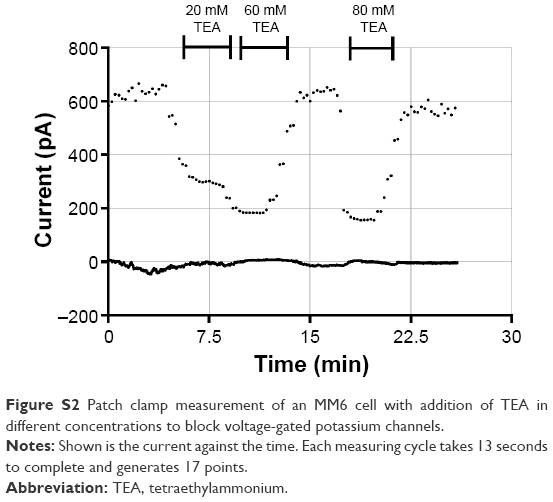 | Figure S2 Patch clamp measurement of an MM6 cell with addition of TEA in different concentrations to block voltage-gated potassium channels. |
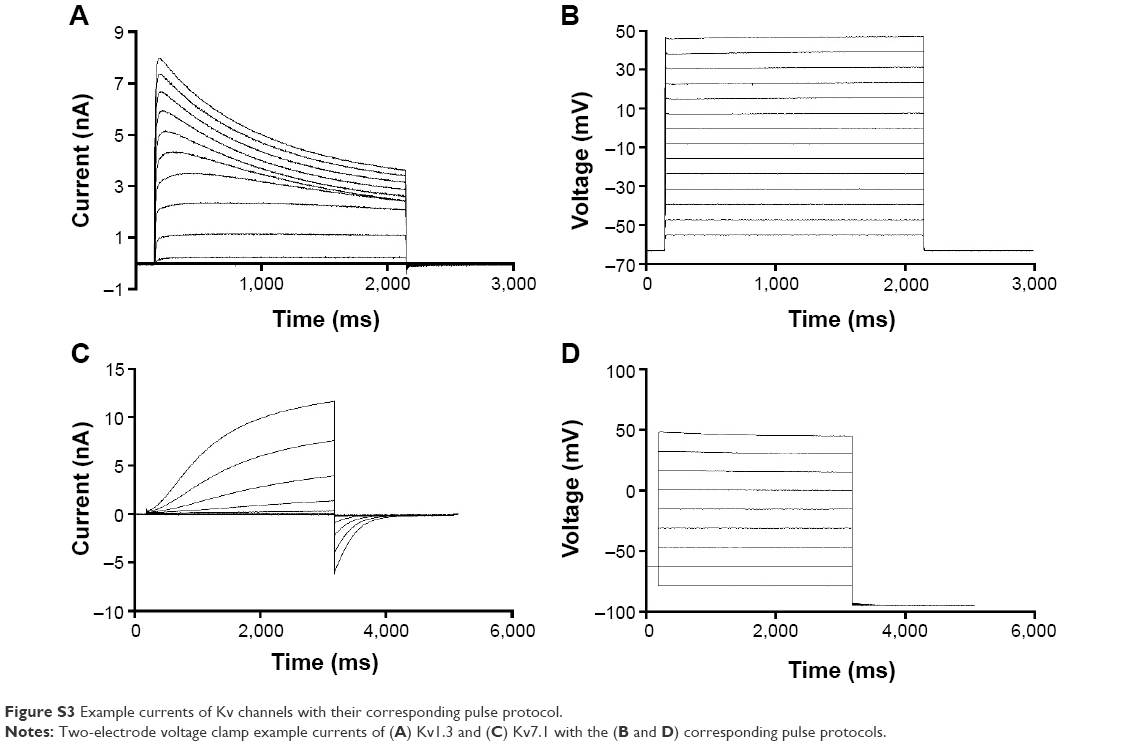 | Figure S3 Example currents of Kv channels with their corresponding pulse protocol. |
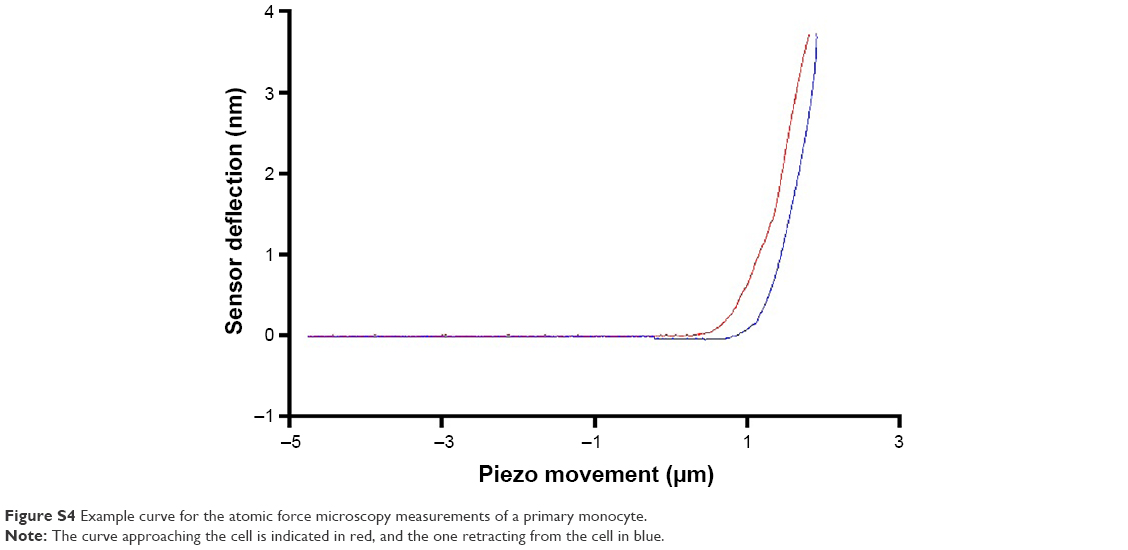 | Figure S4 Example curve for the atomic force microscopy measurements of a primary monocyte. |
 © 2016 The Author(s). This work is published and licensed by Dove Medical Press Limited. The full terms of this license are available at https://www.dovepress.com/terms.php and incorporate the Creative Commons Attribution - Non Commercial (unported, v3.0) License.
By accessing the work you hereby accept the Terms. Non-commercial uses of the work are permitted without any further permission from Dove Medical Press Limited, provided the work is properly attributed. For permission for commercial use of this work, please see paragraphs 4.2 and 5 of our Terms.
© 2016 The Author(s). This work is published and licensed by Dove Medical Press Limited. The full terms of this license are available at https://www.dovepress.com/terms.php and incorporate the Creative Commons Attribution - Non Commercial (unported, v3.0) License.
By accessing the work you hereby accept the Terms. Non-commercial uses of the work are permitted without any further permission from Dove Medical Press Limited, provided the work is properly attributed. For permission for commercial use of this work, please see paragraphs 4.2 and 5 of our Terms.