")
Back to Journals » International Journal of Nanomedicine » Volume 10 » Issue 1
Colorimetric biosensing of targeted gene sequence using dual nanoparticle platforms
Authors Thavanathan J, Huang NM, Thong K
Received 22 September 2014
Accepted for publication 9 November 2014
Published 2 April 2015 Volume 2015:10(1) Pages 2711—2722
DOI https://doi.org/10.2147/IJN.S74753
Checked for plagiarism Yes
Review by Single anonymous peer review
Peer reviewer comments 5
Editor who approved publication: Dr Thomas Webster
Jeevan Thavanathan,1 Nay Ming Huang,1 Kwai Lin Thong2
1Low Dimension Material Research Center, Department of Physics, 2Institute of Biological Sciences, Faculty of Science, University of Malaya, Kuala Lumpur, Malaysia
Abstract: We have developed a colorimetric biosensor using a dual platform of gold nanoparticles and graphene oxide sheets for the detection of Salmonella enterica. The presence of the invA gene in S. enterica causes a change in color of the biosensor from its original pinkish-red to a light purplish solution. This occurs through the aggregation of the primary gold nanoparticles–conjugated DNA probe onto the surface of the secondary graphene oxide–conjugated DNA probe through DNA hybridization with the targeted DNA sequence. Spectrophotometry analysis showed a shift in wavelength from 525 nm to 600 nm with 1 µM of DNA target. Specificity testing revealed that the biosensor was able to detect various serovars of the S. enterica while no color change was observed with the other bacterial species. Sensitivity testing revealed the limit of detection was at 1 nM of DNA target. This proves the effectiveness of the biosensor in the detection of S. enterica through DNA hybridization.
Keywords: biosensor, DNA hybridization, DNA probe, gold nanoparticles, graphene oxide, Salmonella enterica
Introduction
The genus Salmonella belongs to the family Enterobacteriaceae, which is characterized by Gram-negative, rod-shaped, nonspore-forming, motile facultative anaerobes.1 There are only two Salmonella species, Salmonella bongori and Salmonella enterica, of which there are more than 2,400 serovars.2 Salmonella causes four major human diseases, including enteric fever, gastroenteritis, bacteremia, and chronic asymptomatic carriage.3,4 Notably, salmonellosis represents a major global health issue, with 21 million cases of typhoid fever and 1.3 million cases of gastroenteritis estimated per year.5,6 Outbreaks are commonly associated with eggs, raw milk, fruits, vegetables, and poultry (as well as other meats).7,8 Therefore, food contamination by Salmonella spp. has become a worldwide concern. If the source of contamination is not found and treated, this would cause an epidemic in the general population. Thus, the serious implication of S. enterica infection would also be felt in the economy as the workforce efficiency would be drastically reduced.9,10
In view of this matter, the development of detection tools has been a top priority in the last decade for identification of S. enterica for the express purpose of preventing an epidemic.11 Thus, the current method of S. enterica identification consists of traditional method of cell culture counting to the more advanced techniques such as enzyme-linked immunosorbent assay,12 polymerase chain reaction (PCR),13,14 and real-time PCR15,16 with limit of detections at 103–104 CFU/mL (enzyme-linked immunosorbent assay), 1.5–2.0 pg/μL of genomic DNA (PCR), and 40–50 fg/PCR of genomic DNA (real-time PCR). Newer tools and kits using biosensor and electrochemical sensors based on antigen–antibody interaction and DNA hybridization have recently been introduced and marketed as point-of-care devices.17,18 These advancements provide better sensitivity with a faster rate of detection. The use of nanoparticles such as gold has further improved its sensitivity and provides a new means of detection through direct visualization.19 The use of DNA and gold nanoparticles (Au NP) simultaneously have led to the development of a class of colorimetric biosensors in which detection results are readily observed from the test kit rather than to use further equipment for visualization purposes.20,21 This in turn greatly reduces the overall cost for the detection of S. enterica.
Based on our previous work from the study of colorimetric detection of DNA hybridization based on a dual platform of Au NP and graphene oxide (GO),22 which was a prove of concept experimentation on the use of multiple types of nanoparticle in colorimetric detection. We have improved on it to be used in an application phase by developing a rapid endpoint visualization tool to be used in conjunction with PCR rather than the more common agarose gel electrophoresis. The system has been modified for the detection of the invA gene, which is highly conserved in all serovars of the S. enterica23 as compared to the previous study in which DNA hybridization was achieved with both 22-bp DNA sequences of modified probe and conjugated target. Thus, this current biosensor system functions through the detection of a 148-bp gene sequence acquired through PCR amplification. The biosensor functions through DNA hybridization between the targeted invA genes and the dual-probe sequences used when they are complementary to each other. The dual nanoparticle platforms of Au NP and GO function as the color change and binding components. Through its surface plasmon resonance properties of Au NP, the color of the biosensor could be manipulated by controlling the distance between nanoparticles in the event of DNA hybridization.24 GO through its numerous surface modifications and transparent nature provides the ideal platform for the aggregation and binding of the Au NP while allowing future modification to be conducted through molding of its shape and size for the development of lateral flow devices.25 Thus, from a proof of concept from the previous study, we have successfully applied a working model biosensor that is specific to the detection of S. enterica through PCR amplification without the need to run agarose gel electrophoresis. The novelty of this biosensor design is that the unmodified targeted gene sequence acquired from spike food samples acts as a cross-linker between the Au NP and GO probes, which induces an observable color change when both nanoparticles are brought together. In essence, this is one of the first developed endpoint detection system that is specific to DNA sequences using two nanoparticle platforms. Thus, this system could ideally replace the more common agarose gel electrophoresis, which has multiple drawbacks of a much longer detection rate, requiring complex procedures and materials at a higher cost. The biosensor provides a rapid visualization result straight after the PCR amplification at a fraction of the cost and effort. The potential adaptability of the biosensor is limitless as the detection probes could be modified to identify various other desired gene sequences.
Materials and methods
Chemicals and instruments
1-Ethyl-3-(3-dimethylaminopropyl) carbodiimide, N-hydroxy sulfosuccinimide, dithiothreitol, N,N-dimethylformamide, potassium permanganate, sulfuric acid, phosphoric acid (H3PO4), and Luria Bertani agar were purchased from Sigma-Aldrich (USA). Hydrogen tetrachloroaurate, trisodium citrate, and graphite flakes were purchased from Acros Organics (USA). Immobilization and purification of the modified oligonucleotide probes onto the nanoparticle platforms was done using NAP-10 sephadex columns (G-25, GE Healthcare) and with a high-speed centrifuge (MIKRO 220R, HETTICH). Wavelength scan analyses of the biosensor with variable DNA targets were done using a UV–visible spectrophotometer (EVO300-PC, Thermo Scientific), while microscopic imaging was performed using a high-resolution transmission electron microscope (HRTEM, JEM 2100F, JEOL). DNA target amplification was done using a Mastercycler ep gradient S (Eppendorf, USA). The visual observation of the biosensor device through color change was captured through the use of a professional-grade full-frame digital single-lens reflex camera (D4, Nikon).
Oligonucleotide probe and target
The oligonucleotide probes used were designed in-house based on the sequence of the invA gene obtained from S. enterica. The probes consist of two oligonucleotide sequences of 74 bp each with modifications at their respective tail ends. The primary probe was conjugated to the Au NP through modification of its 5′ end with a thiol group. The secondary probe was conjugated to the GO through amide linkages on its 3′ end. Both modified oligonucleotide probes were purchased from Bioneer Corporation (South Korea). The complete sequences of the biosensor probes are as listed:
- Primary probe: 5′HS–ATCCCTTTGC GAATAACATC CTCAACTTCA GCAGATACCA TTACTGCTCG TAATTCGCCG CCATTGGCGA ATTT–3′
- Secondary probe: 5′–ATGACAAATA TAACGCGCCA TTGCTCCACG AATATGCTCC ACAAGGTTAA TGACATCTTT TTCTCTTGGC GCCC–3′H2N
The chosen gene target for the Biosensor was a 148-bp sequence from the invA gene, which was obtained from spiked food samples of S. enterica through PCR amplification. Salmonella strains from nine different serovars of S. enterica were spiked onto food samples, and DNA extraction was done on the food homogenate. PCR was used to amplify the invA genes with internal primers. Two noncomplementary gene sequences were also used in the specificity and sensitivity testing of the biosensors. The cspA gene with a sequence length of 139 bp was extracted from the S. enterica serovar typhimurium, while the myfA gene of 272 bp was extracted from Yersinia enterocolitica.26,27 Non-Salmonella bacteria samples designated as nonspecific targets were also harvested from spiked food samples; these samples then underwent a similar DNA extraction method and PCR amplification with the invA primers.
Synthesis of nanoparticles and probe immobilization
The dual platform of Au NP and GO, which are the core components of the biosensor, were synthesized and immobilized with their respective DNA probes separately. Production of the approximately 20-nm Au NP was done using the standard protocol of citrate reduction.28 The synthesis of GO was done through the improved phosphoric acid method to produce high-yield particles rich in oxidative functional groups.29 Characterizations of the synthesized nanoparticles were done through spectrophotometry and electron microscopy. The oligonucleotide probe immobilizations onto its respective platform were also done separately due to the different chemical bonds required. The primary probe was conjugated to the Au NP through thiol linkages.30 This was achieved through its surface modification of thiol group at the 5′ end of the probe. The addition of dithiothreitol was done to activate the modified oligonucleotide when mixed with 1 mL of Au NP. The primary DNA probe-conjugated Au NP (Au NP-DNA) was later washed with phosphate buffer to remove impurities and stored at room temperature. Conjugation of the amine-modified secondary probe was done through amide linkages with the carboxylic functional group littered on the surface of the GO sheets.31 1-Ethyl-3-(3-dimethylaminopropyl) carbodiimide and N-hydroxy sulfosuccinimide were used in tandem as activation agents to facilitate the conjugation process. The secondary DNA probe-conjugated GO (GO-DNA) was finally dissolved in a mixture of deionized nanopure H2O and N,N-dimethylformamide at a ratio of 2:1 in volume to prevent precipitation between the GO-DNA probes. Characterizations of both conjugated probes were done through spectrophotometry analysis and visual observation in the color difference from the unconjugated nanoparticles. Both Au NP-DNA and GO-DNA probes were subsequently mixed to form the biosensor solution and stored in room temperature for later use.
Specificity and sensitivity analysis
Two different criteria were focused in the testing of the biosensor, which are specificity and sensitivity. Under specificity testing, 10 μL of 1 μM DNA target was added into 40 μL of biosensor solution for every test performed. The first criterion of the biosensor was to examine its specificity only to the invA gene. For this, the biosensor was tested with a variety of other genes of almost similar length. The noncomplementary targets used were the cspA and myfA genes. The second criterion was to determine the ability of the biosensor to detect the presence of multiple serovars of S. enterica. Thus, nine serovars of S. enterica were chosen to be tested with the biosensor. The ability to distinguish between the targeted bacteria and the other bacterial species was the final criterion under specificity to be tested. Nine different bacterial species were chosen and tested with the biosensor. Serial dilution method was used in the sensitivity detection phase of the biosensor. The target DNA samples were diluted sequentially from a stock concentration of 1 μM into 11 samples. The target DNA concentrations were set at 0.5 μM, 0.25 μM, 0.125 μM, 62.5 nM, 31.25 nM, 15.62 nM, 7.81 nM, 3.91 nM, 1.96 nM, 0.98 nM, and 0.49 nM. Ten microliters of the gene target of differing concentration was added separately into a 40-μL biosensor solution for testing. Characterization of both specificity and sensitivity testing was done through agarose gel electrophoresis, spectrophotometry analysis, and visual observation of the biosensor solution. HRTEM imaging was also employed to observe the shape and interaction of the biosensor with the addition of the DNA target. The experiments were repeated four times to ensure reproducibility.
Results and discussion
Analysis of biosensor functionalization
The principle and inner workings of the biosensor are illustrated in detail in Figure 1A–G. The fabrication of the biosensor was done first through the production of its dual detection platform. Approximately, 20 nm of Au NP primary platform was synthesized through the conventional Turkevich method through the use of trisodium citrate as an oxidizing and dispersion agent.28 The Au NP was later conjugated with the primary probe through the use of dithiothreitol, thus forming the color-changing platform of the biosensor.30 The secondary platform, which consists of GO sheets, was synthesized by using the improved phosphoric acid method producing highly oxidative nanoparticles.29 The secondary probe was conjugated onto the surface of the GO sheets through amide bonds with the assistance of 1-ethyl-3-(3-dimethylaminopropyl) carbodiimide and N-hydroxy sulfosuccinimide.31 Thus, this GO-DNA would represent the aggregation platform of the biosensor. The mechanism of the biosensor, as illustrated in Figure 1A–G, functions through the detection of a specific gene target. In this experiment, the chosen DNA strand was a sequence of the invA gene found in the S. enterica sp. The invA gene plays a prominent role in the type III secretion system,32 where it encodes the formation of syringe-like structures for the transfer of bacterial protein into the host intestinal mucosal cells. The gene target is detected through hybridization that occurs between the dual oligonucleotide probes of the biosensor. The invA gene acts as a cross-linker between the free-floating dual platforms within the biosensor solution. If the DNA target is complementary to the detection probes, this would result in the hybridization between the probe and target. This in turn would cause both free-floating nanoparticle platforms to be brought together. The Au NP-DNA would be aggregated closely onto the surface of the GO-DNA through hybridization between the cross-linker DNA targets in detection. With the distance between individual Au NP drastically reduced on the surface of the GO sheet, this changes the surface plasmon resonance of the Au NP.33 Through visual observation this would appear as a prominent color change from pinkish-red to a light purplish solution. If a noncomplementary DNA sequence was introduced into the biosensor system, hybridization between the probes and target would not occur due to the nature of complementariness between oligonucleotides. The resulting electrostatic charge between the platforms and the target would cause the individual particles distancing between each other due to the increase in the same charge particles (single-stranded DNAs are highly negative charged) causing the van der Waals force of repulsion to increase.33 In terms of visual observation, no change in the color of the biosensor would be detected.
 | Figure 1 Graphical representation of the biosensor in the detection of Salmonella enterica. |
Quantitative measurement and characterization of the biosensor was done through the use of spectrophotometry analysis. This method was used as it showed the shift in wavelength peak as the color of the biosensor changes with the detection of the target gene. In the analysis, the biosensor was tested with the addition of complementary and noncomplementary gene targets obtained through PCR amplification (Figure 2). The complementary target used was based on the sequence of the invA gene. Two noncomplementary sequences were chosen with the first being the cspA gene, which is 139 bp in length. The gene functions through the production of certain proteins to ensure normal cellular metabolism in the event of a sudden temperature drop.34 This gene is commonly found in all S. enterica spp., and it is almost similar in length to the invA gene. This makes an ideal experimental comparison to test the effectiveness of the biosensor in distinguishing its intended gene target from a similar bacterial source. The second noncomplementary target used was the 272-bp myfA gene, which is part of the virulence genes found in the Yersinia genus.35 As seen in Figure 2A, with the addition of the invA gene target, a shift in wavelength peak was detected from an initial at 525 nm to 602 nm, whereas with the addition of the noncomplementary cspA and myfA genes, there was no shift in the wavelength peak. This in essence showcases the highly selective nature of the biosensor toward a specific gene target only. A series of four repetitive wavelength analyses yielded a relative standard deviation of 8%.
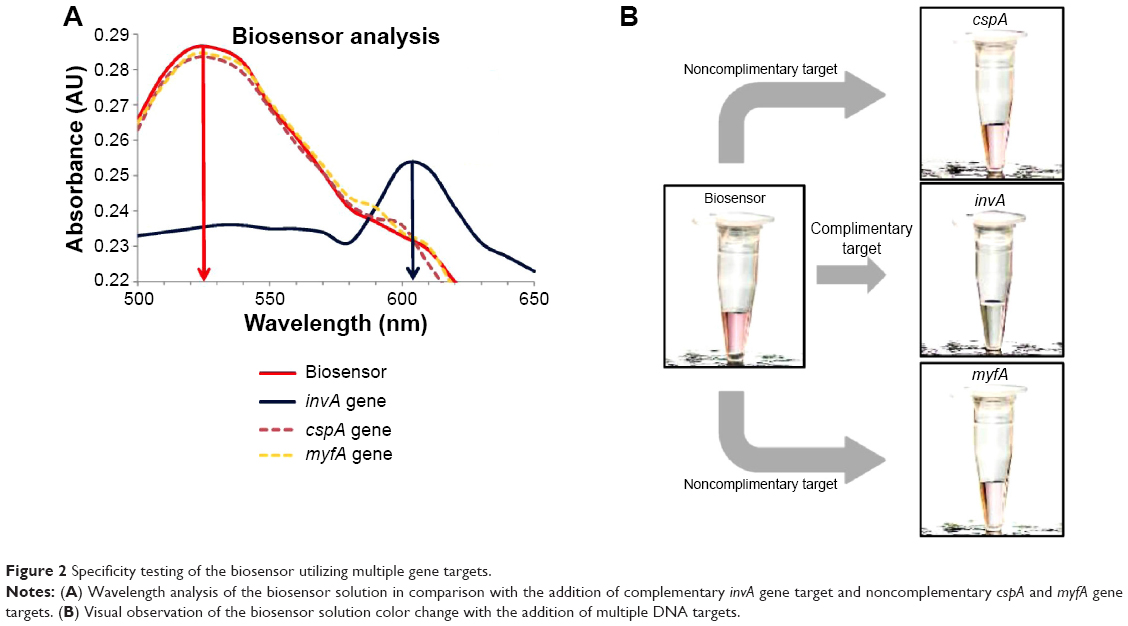 | Figure 2 Specificity testing of the biosensor utilizing multiple gene targets. |
The qualitative characterization of the biosensor is the primary method by which the detection of S. enterica was done, which is through simple visual observation in the change of color of the biosensor solution. In the case of a positive detection, the color of the biosensor would change, while no color change would be detected if a non-Salmonella bacterial spp. was used. Figure 2B clearly indicates with the addition of the complementary invA gene target, the biosensor solution changes color from pinkish-red to light purplish. It was also proven that with the addition of the two noncomplementary cspA and myfA gene targets, the biosensor solution remained pinkish-red without any observable change (Figure 2B). The use of HRTEM imaging gave us a closer perspective on the function of the complementary gene target as a cross-linker between both the detection platforms of Au NP and GO. As seen, the images show the hybridization between the DNA probes and their respective gene target causes the close proximity aggregation of the Au NP-DNA onto the surface of the GO-DNA sheet (Figure 3). This in accordance to the surface plasmon resonance concept and causes a shift in wavelength, visualized through a color change from pinkish-red to light purplish.36
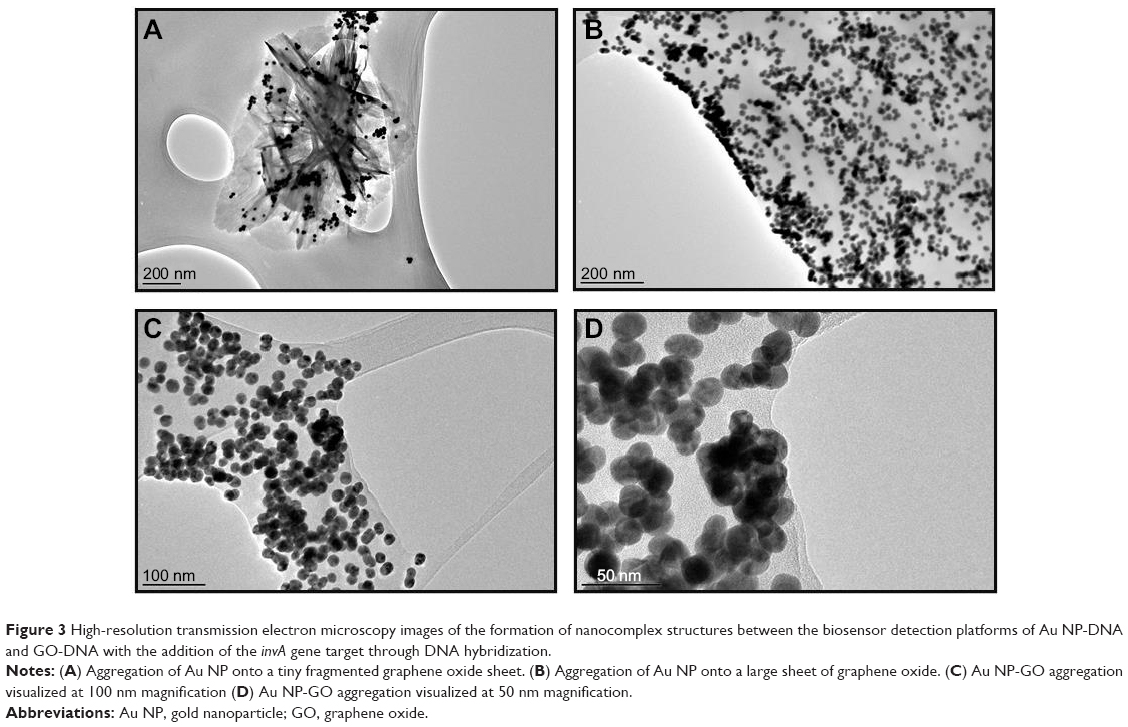 | Figure 3 High-resolution transmission electron microscopy images of the formation of nanocomplex structures between the biosensor detection platforms of Au NP-DNA and GO-DNA with the addition of the invA gene target through DNA hybridization. |
Specificity analysis
The specificity of the biosensor was measured and characterized in two parts. Seeing that the S. enterica spp. consist of 2,400 serovars, the biosensor was tested with the nine most common serovars to be found in contaminated food. The invA gene targets from S. typhi, S. typhimurium, S. enteritis, S. paratyphi A, S. covallis, S. heidelberg, S. stanley, S. weltevreden, and S. choleraesuis were obtained through PCR amplification. Approximately, 10 μL of 0.5 μM of the DNA target was separately added into the biosensor solution and heated at 95°C for 30 seconds. All the biosensor solutions tested with the nine serovars of S. enterica showed a visible color change from pinkish-red to light purplish solution (Figure 4A, I–X). Spectrophotometry analysis of all nine biosensor samples showed a wavelength shift from an initial 525 nm to approximately 600 nm, which indicated the aggregation of the Au NP due to hybridization between the biosensor DNA probes and the target DNA (Figure 4C). Serovars S. typhi and S. typhimurium showed a primary wavelength peak at 600 nm followed by a secondary peak at 570 nm (Figure 4C), whereas S. heidelberg, S. stanley, and S. weltevreden observed a wavelength peak at 623 nm with a secondary peak at 600 nm (Figure 4C). Almost all the S. enterica serovars showed a minor wavelength peak at 570 nm (Figure 4C). These appearances of multiple wavelength peaks could be attributed to the varying sizes of the GO-DNA sheets present within the biosensor solution. This causes the diversity in aggregation of the Au NP-DNA, which is spread throughout the entire biosensor solution and not localized onto a single point, thus giving out multiple wavelength peaks rather than a single peak with the spectrophotometry analysis. The success in detection of the invA gene with all nine S. enterica serovars using the biosensors was further collaborated with a conventional experimentation with agarose gel electrophoresis (Figure 4B). All the tested samples were positively identified with the invA gene, thus confirming the ability of the biosensor to detect various pathogenic serovars of S. enterica.
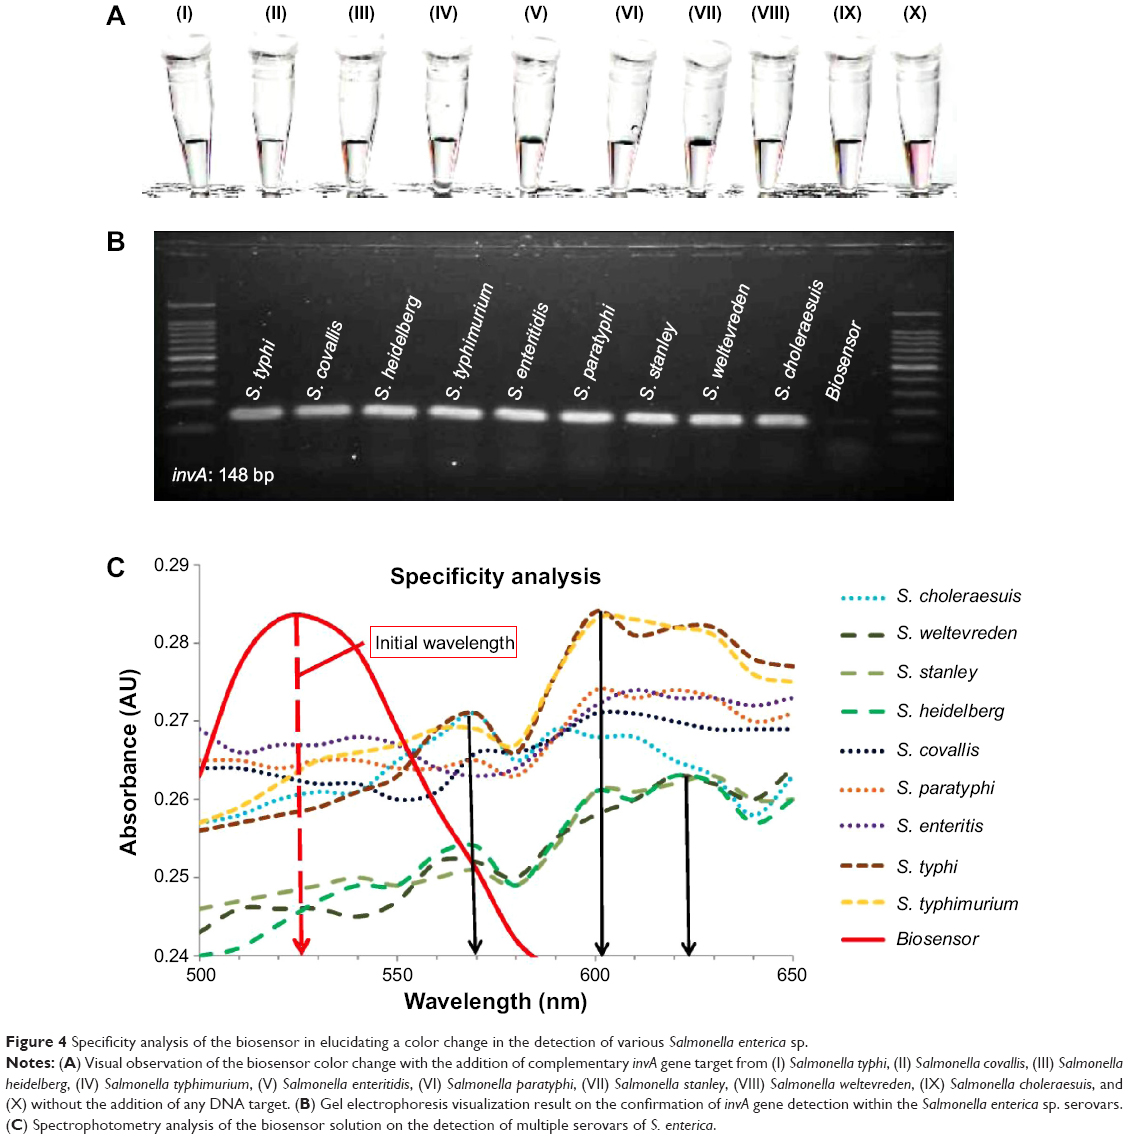 | Figure 4 Specificity analysis of the biosensor in elucidating a color change in the detection of various Salmonella enterica sp. |
The second specificity experimentation involved the use of eight non-Salmonella bacterial samples to analyze the effectiveness of the biosensor in distinguishing its target from other samples. The bacterial species used were Pseudomonas aeruginosa, Vibrio cholera, Vibrio parahaemolyticus, Vibrio proteolyticus, Staphylococcus aureus, Escherichia coli, Klebsiella pneumoniae, and Streptococcus pneumoniae, while S. typhi was the chosen positive target to be used in comparison. The same PCR process as that followed for the S. enterica serovars was employed on the cultured bacterial samples in the amplification of the invA gene. Approximately, 10 μL of 0.5 μM of the DNA target from the non-Salmonella bacterial samples was added separately into each biosensor solution and heated at 95°C for 30 seconds. Visual inspection of the biosensor samples revealed that there were no observable color changes when compared to the original solution of the biosensor, thus remaining pinkish-red (Figure 5A, II–X). The biosensor solution containing the gene target from S. enterica showed a color change to light purplish, thus indicating the presence of the invA gene (Figure 5A, I). Spectrophotometry analysis supported the visual observation with the final wavelength peak at 525 nm for all the eight bacterial samples in accordance to the biosensor solution without the addition of any complementary gene target (Figure 5C). The addition of the S. typhi gene target into the biosensor solution gave an immediate change in wavelength peak from 525 nm to 605 nm, thus indicating the detection of the invA gene. Using conventional detection methods of agarose gel electrophoresis, the results showed that the presence of the invA gene was not detected in the eight bacterial DNA samples, while it was only present in the S. typhi DNA sample (Figure 5B). In conclusion, the biosensor was proven able to distinguish and detect S. enterica from other bacterial species through simple visual observation. The wavelength analyses on both specificity experimentation with individual serovars of S. enterica and other bacterial species yielded a relative standard deviation of 8.2% from a series of four repetitive experimentations.
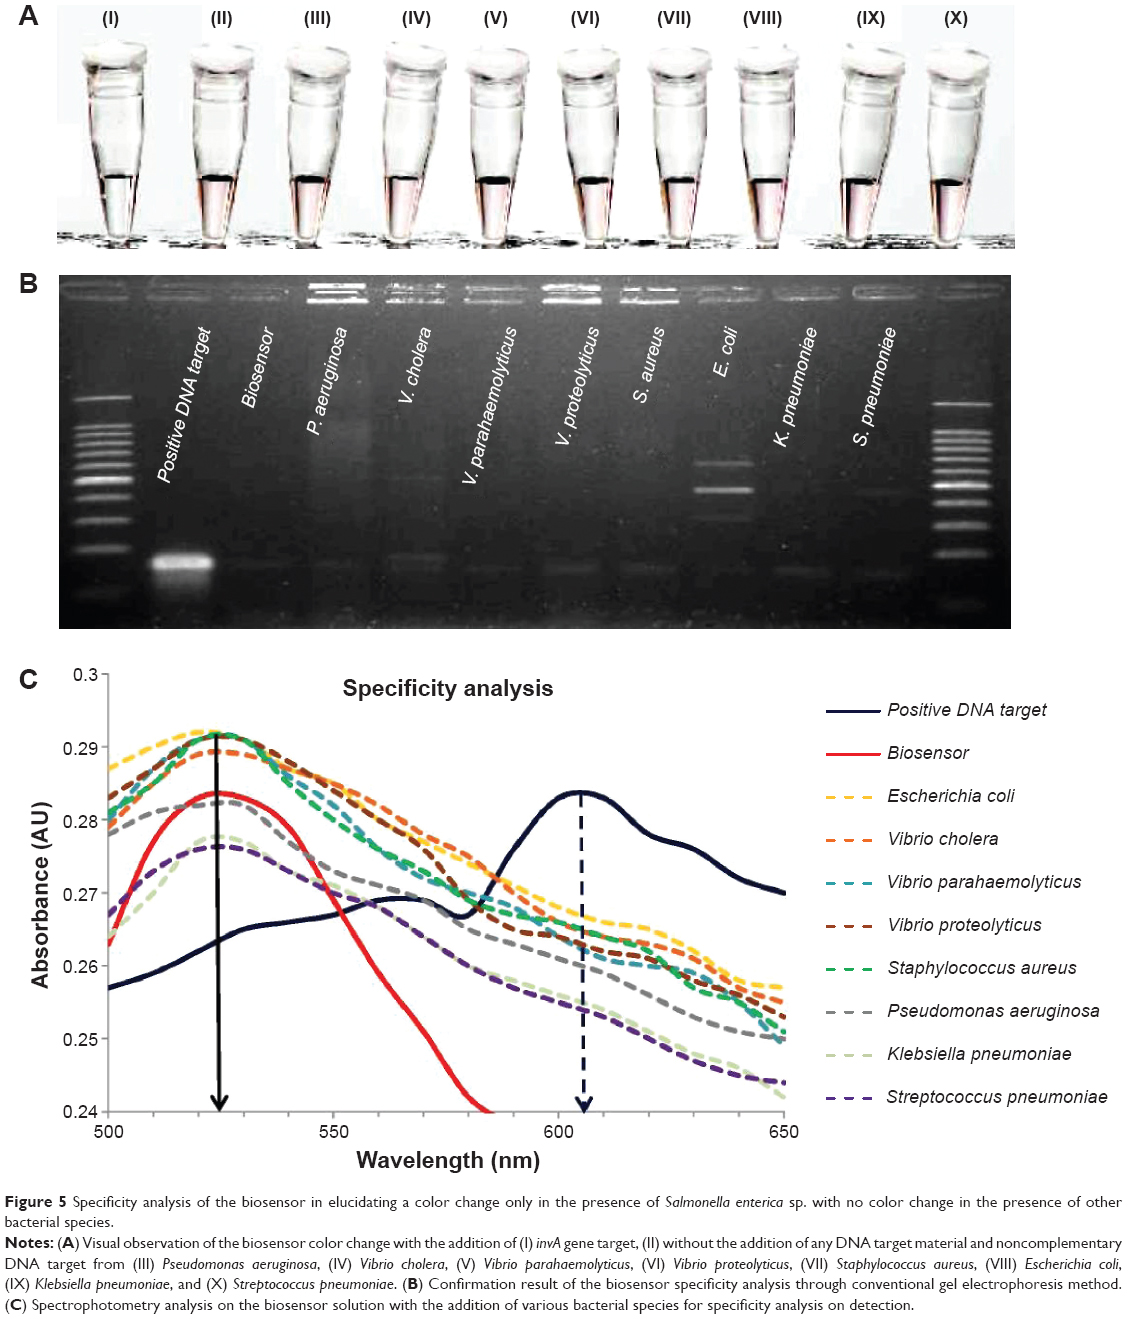 | Figure 5 Specificity analysis of the biosensor in elucidating a color change only in the presence of Salmonella enterica sp. with no color change in the presence of other bacterial species. |
Sensitivity analysis
The limit of detection for the biosensor is an important factor in determining the range of effectiveness. In this experimentation, the limit of detection for the biosensor was determined through the use of multiple concentrations of complementary gene target. Analysis was done through a dual confirmation process, which involved a shift in wavelength peak in spectrophotometry analysis and observable color change of the biosensor solution from pinkish-red to light purplish. The limit of detection for the biosensor through its final color change was found to be at 0.98 nM of DNA target (Figure 6A, X), while with the addition of 0.49 nM of the gene target, the biosensor solution remained pinkish-red without any change (Figure 6A, XI). The rest of the solution with the addition of the gene target concentration ranging from 0.5 μM to 1.96 nM showed an observable change from pinkish-red to a purplish solution (Figure 6A, I–X). Spectrophotometry analysis also supports the visual observation of the biosensor color change. The final shift in wavelength was detected with the addition of 0.98 nM of gene target (Figure 6B). All concentrations from 0.5 μM to 0.98 nM of the gene target showed a primary wavelength peak at 602 nm, a shift from an initial wavelength peak of 525 nm. While with the addition of 0.49 nM of gene target into the biosensor solution, a slight shift from 525 nm to 530 nm was detected but a slightly smaller secondary peak at 602 nm was also observed (Figure 6B). The appearance of the secondary peak at 602 nm confirms that the miniscule amount of gene target introduced into the biosensor solution managed to hybridize with both detection platforms, thus causing the aggregation of Au NP-DNA onto the surface of the GO-DNA sheet. But with the majority amount of Au NP-DNA still being free floating, the larger peak at 530 nm indicates that the Au NP-DNA is still in its dispersed form; in a visually observed perspective, the solution appears to be pinkish-red even though hybridization between the DNA target and detection platforms occurred. As seen in Figure 6B, the DNA target concentrations of 31.25 nM and 7.81 nM indicate the presence of secondary wavelength peaks at 630 nm and 640 nm. The appearances of these secondary peaks could be explained due to the uneven sheet size of the GO particle during production. The presence of larger GO-DNA sheets causes the majority of the Au NP-DNA to aggregate onto a single sheet when compared to the aggregation on to numerous smaller GO-DNA sheets for the same effect. The aggregation of Au NP-DNA onto smaller GO-DNA sheets produces numerous complex formations of these biosensor nanoparticles, which are negatively charged; thus, this increases the van der Waals force of repulsion between individual complexes, giving a wavelength peak at 600 nm. The aggregation of Au NP-DNA onto larger GO-DNA sheets effectively reduces the repulsive force between each other due to the lesser amount of negatively charged particles present, thus the appearance of much higher wavelength peaks at 630 nm and 640 nm. In summary, the lowest detection limit for the biosensor in the detection of S. enterica was at 0.98 nM of DNA target with visual observation of the color change together with confirmation from spectrophotometry analysis. A series of four repetitive spectrophotometry analyses on the sensitivity experimentation yielded a relative standard deviation of 8.5%.
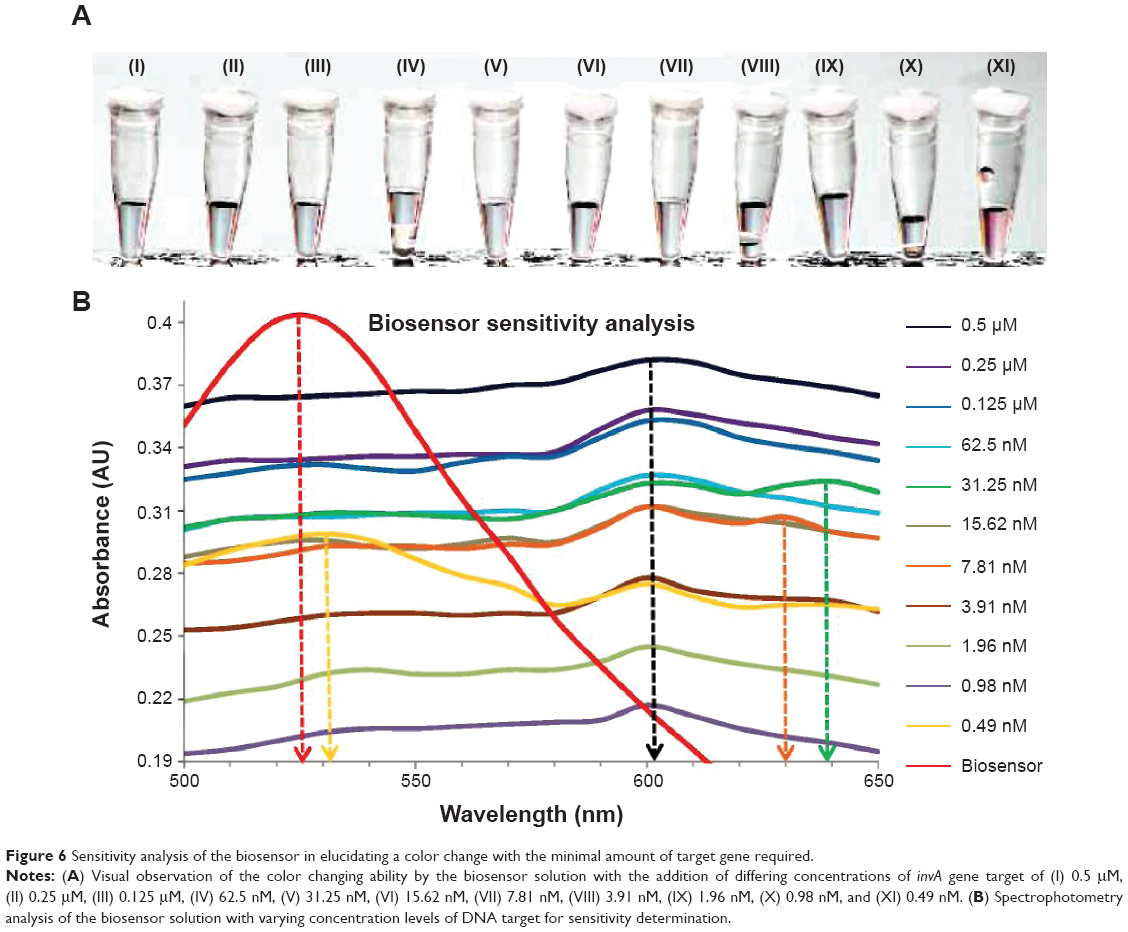 | Figure 6 Sensitivity analysis of the biosensor in elucidating a color change with the minimal amount of target gene required. |
Overview of biosensor efficiency and limitation
The novelty in the design of this biosensor is based on the complex nanostructure formed. The introduction of complementary gene target into the biosensor solution forms a cross-linking mechanism through DNA hybridization between the Au NP-DNA and GO-DNA platforms, thus forming a complex nanostructure as illustrated in Figure 2 and observed through HRTEM (Figure 4). The efficiency in its design is based on the observable and clear color change of the biosensor from a pinkish-red solution to light purplish in the event of positive detection of S. enterica, while other colorimetric-based sensors are focusing on the microarray dots in detection.18 The use of DNA as a probe and detection target rather than the common method of antibody-conjugated Au NP11,37 provides a much more specific and sensitive result, thus lowering the detection limit drastically. The use of GO nanoparticles within the biosensor system also reduces the amount of Au NP required by half when compared to other systems present due to the ability of the GO to function as an effective aggregation platform rather than the more conventional Au to Au NP aggregation mechanism.38 The two-dimensional nature of GO also provides an ideal wide surface area for the attachment of longer DNA sequences without entanglement, as required in the detection of specific gene targets. This also improves the color change quality from pinkish-red to light purplish due to the symmetrical attachment of the Au NP probe onto the edges of the GO sheets. This provides the ample space required for DNA hybridization to occur rather than the current Au to Au NP system, which creates a densely packed attachment of the detection probe on the surface, thus preventing DNA hybridization between all available probes to its DNA target. The major achievement of the biosensor system in the detection of S. enterica is by eliminating the need to run agarose gel electrophoresis in conventional methods as detection is seen through visual observation in 30 seconds rather than in an hour.39 In this paper the biosensor was paired with the conventional PCR method for the extraction of invA genes with an overall process length under an hour, but the biosensor solution could be used in tandem with other gene extraction or amplification techniques such as loop-mediated AMPlification,40 thus further strengthening the use of this biosensor system as an endpoint visual detection tool. With a detection limit of approximately 1 nM (approximately 105 CFU/mL) of targeted invA gene, the biosensor might not be on par with other complex methods such as electrochemical41 at 143 cells/mL, quartz crystal microbalance42 at 10–20 CFU/mL, and immunoassays43 at 7–10 CFU/mL, but its detection rate makes it an ideal rapid visualization tool in conjunction with PCR to be deployed in field laboratories lacking advance diagnostic devices. The true limitation to the device is its specificity to detecting S. enterica but not being able to differentiate between its serovars. In essence, the biosensor is being developed as an affordable disposable system in which each sample requires a single unit, with an estimated cost of 0.25 USD per unit.
Conclusion
In summary, the colorimetric-based biosensor performed successfully in the detection of S. enterica through specific invA gene detection, which was visually observed through a simple color change, thus proving that the application of the dual nanoparticles platform is an effective endpoint visualization device capable of replacing the conventional agarose gel electrophoresis. Further studies are currently been carried out to further refine the detection limit of the entire system.
Acknowledgments
We thank the University of Malaya for the facilities and funding provided for this particular research project through the Postgraduate Research Grant (PV039-2011A), University of Malaya Research Grant (UMRG) program (RP007C/13AFR), and the Molecular Diagnostics of Bacteria grant (GA0103-2013). We also thank the Ministry of Higher Education of Malaysia for its financial support through the High Impact Research Grant (UM.C/1/625/HIR/MOHE/05).
Disclosure
The authors report no conflicts of interest in this work.
References
Sheng X, Zhang H, Xia Q, Xu S, Xu H, Huang X. Mig-14 plays an important role in influencing gene expression of Salmonella enterica serovar typhi, which contributes to cell invasion under hyperosmotic conditions. Res Microbiol. 2013;164(9):903–912. | ||
Toboldt A, Tietze E, Helmuth R, Junker E, Fruth A, Malorny B. Molecular epidemiology of Salmonella enterica serovar Kottbus isolated in Germany from humans, food and animals. Vet Microbiol. 2014;170(1–2):97–108. | ||
Lee C-J, Su L-H, Huang Y-C, Chiu C-H. First isolation of ciprofloxacin-resistant Salmonella enterica serovar typhi in Taiwan. J Microbiol Immunol Infect. 2013;46(6):469–473. | ||
Lee SJ, Gebru Awji E, Kim MH, Park SC. BaeR protein from Salmonella enterica serovar paratyphi A induces inflammatory response in murine and human cell lines. Microbes Infect. 2013;15(13):951–957. | ||
Crump JA, Mintz ED. Global trends in typhoid and paratyphoid fever. Clin Infect Dis. 2010;50(2):241–246. | ||
Toobak H, Rasooli I, Talei D, Jahangiri A, Owlia P, Darvish Alipour Astaneh S. Immune response variations to Salmonella enterica serovar typhi recombinant porin proteins in mice. Biologicals. 2013;41(4):224–230. | ||
Clemente L, Correia I, Themudo P, Neto I, Caniça M, Bernardo F. Antimicrobial susceptibility of Salmonella enterica isolates from healthy breeder and broiler flocks in Portugal. Vet J. 2014;200(2):276–281. | ||
Clemente L, Manageiro V, Ferreira E, et al. Occurrence of extended-spectrum β-lactamases among isolates of Salmonella enterica subsp. enterica from food-producing animals and food products, in Portugal. Int J Food Microbiol. 2013;167(2):221–228. | ||
Arce C, Lucena C, Moreno A, Garrido JJ. Proteomic analysis of intestinal mucosa responses to Salmonella enterica serovar typhimurium in naturally infected pig. Comp Immunol Microbiol Infect Dis. 2014;37(1):59–67. | ||
Wang H-H, Ye K-P, Zhang Q-Q, Dong Y, Xu X-L, Zhou G-H. Biofilm formation of meat-borne Salmonella enterica and inhibition by the cell-free supernatant from Pseudomonas aeruginosa. Food Control. 2013;32(2):650–658. | ||
Leon-Velarde CG, Zosherafatein L, Odumeru JA. Application of an automated immunomagnetic separation – enzyme immunoassay for the detection of Salmonella enterica subspecies enterica from poultry environmental swabs. J Microbiol Methods. 2009;79(1):13–17. | ||
Chunglok W, Wuragil DK, Oaew S, Somasundrum M, Surareungchai W. Immunoassay based on carbon nanotubes-enhanced ELISA for Salmonella enterica serovar typhimurium. Biosens Bioelectron. 2011;26(8):3584–3589. | ||
Yin Ngan GJ, Ng LM, Lin RTP, Teo JWP. Development of a novel multiplex PCR for the detection and differentiation of Salmonella enterica serovars typhi and paratyphi A. Res Microbiol. 2010;161(4):243–248. | ||
Zhai L, Kong X, Lu Z, Lv F, Zhang C, Bie X. Detection of Salmonella enterica serovar Dublin by polymerase chain reaction in multiplex format. J Microbiol Methods. 2014;100(0):52–57. | ||
Chen J, Zhang L, Paoli GC, Shi C, Tu S-I, Shi X. A real-time PCR method for the detection of Salmonella enterica from food using a target sequence identified by comparative genomic analysis. Int J Food Microbiol. 2010;137(2–3):168–174. | ||
McCabe EM, Burgess CM, O’Regan E, et al. Development and evaluation of DNA and RNA real-time assays for food analysis using the hilA gene of Salmonella enterica subspecies enterica. Food Microbiol. 2011;28(3):447–456. | ||
Salam F, Tothill IE. Detection of Salmonella typhimurium using an electrochemical immunosensor. Biosens Bioelectron. 2009;24(8):2630–2636. | ||
Wattiau P, Weijers T, Andreoli P, et al. Evaluation of the Premi®Test Salmonella, a commercial low-density DNA microarray system intended for routine identification and typing of Salmonella enterica. Int J Food Microbiol. 2008;123(3):293–298. | ||
Luo R, Li Y, Lin X, et al. A colorimetric assay method for invA gene of Salmonella using DNAzyme probe self-assembled gold nanoparticles as single tag. Sens Actuators B Chem. 2014;198(0):87–93. | ||
Dungchai W, Siangproh W, Chaicumpa W, Tongtawe P, Chailapakul O. Salmonella typhi determination using voltammetric amplification of nanoparticles: a highly sensitive strategy for metalloimmunoassay based on a copper-enhanced gold label. Talanta. 2008;77(2):727–732. | ||
Yuan J, Tao Z, Yu Y, et al. A visual detection method for Salmonella typhimurium based on aptamer recognition and nanogold labeling. Food Control. 2014;37(0):188–192. | ||
Thavanathan J, Huang NM, Thong KL. Colorimetric detection of DNA hybridization based on a dual platform of gold nanoparticles and graphene oxide. Biosens Bioelectron. 2014;55(0):91–98. | ||
Wang Y-P, Li L, Shen J-Z, Yang F-J, Wu Y-N. Quinolone-resistance in Salmonella is associated with decreased mRNA expression of virulence genes invA and avrA, growth and intracellular invasion and survival. Vet Microbiol. 2009;133(4):328–334. | ||
Ding N, Zhao H, Peng W, et al. A simple colorimetric sensor based on anti-aggregation of gold nanoparticles for Hg2+ detection. Colloids Surf A Physicochem Eng Asp. 2012;395(0):161–167. | ||
Gogotsi Y. Controlling graphene properties through chemistry. J Phys Chem Lett. 2011;2(19):2509–2510. | ||
Bhagat N, Virdi JS. Distribution of virulence-associated genes in Yersinia enterocolitica biovar 1A correlates with clonal groups and not the source of isolation. FEMS Microbiol Lett. 2007;266(2):177–183. | ||
Francis KP, Stewart GS. Detection and speciation of bacteria through PCR using universal major cold-shock protein primer oligomers. J Ind Microbiol Biotechnol. 1997;19(4):286–293. | ||
Nguyen DT, Kim D-J, Kim K-S. Controlled synthesis and biomolecular probe application of gold nanoparticles. Micron. 2011;42(3):207–227. | ||
Marcano DC, Kosynkin DV, Berlin JM, et al. Improved synthesis of graphene oxide. ACS Nano. 2010;4(8):4806–4814. | ||
Hurst SJ, Hill HD, Mirkin CA. “Three-dimensional hybridization” with polyvalent DNA - gold nanoparticle conjugates. J Am Chem Soc. 2008;130(36):12192–12200. | ||
Liu F, Choi JY, Seo TS. Graphene oxide arrays for detecting specific DNA hybridization by fluorescence resonance energy transfer. Biosens Bioelectron. 2010;25(10):2361–2365. | ||
Galan JE, Ginocchio C, Costeas P. Molecular and functional characterization of the Salmonella invasion gene invA: homology of InvA to members of a new protein family. J Bacteriol. 1992;174(13):4338–4349. | ||
Zhao W, Brook MA, Li Y. Design of gold nanoparticle-based colorimetric biosensing assays. Chembiochem. 2008;9(15):2363–2371. | ||
Jeffreys AG, Hak KM, Steffan RJ, Foster JW, Bej AK. Growth, survival and characterization of cspA in Salmonella enteritidis following cold shock. Curr Microbiol. 1998;36(1):29–35. | ||
Zacharczuk K, Gierczynski R. Konserwatywna struktura C-koncowego fragmentu bialka MyfA stanowiacego strukturalny element fimbrii Myf u chorobotworczych paleczek Yersinia enterocolitica [C-terminal region of MyfA, the major subunit of Yersinia enterocolitica Myf fimbriae, is conserved among pathogenic strains]. Med Dosw Mikrobiol. 2010;62(4):331–336. | ||
Thaxton CS, Georganopoulou DG, Mirkin CA. Gold nanoparticle probes for the detection of nucleic acid targets. Clin Chim Acta. 2006;363(1–2):120–126. | ||
Cho I-H, Irudayaraj J. In-situ immuno-gold nanoparticle network ELISA biosensors for pathogen detection. Int J Food Microbiol. 2013;164(1):70–75. | ||
Fu Z, Zhou X, Xing D. Rapid colorimetric gene-sensing of food pathogenic bacteria using biomodification-free gold nanoparticle. Sens Actuators B Chem. 2013;182(0):633–641. | ||
Akiba M, Kusumoto M, Iwata T. Rapid identification of Salmonella enterica serovars, typhimurium, choleraesuis, infantis, Hadar, enteritidis, Dublin and gallinarum, by multiplex PCR. J Microbiol Methods. 2011;85(1):9–15. | ||
Hara-Kudo Y, Yoshino M, Kojima T, Ikedo M. Loop-mediated isothermal amplification for the rapid detection of Salmonella. FEMS Microbiol Lett. 2005;253(1):155–161. | ||
Afonso AS, Pérez-López B, Faria RC, et al. Electrochemical detection of Salmonella using gold nanoparticles. Biosens Bioelectron. 2013;40(1):121–126. | ||
Salam F, Uludag Y, Tothill IE. Real-time and sensitive detection of Salmonella typhimurium using an automated quartz crystal microbalance (QCM) instrument with nanoparticles amplification. Talanta. 2013;115(0):761–767. | ||
Fang S-B, Tseng WY, Lee H-C, Tsai C-K, Huang J-T, Hou S-Y. Identification of Salmonella using colony-print and detection with antibody-coated gold nanoparticles. J Microbiol Methods. 2009;77(2):225–228. |
 © 2015 The Author(s). This work is published and licensed by Dove Medical Press Limited. The full terms of this license are available at https://www.dovepress.com/terms.php and incorporate the Creative Commons Attribution - Non Commercial (unported, v3.0) License.
By accessing the work you hereby accept the Terms. Non-commercial uses of the work are permitted without any further permission from Dove Medical Press Limited, provided the work is properly attributed. For permission for commercial use of this work, please see paragraphs 4.2 and 5 of our Terms.
© 2015 The Author(s). This work is published and licensed by Dove Medical Press Limited. The full terms of this license are available at https://www.dovepress.com/terms.php and incorporate the Creative Commons Attribution - Non Commercial (unported, v3.0) License.
By accessing the work you hereby accept the Terms. Non-commercial uses of the work are permitted without any further permission from Dove Medical Press Limited, provided the work is properly attributed. For permission for commercial use of this work, please see paragraphs 4.2 and 5 of our Terms.