")
Back to Archived Journals » Journal of Neurorestoratology » Volume 2
Cerebrolysin protects against rotenone-induced oxidative stress and neurodegeneration
Authors Abdel-Salam O , Mohammed N, Youness E, Khadrawy Y, Omara E, Sleem A
Received 3 December 2013
Accepted for publication 7 February 2014
Published 5 May 2014 Volume 2014:2 Pages 47—63
DOI https://doi.org/10.2147/JN.S50114
Checked for plagiarism Yes
Review by Single anonymous peer review
Peer reviewer comments 2
Omar ME Abdel-Salam,1 Nadia A Mohammed,2 Eman R Youness,2 Yasser A Khadrawy,3 Enayat A Omara,4 Amany A Sleem5
1Department of Toxicology and Narcotics, 2Department of Medical Biochemistry, 3Department of Physiology, 4Department of Pathology, 5Department of Pharmacology, National Research Centre, Dokki, Cairo, Egypt
Abstract: We investigated the effect of cerebrolysin, a peptide mixture used for promoting memory and recovery from cerebral stroke, on the development of oxidative stress and nigrostriatal cell injury induced by rotenone administration in rats. Rotenone 1.5 mg/kg was given subcutaneously three times weekly either alone or in combination with cerebrolysin at 21.5, 43, or 86 mg/kg. Rats were euthanized 14 days after starting the rotenone injection. Lipid peroxidation (malondialdehyde), reduced glutathione (GSH), nitric oxide (nitrite) concentrations, paraoxonase 1 (PON1), and acetylcholinesterase (AChE) activities – as well as the monocyte chemoattractant protein-1 (MCP-1) and the antiapoptotic protein Bcl-2 – were measured in the brain. Histopathology, tyrosine hydroxylase, inducible nitric oxide synthase (iNOS), tumor necrosis factor-α (TNF-α), and cleaved caspase-3 immunohistochemistry were also performed. Rotenone caused a significantly elevated oxidative stress and proinflammatory response in the different brain regions. Malondialdehyde and nitric oxide concentrations were significantly increased, while GSH markedly decreased in the cerebral cortex, striatum, hippocampus, and in the rest of the brain. PON1 and AChE activities significantly decreased with respect to the control levels after rotenone application. Striatal Bcl-2 was significantly decreased while MCP-1 increased following rotenone injection. Rotenone caused prominent iNOS, TNF-α, and caspase-3 immunostaining in the striatum and resulted in markedly decreased tyrosine hydroxylase immunoreactivity in the substantia nigra and striatum. Cerebrolysin coadministered with rotenone decreased lipid peroxidation, increased GSH, and inhibited the elevation of nitric oxide induced by rotenone. Cerebrolysin also decreased the rotenone-induced decline in the PON1 and AChE activities and the rotenone-mediated changes in the striatal Bcl-2 and MCP-1 levels. The drug reduced iNOs, TNF-α, and caspase 3 expressions and increased the tyrosine hydroxylase immunoreactivity in the striatum. Cerebrolysin markedly prevented the development of neuronal damage in the cortex and striatum. These data suggest that cerebrolysin may have potential therapeutic effect in Parkinson’s disease.
Keywords: brain oxidative stress, neuroinflammation, apoptosis, nigrostriatal damage
Introduction
Parkinson’s disease (PD) is the second most prevalent neurodegenerative disorder worldwide, affecting about 1% of people over 65 years old.1 In PD, there is progressive loss of dopamine-producing neurons in the substantia nigra pars compacta (SNc) and subsequent striatal dopamine depletion.2 The denervation of dopaminergic nigrostriatal projections accounts for the cardinal motor symptoms of PD, namely bradykinesia or slowed movement, muscle rigidity, resting tremor, and gait and postural deficits.3,4 In most cases, the etiology of the disease is unknown (idiopathic PD). Genetic causes account for about 5% of cases, having an earlier age of disease onset and are due to either autosomal dominant or autosomal recessive inheritance.5 Although the cause leading to nigrostriatal cell death in idiopathic PD is not yet settled, accumulating evidence suggests the involvement of an environmental toxin(s) and a significant genetic component.6 In this context, an epidemiological study suggested a link between the use of pesticides and the risk for developing PD in rural areas.7 In rodents, one pesticide – rotenone – reproduces several features of PD, including nigrostriatal dopaminergic degeneration and alpha-synuclein positive cytoplasmic inclusions.8,9
Presently, PD therapy relies on the replacement of dopamine, accomplished with the L-dopa/carbidopa or the use of dopamine agonists, catechol-O-methyltransferases or monoamine oxidase-B inhibitors. These drugs, however, do not alter the course of the disease, and the neurons continue to die over time.10 Obviously, there is an immense need for other drugs that would halt the progression of neurodegeneration in PD. Cerebrolysin is a porcine brain-derived peptide and amino acids preparation produced by a standardized enzymatic breakdown of purified brain proteins. Cerebrolysin consists of free amino acids (85%) and peptides with molecular weights below 10 kDa (15%).11,12 The drug has neuroprotective and nootropic effects, enhancing neurological recovery after stroke13–15 and posttraumatic brain injury16 and improving both memory performance and cognitive functions in patients with Alzheimer’s disease and vascular dementia.17–20 Cerebrolysin has been shown to be safe and well-tolerated in clinical trials.18,21,22 Cerebrolysin has important pharmacological actions that are relevant to its beneficial clinical effects, eg, promotion of synaptic regeneration,23 improvement of neuronal survival,24 protection of blood–brain barrier and blood–cerebrospinal fluid barrier,25,26 and promotion of neural progenitor cell migration and neurogenesis.27 Cerebrolysin given before spinal cord injury in rats reduced spinal cord water content, leakage of plasma proteins, and the number of injured neurons.28 Cerebrolysin reduced the number of apoptotic peripheral blood lymphocytes after oxidative stress induced 2-deoxy-D-ribose.29
This study was therefore designed to investigate the effects of cerebrolysin on nigrostriatal cell apoptosis/injury induced in the rat brain by the systemic administration of the pesticide rotenone. The effect of the drug on oxidative, nitrosative stress, and neuroinflammation was investigated since available evidence strongly suggests the importance of these mechanisms in nigrostriatal dopaminergic cell death in PD.30
Materials and methods
Animals
Sprague Dawley rats of either sex weighing (130±10 g) were used in this study. The animals were obtained from the animal house colony of the National Research Centre (Cairo, Egypt). They were housed in stainless steel wire mesh suspended rodent cages under environmentally controlled conditions. The ambient temperature was 25°C±2°C, and the light/dark cycle was 12/12 hours. Standard laboratory food and water were provided ad libitum. All animals received humane care in compliance with the guidelines of the Ethical Committee of the National Research Centre and followed the recommendations of the Guide for the Care and Use of Laboratory Animals (National Institutes of Health publication Number 85-23; revised 1996). Equal groups of six rats each were used in all experiments.
Drugs and chemicals
Rotenone was purchased from Sigma-Aldrich (St Louis, MO, USA) and dissolved in dimethyl sulfoxide (DMSO, Sigma-Aldrich). Cerebrolysin (EVER Neuro Pharma, GmbH, Unterach, Austria) was used and dissolved in isotonic (0.9%, NaCl) saline solution immediately before use. The doses of cerebrolysin in the study were based upon the human dose after conversion to that of rats, according to the Paget and Barnes conversion tables.31 Antityrosine hydroxylase antibody, anti-caspase-3 antibody, anti-iNOS antibody, anti-TNF-α antibody kits (Abcam plc, Cambridge Science Park, Cambridge, UK), avidin/biotin complex kit (Vector Laboratories Inc., Burlingame, CA, USA), biotinylated peroxidase-based kit (Universal Kit; Dako, Carpinteria, CA, USA), 3,3′-diaminobenzidine (Sigma-Aldrich) were used.
Experimental design
Rotenone (1.5 mg/kg, subcutaneously, three times per week) was given alone or in combination with cerebrolysin (21.5, 43, or 86 mg/kg, intraperitoneally daily) for 2 weeks. Rats were randomly divided into five groups, six rats each. Group 1 received the vehicle (0.2 mL DMSO) daily. Group 2 received rotenone at the dose of 1.5 mg/kg, three times per week. Groups 3, 4, and 5 received rotenone (1.5 mg/kg, 0.2 mL subcutaneously, three times per week) in combination with cerebrolysin (21.5, 43, or 86 mg/kg, intraperitoneally daily). Treatments were continued for two weeks. Then, rats were: euthanized by decapitation under ether anesthesia, the brains were then quickly dissected out on an ice-cold plate into different areas, weighed, washed with ice-cold phosphate buffered saline (PBS, pH 7.4), and stored at −80°C until the biochemical analyses. The tissues were homogenized with 0.1 M PBS at pH 7.4 to give a final concentration of 10% weight per volume for the biochemical assays.
Biochemical analysis
Determination of lipid peroxidation
Lipid peroxidation was assayed by measuring the thiobarbituric acid reactive substances in tissue homogenates, as previously described by Ruiz-Larrea et al.32
Determination of GSH
GSH was determined in supernatants by Ellman’s method.33 The procedure is based on the reduction of Ellman’s reagent by the sulfhydryl (thiol) groups of GSH to form 2-nitro-s-mercaptobenzoic acid, the nitromercaptobenzoic acid anion has an intense yellow color that can be determined spectrophotometrically (using the UV-VI8 Recording Spectrophotometer [Shimadzu Corporation, Australia]). GSH concentration was calculated by comparison with a standard curve.
Determination of nitric oxide
Nitric oxide (nitrite) was determined by measuring it in the supernatant by using the Griess reagent, according to the method of Moshage et al.34 The concentration of nitrite in the sample was determined from a NaNO2 standard curve.
Determination of paraoxonase activity
The arylesterase activity of paraoxonase was measured spectrophotometrically in supernatants using phenyl acetate as a substrate.35,36 In this assay, the arylesterase/paraoxonase catalyzes the cleavage of phenyl acetate, resulting in phenol formation. The rate of phenol formation is measured by monitoring the increase in absorbance at 270 nm at 25°C. The working reagent consisted of 20 mM Tris/HCl buffer, pH 8.0, containing 1 mM CaCl2 and 4 mM phenyl acetate as the substrate. Samples diluted 1:3 in buffer are added, and the change in absorbance is recorded following a 20-second lag time. Absorbance at 270 nm was taken every 15 seconds for 120 seconds. One unit of arylesterase activity is equal to 1 μM of phenol formed per minute. The activity is expressed in kU/L, based on the extinction coefficient of phenol of 1,310 M−1 cm−1 at 270 nm, pH 8.0, and 25°C. Blank samples containing water were used to correct for the spontaneous hydrolysis of phenyl acetate.
Determination of acetylcholinesterase activity
The procedure used was a modification of the method of Ellman et al,37 as described by Gorun et al.38 The principle of the method is the measurement of the thiocholine produced as acetylthiocholine is hydrolyzed. The color was read immediately at 412 nm.
Quantification of MCP-1
The level of MCP-1 protein was detected in the striatum using the sandwich-type immunoassay kit (R&D Systems, Minneapolis, MN, USA), according to the manufacturer’s instructions. The lower level of detection for MCP-1 was 32 pg/mL.
Quantification of Bcl-2
The level of human B-cell leukemia/lymphoma 2 (BCl-2) in striatal tissue was determined by a double-antibody sandwich enzyme-linked immunosorbent assay (ELISA) kit, according to the manufacturer’s instructions (Glory Science Co, Ltd, Del Rio, TX, USA).
Histopathology
The brain sections were fixed in freshly prepared 10% neutral buffered formalin, processed routinely, and embedded in paraffin. In addition, 4 μm thick paraffin sections were prepared and stained with hematoxylin and eosin (H&E) for histopathological examination. Sections were examined using a light microscope (Nikon, Japan).
Histomorphometric quantification of H&E-stained brain tissues
The percentage of brain tissue affected by damaged neurons with included nuclei that were rather intensely stained, cytoplasmic vacuolation scarcely separated from surrounding cytoplasm, shrunken, and neuronal atrophy (damaged area) was determined using a computer-assisted automated image analyzer (QWin, LEICA Imaging Systems Ltd; image analyzer unit, Pathology Department, National Research Centre, Cairo, Egypt). The interactive automatic measurement of the percentage of damaged areas was performed on slides stained by H&E by analyzing ten random fields per slide.
Immunohistochemistry for tyrosine hydroxylase
Sections were immunostained for tyrosine hydroxylase (TH) at room temperature with a biotinylated peroxidase-based kit. Deparaffinized sections were rinsed in PBS (2.5 minutes) and then placed in 0.3% H2O2 for 30 minutes to reduce endogenous peroxidase activity. The tissue was then rinsed in PBS (2.5 minutes) and blocked in a PBS solution containing 3% horse serum and 0.1% Triton X-100 for 60 minutes. Without rinsing, the tissue sections were incubated in the blocking solution that also contained a 1:20,000 dilution of monoclonal mouse TH antibody for 60 minutes. The tissue was rinsed (2.5 minutes) with PBS and incubated with a blocking solution that included a 1:300 dilution of biotinylated antimouse antibody. After PBS rinses (2.5 minutes), slices were incubated with avidin-peroxidase reagent, diluted as instructed by the manufacturer. Sections were transferred to a 50 mM Tris-buffered 0.9% saline solution, rinsed, then treated with diaminobenzidine and a final rinse in PBS (2 minutes). Then, it was counterstained with H&E. Sections were mounted on slides, allowed to air dry for 24 hours, dehydrated with a series of ethanol rinses, and cleared with xylene. Sections were cover slipped after at least 24 hours of air drying.
Immunohistochemical assessment of iNOS, TNF-α, and caspase-3 expression
Immunohistochemical staining of iNOS, TNF-α, and caspase-3 antibody were performed with sections of 4 μm thick that were deparaffinized and incubated with fresh 0.3% hydrogen peroxide in methanol for 30 minutes at room temperature. Briefly, deparaffinized brain slides were incubated with the antibodies against iNOS diluted 1:50, TNF-α diluted 1:100, and caspase-3 diluted 1:50. Positive cells were determined with streptavidin biotin-peroxidase secondary antibody (Universal, Dako). The binding sites of antibody were visualized with diaminobenzidine. The sections were then counterstained with hematoxylin, dehydrated using graded alcohols and xylene, and mounted. The immunostaining intensity and cellular localization of iNOS, TNF-α, and caspase-3 were analyzed by light microscopy.
Image analysis for quantitative immunohistochemical reactivity
Optical density measurements of immunoreactivity were determined with a computer-assisted image analysis system (LEICA QWin 500 Image Analyzer, LEICA Imaging Systems Ltd, Cambridge, England; image analyzer unit, Pathology Department, National Research Centre, Cairo, Egypt). Images were composed with a high precision illuminator, a digital camera, and a computer with specific image analysis software. The mean optical density of each region was bilaterally measured on selected brain regions, using consecutive sections in each subject. The degree of reaction was chosen by the color-detect menu. The areas of reactivity were masked by binary color, and the area was measured by using an objective lens of magnification 40× and eye lens 10× – the total magnification was 400×. A total of ten measurements were taken per region by an investigator blinded to the experimental groups. These measurements were averaged to obtain one mean per region for each animal.
Statistical analysis
Data are expressed as mean ± standard error of mean (SEM). The data were analyzed by one-way analysis of variance (ANOVA), followed by Duncan’s multiple range test, using SPSS software (SPSS Inc., Chicago, IL, USA). A probability value of <0.05 was considered statistically significant.
Results
Lipid peroxidation
Following the rotenone injection, there was significant increase in lipid peroxidation, as assessed by malondialdehyde (MDA) levels, in the cerebral cortex (68.5%), striatum (59.9%), hippocampus (52.8%), and in the rest of the brain (51.2%). Cerebrolysin given at 21.5, 43, and 86 mg/kg resulted in decreased MDA in the cortex by −30% to −47.2%, striatum by −26.8% to −38.3%, hippocampus by −36.5% to −31.7%, and in the rest of the brain by −23.1% to −37.4% (Table 1).
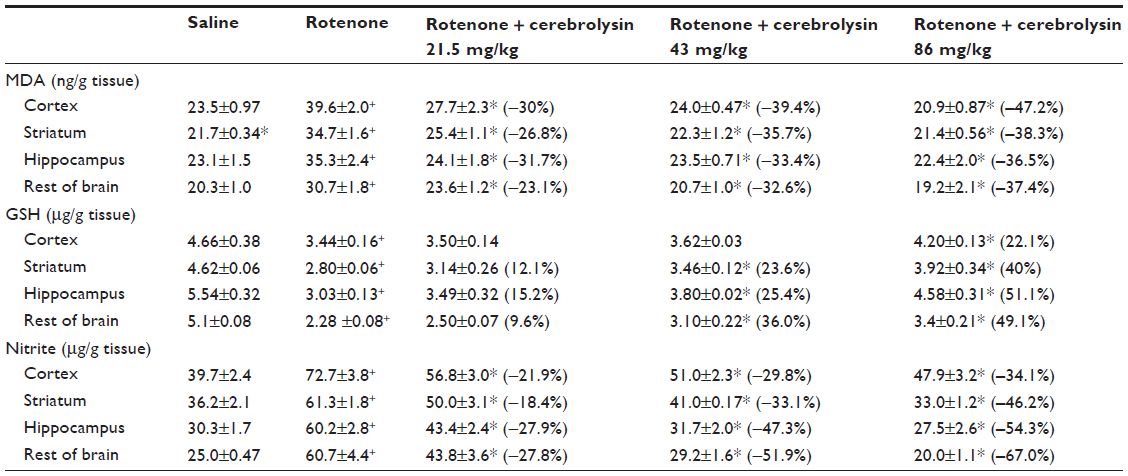 | Table 1 Effect of cerebrolysin on brain oxidative stress induced by systemic rotenone administration |
GSH
The concentration of GSH significantly decreased in the cerebral cortex (−26.2%), striatum (−39.4%), hippocampus (−45.3%), and in the rest of the brain (−55.2%) after the rotenone injection, compared with the control group. Following cerebrolysin treatment at 86 mg/kg, a significant increase in GSH by 22.1% was found in the cerebral cortex. In addition, an increase in the GSH concentration was found in the striatum (23.6%–40%), hippocampus (25.4%–51.1%), and in the rest of the brain (36%–49.1%) following cerebrolysin treatment at 43 and 86 mg/kg, respectively (Table 1).
Nitric oxide
A significant elevation of nitric oxide concentrations (measured as nitrite) was observed in the brain of the animals receiving rotenone. Nitric oxide increased by 83.1%, 69.3%, 98.7%, and 142.8% in the cerebral cortex, striatum, hippocampus, and in the rest of the brain, respectively. Following treatment with cerebrolysin at 21.5–86 mg/kg, a dose-dependent decrease in nitric oxide concentration was found in the cerebral cortex (−21.9% to −34.1%), striatum (−18.4% to −46.2%), hippocampus (−27.9% to −54.3%), and in the rest of the brain (–27.8% to –67%), when compared with the rotenone-only treated group (Table 1).
PON1 activity
Rotenone injection resulted in a significant decrease in PON1 activity in the cerebral cortex (–64.7%), striatum (–67.2%), hippocampus (–68.9%), and in the rest of the brain (–63.6%). Cerebrolysin given at 21.5, 43, and 86 mg/kg produced a significant and dose-dependent increase in the activity in cerebral cortex (73.9%–113%), striatum (105.7%–190.5%), hippocampus (105.6%–208.5%), and in the rest of the brain (101.1%–164.7%) with respect to rotenone control values (Table 2).
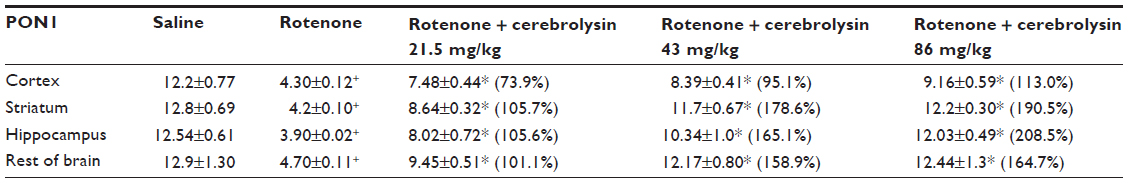 | Table 2 Effect of cerebrolysin on brain PON1 activity induced by systemic rotenone administration |
AChE activity
AChE activity in the cortex was significantly decreased by –45.3% after rotenone injection. Significant and dose-dependent increase in AChE activity was observed after cerebrolysin treatment (by –28.4%, –50.8%, and –74.8%), respectively, compared with the rotenone-only group (Figure 1).
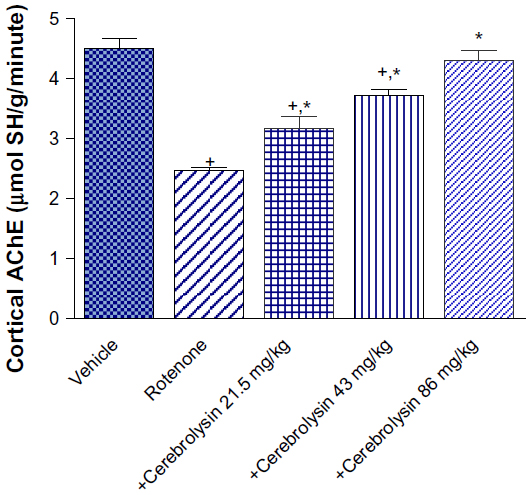 | Figure 1 Effect of cerebrolysin treatment on AChE activity in cortex of rotenone-treated rats. |
Bcl-2
Striatal Bcl-2 concentration showed a significant decrease (36.8% of control value; 0.98±0.04 versus 1.55±0.12 ng/mL) after an injection of rotenone. The concentration of Bcl-2 in the striatum did not change treatment with 21.5 mg/kg of cerebrolysin, but a significant increase (P<0.05) in the Bcl-2 concentration by 13.3% and 51.8% (1.11±0.01 and 1.49±0.11 versus 0.98±0.04) was observed after treatment with cerebrolysin at 43 and 86 mg/kg, as compared with the rotenone-only treated group, respectively (Figure 2).
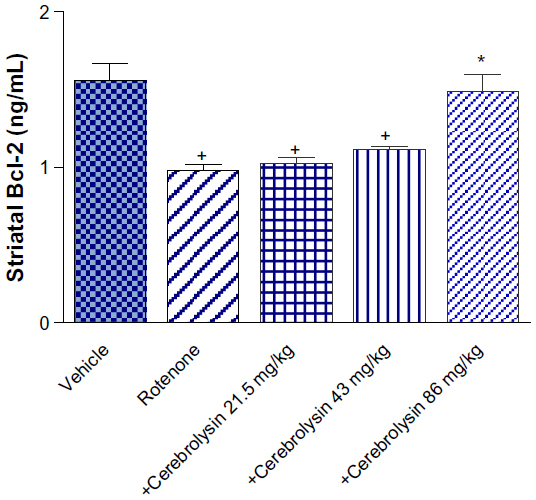 | Figure 2 Effect of cerebrolysin treatment on Bcl-2 in striatum of rotenone-treated rats. |
MCP-1
Compared to controls, the MCP-1 concentrations in the striatum were markedly elevated by rotenone. A significant decline of MCP-1 concentrations by –13.4%, –23%, and –27.2% was observed in the striatum of the animals receiving 21.5, 43, and 86 mg/kg cerebrolysin (Figure 3).
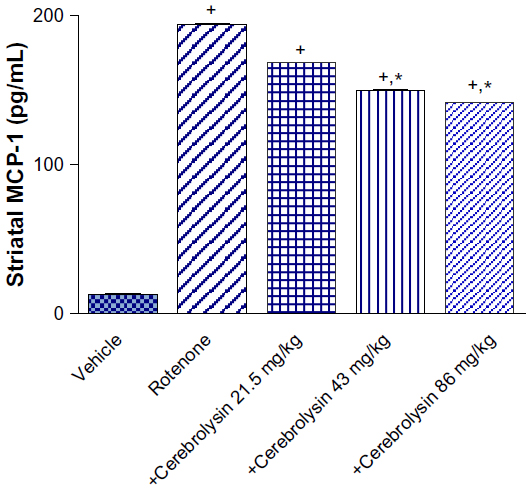 | Figure 3 Effect of cerebrolysin treatment on MCP-1 in striatum of rotenone-treated rats. |
Histopathological results
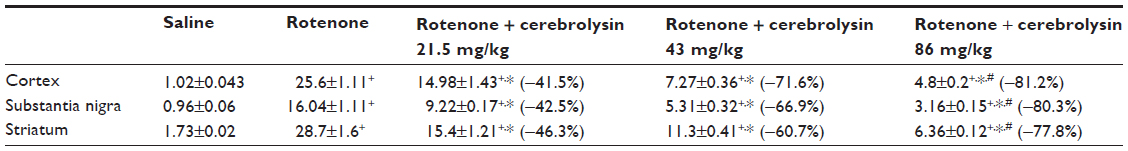
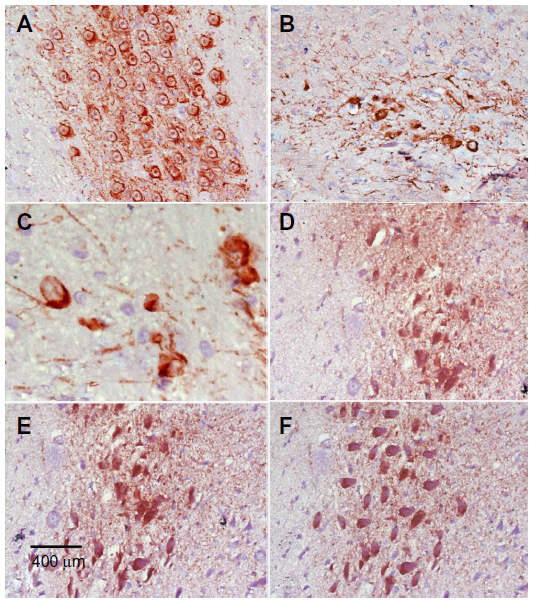
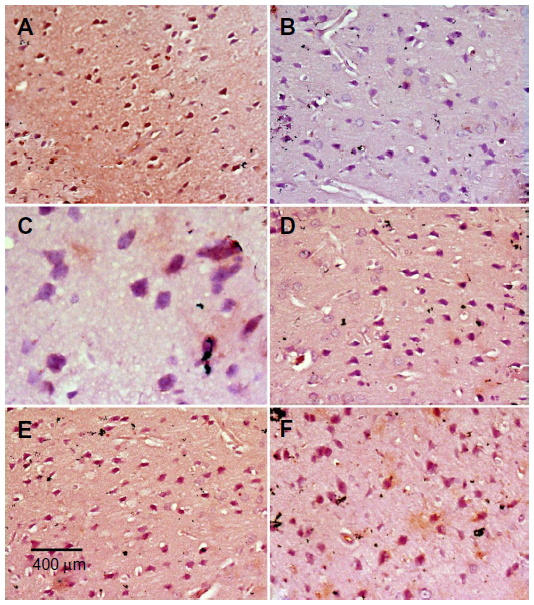
Sections from the cortex and striatum of control (vehicle-treated) group exhibited normal neuronal structure. Neurons retained their shape and normal cellularity with obvious nuclei (Figure 4A and Figure 5A). Sections from the rotenone-treated rats showed marked neuronal degeneration; neurons decreased in number and had indistinct boundaries. The sections also exhibited irregular damaged cells and cytoplasmic shrinkage. There was evidence of pyknotic nuclei and chromatin condensation. Necrosis and perineuronal vacuolation were observed (Figure 4B, 4C, and Figure 5B, 5C). The cortex and striatum of rats coadministered rotenone and cerebrolysin at 21.5 mg/kg showed few pyknotic nuclei. Higher doses of cerebrolysin (43 or 86 mg/kg) protected neurons against the degenerative alterations caused by rotenone (Figure 4E, 4F, and Figure 5E, 5F). Sections from the vehicle-treated rats showed normal substantia nigra (SN) neurons (Figure 6A). Meanwhile, the SN of the rotenone-treated rats exhibited marked neuronal degeneration (Figure 6B, 6C). Cerebrolysin prevented the rotenone-induced damage in the SN in a dose-dependent manner (Figure 6E, 6F). The quantitative analysis of the area of damage in different brain regions is shown (Figure 7 and Table 3).
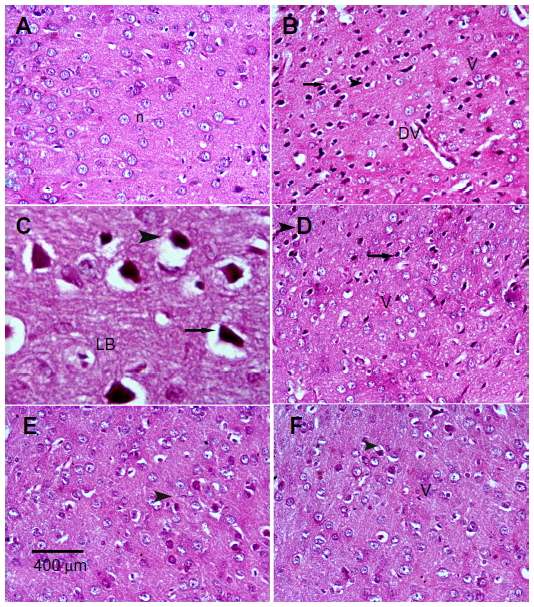 | Figure 4 Representative light microphotographs of H&E stained sections from the cortex of rats treated with vehicle (DMSO), rotenone, or rotenone + cerebrolysin. |
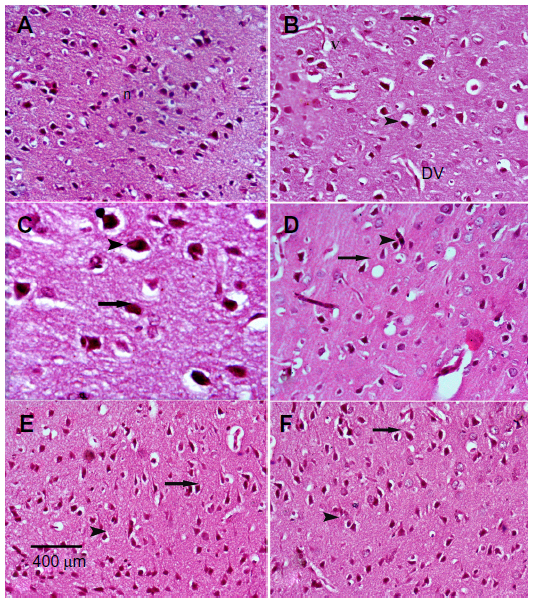 | Figure 5 Representative light microphotographs of H&E stained sections from the striatum of rats treated with vehicle (DMSO), rotenone, or rotenone + cerebrolysin. |
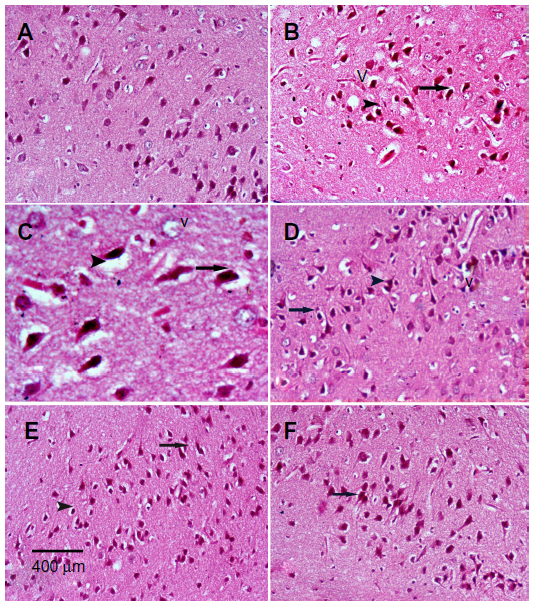 | Figure 6 Representative light microphotographs of H&E stained sections from the substantia of rats treated with vehicle (DMSO), rotenone or rotenone + cerebrolysin. |
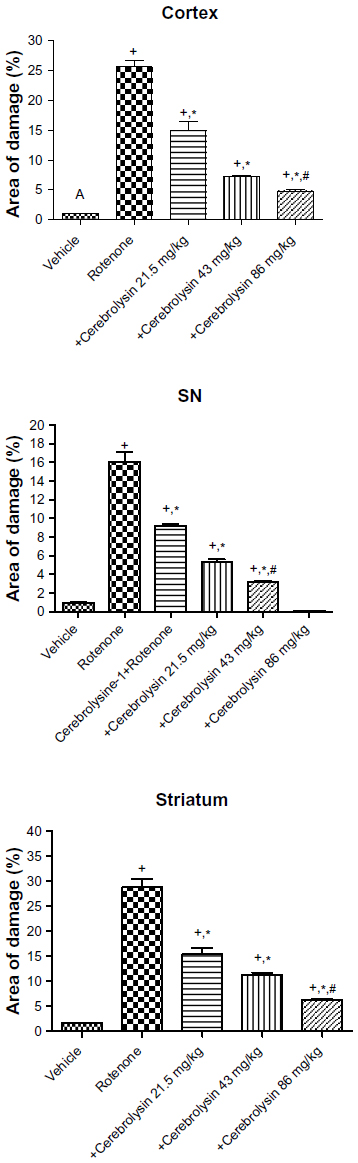 | Figure 7 Histomorphometric measurements of the area of damage in the brain of rotenone or rotenone + cerebrolysin-treated rats. |
 | Table 3 Effect of cerebrolysin on area of damage in the cerebral cortex, substantia nigra, and striatum of rotenone-treated rats |
Immunohistochemistry
Immunostaining for TH in SN and striatum
Images of the SN and striatum of the vehicle-control rats stained with TH antibody (brown) and counterstained with H&E (blue) are shown (Figure 8A and Figure 9A). Rotenone markedly decreased immunoreactivity for TH when compared to vehicle control (Figure 8B, 8C, and Figure 9B, 9C). An increase in TH immunostaining was observed after rotenone and cerebrolysin treatment when compared to the rotenone-only group. The effect of cerebrolysin in improving TH-immunoreactivity was dose-dependent (Figure 8D–F and Figure 9D–F).
 | Figure 8 Representative light microphotographs of TH expression in the SN of rats treated with vehicle (DMSO), rotenone, or rotenone + cerebrolysin. |
 | Figure 9 Representative light microphotographs of TH expression in the striatum of rats treated with vehicle (DMSO), rotenone, or rotenone + cerebrolysin. |
Quantitative analysis of TH-immunoreactivity (ir) indicated a significant decrease in immunoreactivity in the SN and striatum by rotenone (by –33.3% and –43.9%, respectively) compared with the vehicle-treated group. In both areas, treatment with cerebrolysin resulted in a significant increase in TH-ir in a dose-dependent manner (Figure 10 and Table 4).
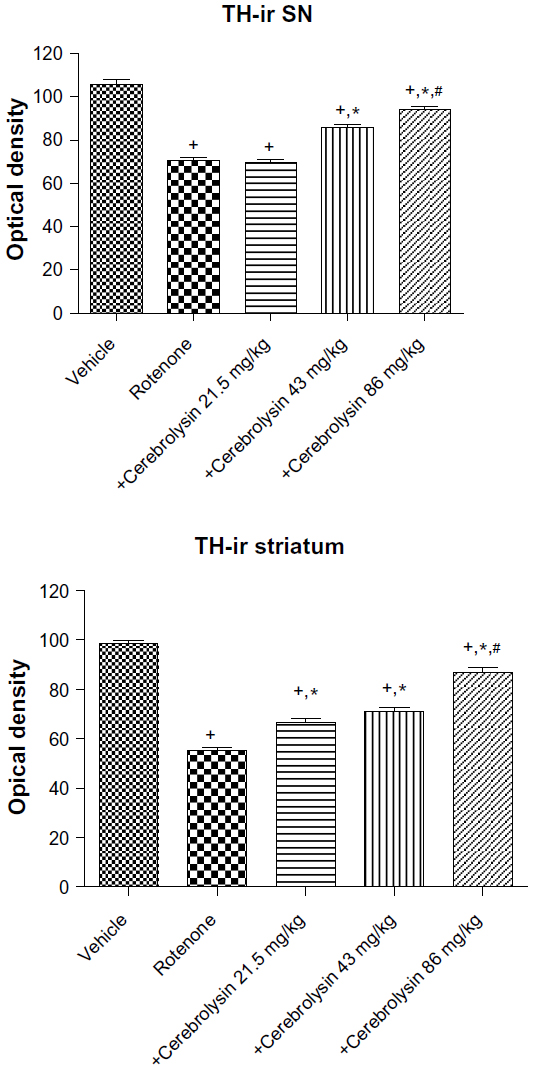 | Figure 10 Optical density measurements of TH-ir in the SN and striatum of rotenone or rotenone + cerebrolysin-treated rats. |
 | Table 4 Effect of cerebrolysin on TH-ir (optical density measurements) in SN and striatum of rotenone-treated rats |
Immunostaining for iNOS in cortex and striatum
In the control group, only a small number of iNOS immunostained positive cells were detected in the cortex and striatum (Figure 11A and Figure 12A). However, prominent iNOS immunolabeling was observed after rotenone injection (Figure 11B, 11C, and Figure 12B, 12C). Cerebrolysin treatment attenuated the high expressions of iNOS in rvotenone-treated rats in a dose-dependent manner (Figure 11E, 11F, and Figure 12E, 12F). The quantitative analysis of iNOS immunoreactivity is shown (Figure 13 and Table 5).
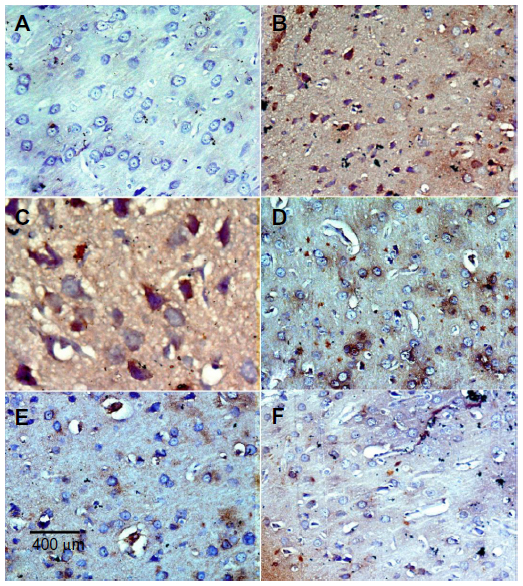 | Figure 11 Representative light microphotographs of iNOS expression in the cortex of rats treated with vehicle (DMSO), rotenone, or rotenone + cerebrolysin. |
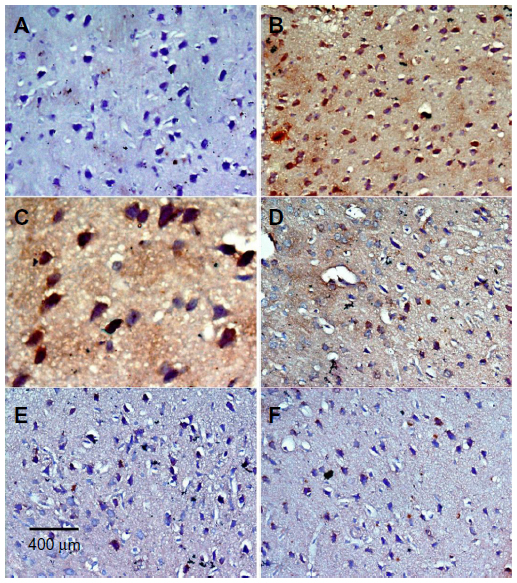 | Figure 12 Representative light microphotographs of iNOS expression in the striatum of rats treated with vehicle (DMSO), rotenone or rotenone + cerebrolysin. |
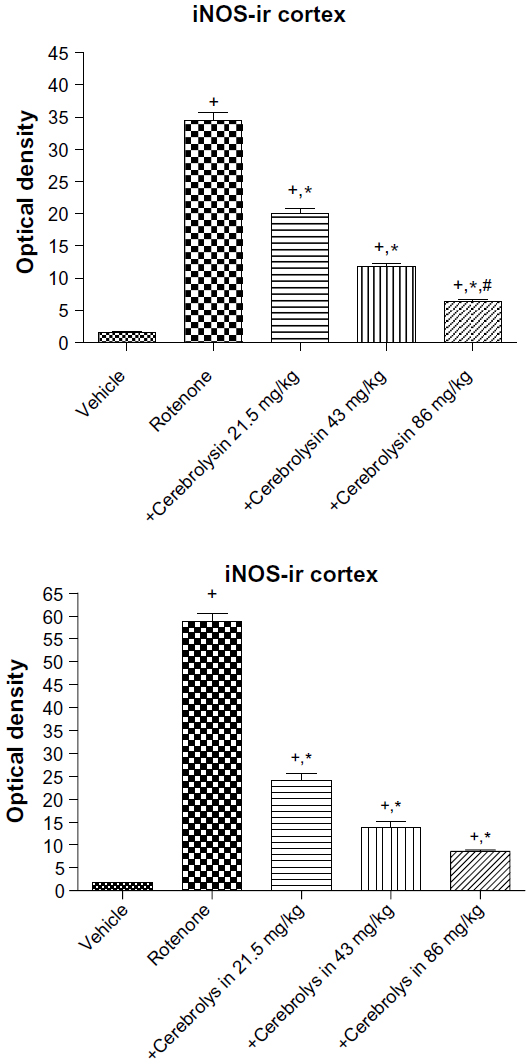 | Figure 13 Optical density measurements of iNOS immunoreactivity in the cortex and striatum of rotenone or rotenone + cerebrolysin-treated rats. |
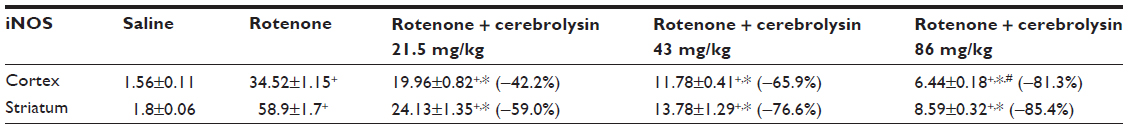 | Table 5 Effect of cerebrolysin on iNOS immunoreactivity (optical density measurements) in the cortex and striatum of rotenone-treated rats |
Immunostaining for TNF-α in striatum
No TNF-α immunostaining was detected in the striatum of the vehicle-treated rats (Figure 14A). In contrast, the dark brown TNF-α immunoreactivity was strongly detected in the striatum of the rotenone-only group (Figure 14B, 14C). Following treatment with cerebrolysin, TNF-α immunopositive cells stained weakly and gradually decreased in number compared to the rotenone only-treated group (Figure 14D–F). Quantitative analysis of TNF-α immunoreactivity is shown (Figure 15 and Table 6).
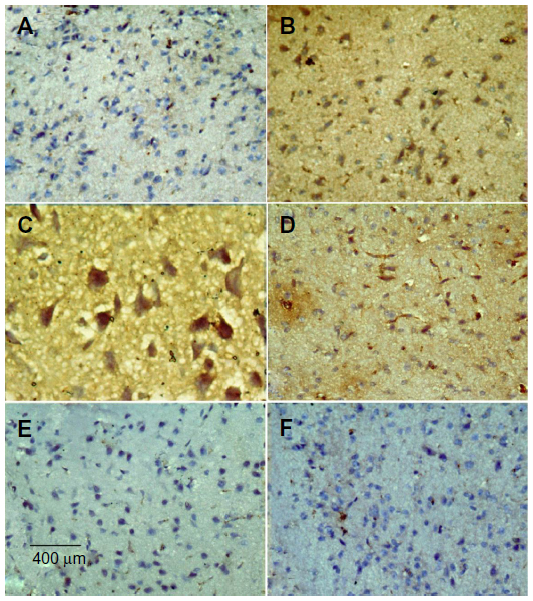 | Figure 14 Representative light microphotographs of TNF-α expression in the striatum of rats treated with vehicle (DMSO), rotenone or rotenone + cerebrolysin. |
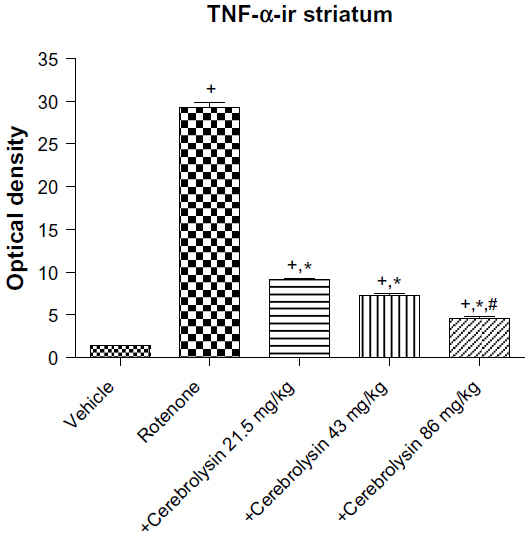 | Figure 15 Optical density measurements of TNF-α immunoreactivity in the striatum of rotenone or rotenone + cerebrolysin-treated rats. |
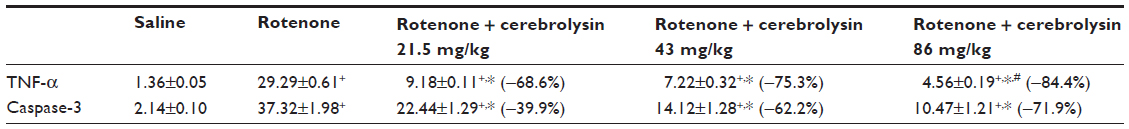 | Table 6 Effect of cerebrolysin on TNF-α and caspase-3 immunoreactivity (optical density measurements) in the striatum of rotenone-treated rats |
Immunostaining for caspase-3 in striatum
Sections from the striatum of vehicle-treated rats did not show immunopositive cells (Figure 16A). However, the rotenone-only group displayed extensive immunopositive cells of caspase-3 (Figure 16B, 16C). On the other hand, caspase-3 positive cells were reduced after cotreatment with cerebrolysin and rotenone compared with the rotenone-only treated group (Figure 16D, 16F). Quantitative analysis of caspase-3 immunoreactivity is shown (Figure 17 and Table 6).
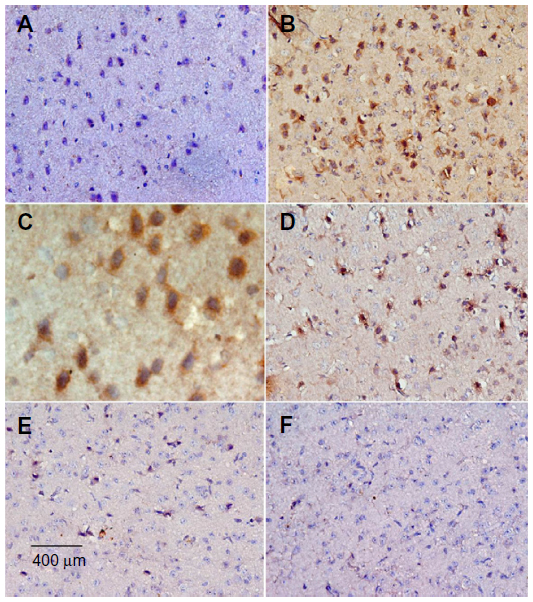 | Figure 16 Representative light microphotographs of caspase-3 expression in the striatum of rats treated with vehicle (DMSO), rotenone, or rotenone + cerebrolysin. |
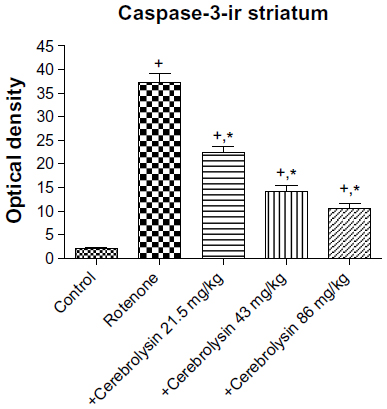 | Figure 17 Optical density measurements of caspase-3 immunoreactivity in the striatum of rotenone or rotenone + cerebrolysin-treated rats. |
Discussion
The present study provides evidence that the systemic administration of rotenone can induce oxidative stress in different brain regions. The results showed that lipid peroxidation and nitric oxide were significantly increased, while GSH decreased in rotenone-treated rats compared to the control group. Rotenone caused nigrostriatal degeneration and the loss of dopamine from the SN and the striatum. Rotenone-induced apoptosis that was confirmed by the decreased Bcl-2 concentration and increased cleaved caspase-3 expression in the striatum. Rotenone has widely been used in rodents to model human PD. The pesticide, a complex I inhibitor, has been shown to replicate many of the pathological features of PD, such as nigrostriatal dopaminergic degeneration, decreased nigrostriatal TH-ir, and the alpha-synuclein positive cytoplasmic inclusions in nigral neurons.8,9,39 The mechanism of neurotoxicity is thought to be related to the increased oxidative stress by the toxin. This is because alpha tocopherol, which decreased oxidative damage to proteins, blocked neuronal cell death and prevented the decrease in the TH protein level in SN cells in vitro.40,41
In the present study, we found that cerebrolysin has marked antioxidant action in the rotenone model of nigrostriatal injury by decreasing the lipid peroxidation product, MDA. Our findings indicated that cerebrolysin limited the decrease in GSH induced by rotenone in the striatum and in other brain areas. This GSH-sparing action of cerebrolysin could possibly be due to an antioxidant activity of the drug. Glutathione is an intracellular tripeptide (γ-glutamyl-cysteinyl-glycine), which acts to maintain intracellular redox balance and thus protects the cell against oxidative injury. Glutathione functions as substrate for glutathione peroxidase and glutathione-S-transferases, and as a direct free-radical scavenger. By keeping sulfhydryl groups of proteins in the reduced form, glutathione maintains the thiol redox potential in cells. Thus, decreased GSH availability would render the cells more susceptible to oxidative injury.42–44 Glutathione depletion increases cellular labile iron pool, enhances oxidative stress, increases the levels of excitotoxic molecules, and – hence –initiates neuronal cell death.45–47 Reduced glutathione levels have been associated with a number of neurological diseases, including PD, bipolar disorder, and schizophrenia.48–50 In PD, lowered glutathione content has been found in the SNc postmortem.51–53 In one study, untreated patients with PD showed symptomatic efficacy after intravenous glutathione therapy, with a 42% decline in disability that lasted after stopping treatment.54 Thus, by sparing brain GSH, cerebrolysin might prove beneficial to PD patients.
It is well-established that excessive nitric oxide production via the inducible form of nitric oxide synthase (iNOS) plays a fundamental role in neuronal cell damage.55,56 iNOS is not usually expressed in cells, but its expression can be induced by bacterial lipopolysaccharide, cytokines, and other inflammatory signals.57 It is induced in the brain by glial cells and microvascular endothelium during inflammatory and ischemic conditions.58
Results from the present experiments indicate that rotenone increases nitric oxide concentrations in different brain regions. Increased iNOS expression was detected in the cortex and striatum of rotenone-treated rats, which is in accordance with our previous observations following systemic rotenone injection in mice.59 Results from other studies also indicated considerable increase in nitric acid concentrations in the frontal cortex and in the striatum of rats administered rotenone systemically.60,61 This suggests that nitric oxide generated by iNOS might play an important role in the neurotoxic effects of rotenone. High levels of nitric oxide for prolonged time generated by iNOS during pathological states and involve the formation of reactive nitrogen species, results in the so-called “nitrosative stress”.62,63 The neurotoxicity is due to a reaction with the superoxide anion, which results in the formation of peroxynitrite capable to nitrate and oxidize proteins, lipids, and nucleic acids.64 Low levels of nitric oxide can also induce neuronal death under hypoxic conditions by inhibiting mitochondrial respiration in competition with oxygen at cytochrome oxidase.65 Nitric oxide synthesized by the neuronal NOS might be also involved in neurotoxic effects of rotenone.66 The present study provides evidence that the administration of cerebrolysin had reduced the increase in nitric oxide level in different brain regions caused by rotenone. The immunoreactivity for iNOS in the cortex and striatum was significantly reduced by cerebrolysin. This suggests that the decreased iNOS expression and the reduction in nitric acid generation could be one mechanism by which the drug prevents the rotenone-induced neuronal damage.
Our findings demonstrate that the inhibition of the activity of PON1 enzyme in the brain is a prominent feature of rotenone toxicity. The observations in the present study are consistent with our previous data, indicating decreased PON1 activity in the brain of mice given systemic rotenone and in rats following the intrastriatal injection of the pesticide.61,67 This enzyme with arylesterase and lactonase activities is synthesized in the liver and released into the circulation where it associates with high-density lipoproteins, preventing their oxidation.36 The enzyme exhibits a broad substrate specificity hydrolyzing organophosphates, such as pesticides, nerve agents, lipid hydroperoxides, lactones, and thiolactones and many other xenobiotics.68–70 Only recently, the enzyme has come to be a focus of much interest for a possible role in the pathogenesis of PD. Several PON1 polymorphisms have been shown to influence the risk for developing PD; carriers of slow metabolizer and lower-activity variants leading to decreased PON1 expression levels are likely to be most susceptible to pesticide exposures.71–74 Decreased serum enzyme activity was also found in a number of neurodegenerative conditions, such as dementia75,76 or multiple sclerosis.77
Here, we demonstrate that the administration of cerebrolysin was able to reverse the marked decline in the activity of the enzyme induced by rotenone in several brain regions. This suggests that the protective effect of cerebrolysin on the rotenone-induced nigrostriatal damage could be, at least in part, mediated by upregulating PON1 activity in the face of increased oxidative stress. It is also possible that the observed increase or maintenance of the enzyme activity reflects decreased oxidative stress, due to an antioxidant effect of cerebrolysin. In support of this notion is a study showing decreased PON1 activity with elevated oxidative stress levels.78
Caspase proteins are cysteine proteases and members of the interleukin-1β-converting enzyme family involved in the initiation and execution of programmed cell death or apoptosis.79,80 Caspase-3, the active form of procaspase-3, is most frequently involved in neuronal apoptosis.81 Rotenone induces caspase-3-mediated apoptosis in dopaminergic neurons. This effect was observed in vitro at low nanomolar concentrations of rotenone.82,83 In the present study, strong cleaved caspase-3 expression could be detected in degenerating neurons of the cortex and striatum after rotenone injection. These findings are consistent with our previous data following systemic rotenone injection in mice.59 Cerebrolysin resulted in very few caspase-3 positive cells being present, suggesting that the drug inhibits rotenone-induced brain cell damage possibly via interference with caspase-3 activation. These results may be of significance in the use of cerebrolysin in PD. Caspase-3 activation precedes apoptotic cell death in PD,84 and the percentage of active caspase-3-positive neurons among dopaminergic neurons are significantly higher in SNc of PD patients than in the controls.84,85
To further examine the effect of cerebrolysin on the rotenone-induced apoptosis, Bcl-2 protein concentration in the striatum was measured. Within the core of the apoptotic program, there are also the Bcl-2 family of proteins and the Apaf-1/CED-4 protein that relays the signals integrated by Bcl-2 family proteins to caspase.80 The Bcl-2 protein prevents the redistribution of the proapoptotic protein Bax from the cytosol to the mitochondria following exposure of cells to apoptotic signals. This prevents the mitochondrial membrane permeabilization, transmembrane passage of cytochrome complex, and the subsequent activation of caspase proteins and apoptosis.86–88 Bcl-2 has antioxidant properties, and its expression is modulated by oxidative stress. Enhanced oxidative stress and susceptibility to oxidants and altered levels of antioxidant enzymes occurred in the brains of Bcl-2-deficient mice.89 Bcl-2 acted to inhibit oxidant-induced cell death, at least in part through an antioxidant pathway, involving glutathione;90 whereas, acute oxidative stress reduced Bcl-2 expression.91 Our results demonstrated markedly decreased Bcl-2 protein concentration in striatum following rotenone injection. Our findings also indicate that cerebrolysin prevented the decline in striatal Bcl-2 concentration induced by rotenone. These results suggest that cerebrolysin interferes with caspase-3 activation by maintaining the level of Bcl-2, possibly by reducing oxidative stress.
The present study also indicates marked increase in the concentration of the chemokine MCP-1 in the striatum following rotenone injection. Chemokines are a family of low molecular weight proteins associated with inflammatory cell recruitment in host defense. In addition to being potent leucocyte chemotactic factors, these proteins modulate a number of biological responses, such as enzyme secretion, cellular adhesion, cytotoxicity, and T-cell activation.92 Chemokines and chemokine receptors are constitutively expressed at low levels in the brain in astrocytes, microglia, and neurons. They are induced by inflammatory mediators.93 The MCP-1 involved in the chemotaxis and activation of phagocytes and lymphocytes is increased in a number of neurological disorders, eg, Guillain–Barré syndrome.94 MCP-1–/– mice have decreased brain inflammation after a peripheral lipopolysaccharide insult, despite an exaggerated peripheral response. MCP-1 is important in the regulation of brain inflammation since MCP-1–/– mice have decreased brain inflammation after a peripheral endotoxin challenge.95 Studies also showed that neuronal MCP-1 is induced during mild impairment of oxidative metabolism. MCP-1 causes microglia recruitment/activation to produce cytokines and exacerbates neurodegeneration.96 Our data showed that the rotenone-induced elevation in striatal MCP-1 decreased after treatment with cerebrolysin. Cerebrolysin, thus, might exert its neuroprotective action, at least in part, by preventing the release of MCP-1 during inflammation.
In the present study, a significant decrease in the activity of cortical AChE, the acetylcholine-degrading enzyme, was recorded in rotenone-treated rats. Acetylcholine is the most important neurotransmitter involved in the regulation of cognitive functions.97 In PD, the dopaminergic/cholinergic imbalance results from the loss of dopamine-producing neurons of the nigrostriatal pathway,98 and anticholinergic drugs are used especially early in the course of the disease.99 Our findings indicate restoration of cortical AChE activity following cerebrolysin administration to rotenone-treated rats. This suggests cerebrolysin could be a potential additive treatment in PD. Rotenone induced cell death of cholinergic and dopaminergic neurons in an organotypic cell culture model.100 The decline in AChE activity could, therefore, be accounted for by the rotenone-induced neurodegeneration; this was prevented by cerebrolysin.
Our data also indicated an increased expression of the proinflammatory cytokine TNF-α in the striatum of rotenone-treated rats, which therefore supports the notion of the involvement of an inflammatory process in neurodegeneration caused by rotenone. This potent proinflammatory cytokine is a member of the TNF superfamily with important functions in immunity, inflammation, differentiation, control of cell proliferation, and apoptosis; it can be synthesized in the central nervous system by microglia, astrocytes, and some populations of neurons.101 TNF-α contributes to dopaminergic neuronal death following nigrostriatal neurotoxins, such as 6-hydroxydopamine,102 and 1-methyl-4-phenyl-1,2,3,6-tetrahydropyridine.103 In addition, adenoviral mediated expression of low TNF-α levels in the SN caused dopaminergic cell death.104 Results in the present study indicate decreased expression of striatal TNF-α of rotenone-treated rats by cerebrolysin administration. This suggests that the neuroinflammatory response elicited by the systemic administration of rotenone is inhibited by cerebrolysin.
The histological findings in the current study showed that cerebrolysin protected nigrostriatal as well as cortical neurons against rotenone-induced injury – neuronal degeneration and apoptosis being decreased by the drug. Immunostaining for tyrosine hydroxylase in the SN and striatum indicated that treatment with cerebrolysin prevented the loss of TH-immunoreactivity caused by rotenone in dose-dependent manner. Taken together, the results of the present study indicate a neuroprotective action of cerebrolysin in the model of rotenone-induced nigrostriatal damage. This action of cerebrolysin is likely to involve decreased oxidative stress and neuroinflammatory response, as well as an antiapoptotic effect. Cerebrolysin might thus find utility in the treatment of PD.
Disclosure
The authors have no conflicts of interest to declare with respect to this work.
References
Benninger DH, Thees S, Kollias SS, Bassetti CL, Waldvogel D. Morphological differences in Parkinson’s disease with and without rest tremor. J Neurol. 2009;256(2):256–263. | |
Hughes AJ, Daniel SE, Kilford L, Lees AJ. Accuracy of clinical diagnosis of idiopathic Parkinson’s disease: a clinico-pathological study of 100 cases. J Neurol Neurosurg Psychiatry. 1992;55(3):181–184. | |
Berardelli A, Rothwell JC, Thompson PD, Hallett M. Pathophysiology of bradykinesia in Parkinson’s disease. Brain. 2001;124(Pt 11):2131–2146. | |
Santens P, Boon P, Van Roost D, Caemaert J. The pathophysiology of motor symptoms in Parkinson’s disease. Acta Neurol Belg. 2003;103(3):129–134. | |
Pankratz N, Foroud T. Genetics of Parkinson disease. Genet Med. 2007;9(12):801–811. | |
Wirdefeldt K, Adami HO, Cole P, Trichopoulos D, Mandel J. Epidemiology and etiology of Parkinson’s disease: a review of the evidence. Eur J Epidemiol. 2011;26 Suppl 1:S1–S58. | |
Hancock DB, Martin ER, Mayhew GM, et al. Pesticide exposure and risk of Parkinson’s disease: a family-based case-control study. BMC Neurol. 2008;8:6. | |
Betarbet R, Sherer TB, MacKenzie G, Garcia-Osuna M, Panov AV, Greenamyre JT. Chronic systemic pesticide exposure reproduces features of Parkinson’s disease. Nat Neurosci. 2000;3(12):1301–1306. | |
Sherer TB, Kim JH, Betarbet R, Greenamyre JT. Subcutaneous rotenone exposure causes highly selective dopaminergic degeneration and alpha-synuclein aggregation. Exp Neurol. 2003;179(1):9–16. | |
Rascol O, Lozano A, Stern M, Poewe W. Milestones in Parkinson’s disease therapeutics. Mov Disord. 2011;26(6):1072–1082. | |
Mallory M, Honer W, Hsu L, Johnson R, Rockenstein E, Masliah E. In vitro synaptotrophic effects of Cerebrolysin in NT2N cells. Acta Neuropathol. 1999;97(5):437–446. | |
Hartbauer M, Hutter-Paier B, Skofitsch G, Windisch M. Antiapoptotic effects of the peptidergic drug cerebrolysin on primary cultures of embryonic chick cortical neurons. J Neural Transm. 2001;108(4):459–473. | |
Ladurner G, Kalvach P, Moessler H; Cerebrolysin Study Group. Neuroprotective treatment with cerebrolysin in patients with acute stroke: a randomised controlled trial. J Neural Transm. 2005;112(3):415–428. | |
Ren J, Sietsma D, Qiu S, Moessler H, Finklestein SP. Cerebrolysin enhances functional recovery following focal cerebral infarction in rats. Restor Neurol Neurosci. 2007;25(1):25–31. | |
Heiss WD, Brainin M, Bornstein NM, Tuomilehto J, Hong Z; Cerebrolysin Acute Stroke Treatment in Asia (CASTA) Investigators. Cerebrolysin in patients with acute ischemic stroke in Asia: results of a double-blind, placebo-controlled randomized trial. Stroke. 2012;43(3):630–636. | |
Wong GK, Zhu XL, Poon WS. Beneficial effect of cerebrolysin on moderate and severe head injury patients: result of a cohort study. Acta Neurochir Suppl. 2005;95:59–60. | |
Ruther E, Ritter R, Apecechea M, Freitag S, Windisch M. Efficacy of Cerebrolysin in Alzheimer’s disease. In: Jellinger KA, Ladurner G, Windisch M, editors. New Trends in the Diagnosis and Therapy of Alzheimer’s Disease. Vienna: Springer-Verlag; 1994:131–141. | |
Alvarez XA, Cacabelos R, Laredo M, et al. A 24-week, double-blind, placebo-controlled study of three dosages of Cerebrolysin in patients with mild to moderate Alzheimer’s disease. Eur J Neurol. 2006;13(1):43–54. | |
Damulin IV, Koberskaya NN, Mkhitaryan EA. Effects of cerebrolysin on moderate cognitive impairments in cerebral vascular insufficiency (a clinical-electrophysiological study). Neurosci Behav Physiol. 2008;38(6):639–645. | |
Allegri RF, Guekht A. Cerebrolysin improves symptoms and delays progression in patients with Alzheimer’s disease and vascular dementia. Drugs Today (Barc). 2012;48 Suppl A:25–41. | |
Bajenaru O, Tiu C, Moessler H, et al. Efficacy and safety of Cerebrolysin in patients with hemorrhagic stroke. J Med Life. 2010;3(2):137–143. | |
Thome J, Doppler E. Safety profile of Cerebrolysin: clinical experience from dementia and stroke trials. Drugs Today (Barc). 2012;48 Suppl A:63–69. | |
Rockenstein E, Adame A, Mante M, Moessler H, Windisch M, Masliah E. The neuroprotective effects of Cerebrolysin in a transgenic model of Alzheimer’s disease are associated with improved behavioral performance. J Neural Transm. 2003;110(11):1313–1327. | |
Safarova ER, Shram SI, Grivennikov IA, Myasoedov NF. Trophic effects of nootropic peptide preparations cerebrolysin and semax on cultured rat pheochromocytoma. Bull Exp Biol Med. 2002;133(4):401–403. | |
Sharma HS, Zimmermann-Meinzingen S, Sharma A, Johanson CE. Cerebrolysin attenuates blood–brain barrier and brain pathology following whole body hyperthermia in the rat. Acta Neurochir Suppl. 2010;106:321–325. | |
Sharma HS, Zimmermann-Meinzingen S, Johanson CE. Cerebrolysin reduces blood-cerebrospinal fluid barrier permeability change, brain pathology, and functional deficits following traumatic brain injury in the rat. Ann N Y Acad Sci. 2010;1199:125–137. | |
Zhang C, Chopp M, Cui Y, et al. Cerebrolysin enhances neurogenesis in the ischemic brain and improves functional outcome after stroke. J Neurosci Res. 2010;88(15):3275–3281. | |
Menon PK, Muresanu DF, Sharma A, Mössler H, Sharma HS. Cerebrolysin, a mixture of neurotrophic factors induces marked neuroprotection in spinal cord injury following intoxication of engineered nanoparticles from metals. CNS Neurol Disord Drug Targets. 2012;11(1):40–49. | |
Formichi P, Radi E, Battisti C, Di Maio G, Muresanu D, Federico A. Cerebrolysin administration reduces oxidative stress-induced apoptosis in lymphocytes from healthy individuals. J Cell Mol Med. 2012;16(11):2840–2843. | |
Miller RL, James-Kracke M, Sun GY, Sun AY. Oxidative and inflammatory pathways in Parkinson’s disease. Neurochem Res. 2009;34(1):55–65. | |
Paget GE, Barnes JM. Toxicity testing. In: Laurence DR, Bacharach AL, editors. Evaluation of Drug Activities Pharmacometics. London: Academic Press; 1964:134–166. | |
Ruiz-Larrea MB, Leal AM, Liza M, Lacort M, de Groot H. Antioxidant effects of estradiol and 2-hydroxyestradiol on iron-induced lipid peroxidation of rat liver microsomes. Steroids. 1994;59(6):383–388. | |
Ellman GL. Tissue sulfhydryl groups. Arch Biochem Biophys. 1959;82(1):70–77. | |
Moshage H, Kok B, Huizenga JR, Jansen PL. Nitrite and nitrate determination in plasma: a critical evaluation. Clin Chem. 1995; 41(6 Pt 1):892–896. | |
Higashino K, Takahashi Y, Yamamura Y. Release of phenyl acetate esterase from liver microsomes by carbon tetrachloride. Clin Chim Acta. 1972;41:313–320. | |
Watson AD, Berliner JA, Hama SY, et al. Protective effect of high density lipoprotein associated paraoxonase. Inhibition of the biological activity of minimally oxidized low density lipoprotein. J Clin Invest. 1995;96(6):2882–2891. | |
Ellman GL, Courtney KD, Andres V Jr, Feather-Stone RM. A new and rapid colorimetric determination of acetylcholinesterase activity. Biochem Pharmacol. 1961;7:88–95. | |
Gorun V, Proinov I, Baltescu V, Balaban G, Barzu O. Modified Ellman procedure for assay of cholinesterases in crude enzymatic preparations. Anal Biochem. 1978;86(1):324–326. | |
Feng Y, Liang ZH, Wang T, Qiao X, Liu HJ, Sun SG. alpha-Synuclein redistributed and aggregated in rotenone-induced Parkinson’s disease rats. Neurosci Bull. 2006;22(5):288–293. | |
Sherer TB, Betarbet R, Testa CM, et al. Mechanism of toxicity in rotenone models of Parkinson’s disease. J Neurosci. 2003;23(34):10756–10764. | |
Testa CM, Sherer TB, Greenamyre JT. Rotenone induces oxidative stress and dopaminergic neuron damage in organotypic substantia nigra cultures. Brain Res Mol Brain Res. 2005;134(1):109–118. | |
Meister A. Glutathione metabolism and its selective modification. J Biol Chem. 1988;263(33):17205–17208. | |
Cotgreave IA, Gerdes RG. Recent trends in glutathione biochemistry – glutathione-protein interactions: a molecular link between oxidative stress and cell proliferation? Biochem Biophys Res Commun. 1998;242(1):1–9. | |
Dringen R. Metabolism and functions of glutathione in brain. Prog Neurobiol. 2000;62(6):649–671. | |
Bains JS, Shaw CA. Neurodegenerative disorders in humans: the role of glutathione in oxidative stress-mediated neuronal death. Brain Res Brain Res Rev. 1997;25(3):335–358. | |
Kaur D, Lee D, Ragapolan S, Andersen JK. Glutathione depletion in immortalized midbrain-derived dopaminergic neurons results in increases in the labile iron pool: implications for Parkinson’s disease. Free Radic Biol Med. 2009;46(5):593–598. | |
Jha N, Jurma O, Lalli G, et al. Glutathione depletion in PC12 results in selective inhibition of mitochondrial complex I activity. Implications for Parkinson’s disease. J Biol Chem. 2000;275(34):26096–26101. | |
Schulz JB, Lindenau J, Seyfried J, Dichgans J. Glutathione, oxidative stress and neurodegeneration. Eur J Biochem. 2000;267(16):4904–4911. | |
Dean OM, van den Buuse M, Bush AI, et al. A role for glutathione in the pathophysiology of bipolar disorder and schizophrenia? Animal models and relevance to clinical practice. Curr Med Chem. 2009;16(23):2965–2976. | |
Gawryluk JW, Wang JF, Andreazza AC, Shao L, Young LT. Decreased levels of glutathione, the major brain antioxidant, in post-mortem prefrontal cortex from patients with psychiatric disorders. Int J Neuropsychopharmacol. 2011;14(1):123–130. | |
Sofic E, Lange KW, Jellinger K, Riederer P. Reduced and oxidized glutathione in the substantia nigra of patients with Parkinson’s disease. Neurosci Lett. 1992;142(2):128–130. | |
Sian J, Dexter DT, Lees AJ, et al. Alterations in glutathione levels in Parkinson’s disease and other neurodegenerative disorders affecting basal ganglia. Ann Neurol. 1994;36(3):348–355. | |
Fitzmaurice PS, Ang L, Guttman M, Rajput AH, Furukawa Y, Kish SJ. Nigral glutathione deficiency is not specific for idiopathic Parkinson’s disease. Mov Disord. 2003;18(9):969–976. | |
Sechi G, Deledda MG, Bua G, et al. Reduced intravenous glutathione in the treatment of early Parkinson’s disease. Prog Neuropsychopharmacol Biol Psychiatry. 1996;20(7):1159–1170. | |
Wei T, Chen C, Hou J, Xin W, Mori A. Nitric oxide induces oxidative stress and apoptosis in neuronal cells. Biochim Biophys Acta. 2000; 1498(1):72–79. | |
Bal-Price A, Brown GC. Inflammatory neurodegeneration mediated by nitric oxide from activated glia-inhibiting neuronal respiration, causing glutamate release and excitotoxicity. J Neurosci. 2001;21(17):6480–6491. | |
Förstermann U, Sessa WC. Nitric oxide synthases: regulation and function. Eur Heart J. 2012;33(7):829–837, 837a–837d. | |
Kovac A, Erickson MA, Banks WA. Brain microvascular pericytes are immunoactive in culture: cytokine, chemokine, nitric oxide, and LRP-1 expression in response to lipopolysaccharide. J Neuroinflammation. 2011;8:139. | |
Abdel-Salam OME, Omara EA, El-Shamarka MES, Hussein JS. Nigrostriatal damage after systemic rotenone and/or lipopolysaccharide and the effect of cannabis. Comparative Clinical Pathology. 2013;1–16. | |
Bashkatova V, Alam M, Vanin A, Schmidt WJ. Chronic administration of rotenone increases levels of nitric oxide and lipid peroxidation products in rat brain. Exp Neurol. 2004;186(2):235–241. | |
Schmidt WJ, Alam M. Controversies on new animal models of Parkinson’s disease pro and con: the rotenone model of Parkinson’s disease (PD). J Neural Transm Suppl. 2006;(70):273–276. | |
Moncada S, Palmer RM, Higgs EA. Nitric oxide: physiology, pathophysiology, and pharmacology. Pharmacol Rev. 1991;43(2):109–142. | |
Wink DA, Mitchell JB. Chemical biology of nitric oxide: Insights into regulatory, cytotoxic, and cytoprotective mechanisms of nitric oxide. Free Radic Biol Med. 1998;25(4–5):434–456. | |
Korhonen R, Lahti A, Kankaanranta H, Moilanen E. Nitric oxide production and signaling in inflammation. Curr Drug Targets Inflamm Allergy. 2005;4(4):471–479. | |
Mander P, Borutaite V, Moncada S, Brown GC. Nitric oxide from inflammatory-activated glia synergizes with hypoxia to induce neuronal death. J Neurosci Res. 2005;79(1–2):208–215. | |
He Y, Imam SZ, Dong Z, et al. Role of nitric oxide in rotenone-induced nigro-striatal injury. J Neurochem. 2003;86(6):1338–1345. | |
Abdel-Salam OME, Khadrawy YA, Youness ER, et al. Effect of a single intrastriatal rotenone injection on oxidative stress and neurodegeneration in the rat brain. Comparative Clinical Pathology. 2013;1–11. | |
La Du BN. Human serum paraoxonase: arylesterase. In: Kalow W, editor. Pharmacogenetics of Drug Metabolism. New York: Pergamon Press; 1992:51–91. | |
Draganov DI, La Du BN. Pharmacogenetics of paraoxonases: a brief review. Naunyn Schmiedebergs Arch Pharmacol. 2004;369(1):78–88. | |
Furlong CE. Paraoxonases: An Historical Perspective. In: Mackness B, Mackness M, Aviram M, Paragh G, editors. The Paraoxonases: Their Role in Disease Development and Xenobiotic Metabolism. Dordrecht: Springer; 2008:3–31. | |
Kondo I, Yamamoto M. Genetic polymorphism of paraoxonase 1 (PON1) and susceptibility to Parkinson’s disease. Brain Res. 1998;806(2):271–273. | |
Carmine A, Buervenich S, Sydow O, Anvret M, Olson L. Further evidence for an association of the paraoxonase 1 (PON1) Met-54 allele with Parkinson’s disease. Mov Disord. 2002;17(4):764–766. | |
Belin AC, Ran C, Anvret A, et al. Association of a protective paraoxonase 1 (PON1) polymorphism in Parkinson’s disease. Neurosci Lett. 2012;522(1):30–35. | |
Lee PC, Rhodes SL, Sinsheimer JS, Bronstein J, Ritz B. Functional paraoxonase 1 variants modify the risk of Parkinson’s disease due to organophosphate exposure. Environ Int. 2013;56:42–47. | |
Wehr H, Bednarska–Makaruk M, Graban A, et al. Paraoxonase activity and dementia. J Neurol Sci. 2009;283(1–2):107–108. | |
Zengi O, Karakas A, Ergun U, Senes M, Inan L, Yucel D. Urinary 8-hydroxy-2′-deoxyguanosine level and plasma paraoxonase 1 activity with Alzheimer’s disease. Clin Chem Lab Med. 2011;50(3):529–534. | |
Jamroz-Wisniewska A, Beltowski J, Stelmasiak Z, Bartosik-Psujek H. Paraoxonase 1 activity in different types of multiple sclerosis. Mult Scler. 2009;15(3):399–402. | |
Nguyen SD, Hung ND, Cheon-Ho P, Ree KM, Dai-Eun S. Oxidative inactivation of lactonase activity of purified human paraoxonase 1 (PON1). Biochim Biophys Acta. 2009;1790(3):155–160. | |
Thornberry NA, Lazebnik Y. Caspases: enemies within. Science. 1998;281(5381):1312–1316. | |
Budihardjo I, Oliver H, Lutter M, Luo X, Wang X. Biochemical pathways of caspase activation during apoptosis. Annu Rev Cell Dev Biol. 1999;15:269–290. | |
Yuan J, Yankner BA. Apoptosis in the nervous system. Nature. 2000;407(6805):802–809. | |
Wang X, Qin ZH, Leng Y, et al. Prostaglandin A1 inhibits rotenone-induced apoptosis in SH-SY5Y cells. J Neurochem. 2002;83(5):1094–1102. | |
Ahmadi FA, Linseman DA, Grammatopoulos TN, et al. The pesticide rotenone induces caspase-3-mediated apoptosis in ventral mesencephalic dopaminergic neurons. J Neurochem. 2003;87(4):914–921. | |
Hartmann A, Hunot S, Michel PP, et al. Caspase-3: A vulnerability factor and final effector in apoptotic death of dopaminergic neurons in Parkinson’s disease. Proc Natl Acad Sci U S A. 2000;97(6):2875–2880. | |
Tatton NA. Increased caspase 3 and Bax immunoreactivity accompany nuclear GAPDH translocation and neuronal apoptosis in Parkinson’s disease. Exp Neurol. 2000;166(1):29–43. | |
Shimizu S, Narita M, Tsujimoto Y. Bcl-2 family proteins regulate the release of apoptogenic cytochrome c by the mitochondrial channel VDAC. Nature. 1999;399(6735):483–487. | |
Zhai D, Jin C, Huang Z, Satterthwait AC, Reed JC. Differential regulation of Bax and Bak by anti-apoptotic Bcl-2 family proteins Bcl-B and Mcl-1. J Biol Chem. 2008;283(15):9580–9586. | |
Susnow N, Zeng L, Margineantu D, Hockenbery DM. Bcl-2 family proteins as regulators of oxidative stress. Semin Cancer Biol. 2009;19(1):42–49. | |
Hochman A, Sternin H, Gorodin S, et al. Enhanced oxidative stress and altered antioxidants in brains of Bcl-2-deficient mice. J Neurochem. 1998;71(2):741–748. | |
Amstad PA, Liu H, Ichimiya M, et al. BCL-2 is involved in preventing oxidant-induced cell death and in decreasing oxygen radical production. Redox Rep. 2001;6(6):351–362. | |
Longoni B, Boschi E, Demontis GC, Marchiafava PL, Mosca F. Regulation of Bcl-2 protein expression during oxidative stress in neuronal and in endothelial cells. Biochem Biophys Res Commun. 1999;260(2):522–526. | |
Mennicken F, Maki R, de Souza EB, Quirion R. Chemokines and chemokine receptors in the CNS: a possible role in neuroinflammation and patterning. Trends Pharmacol Sci. 1999;20(2):73–78. | |
Sozzani S, Locati M, Zhou D, et al. Receptors, signal transduction, and spectrum of action of monocyte chemotactic protein-1 and related chemokines. J Leukoc Biol. 1995;57(5):788–794. | |
Orlikowski D, Chazaud B, Plonquet A, et al. Monocyte chemoattractant protein 1 and chemokine receptor CCR2 productions in Guillain-Barré syndrome and experimental autoimmune neuritis. J Neuroimmunol. 2003;134(1–2):118–127. | |
Thompson WL, Karpus WJ, Van Eldik LJ. MCP-1-deficient mice show reduced neuroinflammatory responses and increased peripheral inflammatory responses to peripheral endotoxin insult. J Neuroinflammation. 2008;5:35. | |
Yang G, Meng Y, Li W, et al. Neuronal MCP-1 mediates microglia recruitment and neurodegeneration induced by the mild impairment of oxidative metabolism. Brain Pathol. 2011;21(3):279–297. | |
Everitt BJ, Robbins TW. Central cholinergic systems and cognition. Annu Rev Psychol. 1997;48:649–684. | |
Aosaki T, Miura M, Suzuki T, Nishimura K, Masuda M. Acetylcholine-dopamine balance hypothesis in the striatum: an update. Geriatr Gerontol Int. 2010;10 Suppl 1:S148–S157. | |
Fox SH. Non-dopaminergic treatments for motor control in Parkinson’s disease. Drugs. 2013;73(13):1405–1415. | |
Ullrich C, Humpel C. Rotenone induces cell death of cholinergic neurons in an organotypic co-culture brain slice model. Neurochem Res. 2009;34(12):2147–2153. | |
McCoy MK, Tansey MG. TNF signaling inhibition in the CNS: implications for normal brain function and neurodegenerative disease. J Neuroinflammation. 2008;5:45. | |
Mogi M, Togari A, Tanaka K, Ogawa N, Ichinose H, Nagatsu T. Increase in level of tumor necrosis factor (TNF)-alpha in 6-hydroxydopamine-lesioned striatum in rats without influence of systemic L-DOPA on the TNF-alpha induction. Neurosci Lett. 1999;268(2):101–104. | |
Sriram K, Matheson JM, Benkovic SA, Miller DB, Luster MI, O’Callaghan JP. Mice deficient in TNF receptors are protected against dopaminergic neurotoxicity: implications for Parkinson’s disease. FASEB J. 2002;16(11):1474–1476. | |
De Lella Ezcurra AL, Chertoff M, Ferrari C, Graciarena M, Pitossi F. Chronic expression of low levels of tumor necrosis factor-alpha in the substantia nigra elicits progressive neurodegeneration, delayed motor symptoms and microglia/macrophage activation. Neurobiol Dis. 2010;37(3):630–640. |
 © 2014 The Author(s). This work is published and licensed by Dove Medical Press Limited. The full terms of this license are available at https://www.dovepress.com/terms.php and incorporate the Creative Commons Attribution - Non Commercial (unported, v3.0) License.
By accessing the work you hereby accept the Terms. Non-commercial uses of the work are permitted without any further permission from Dove Medical Press Limited, provided the work is properly attributed. For permission for commercial use of this work, please see paragraphs 4.2 and 5 of our Terms.
© 2014 The Author(s). This work is published and licensed by Dove Medical Press Limited. The full terms of this license are available at https://www.dovepress.com/terms.php and incorporate the Creative Commons Attribution - Non Commercial (unported, v3.0) License.
By accessing the work you hereby accept the Terms. Non-commercial uses of the work are permitted without any further permission from Dove Medical Press Limited, provided the work is properly attributed. For permission for commercial use of this work, please see paragraphs 4.2 and 5 of our Terms.