")
Back to Journals » International Journal of Nanomedicine » Volume 10 » Issue 1
Carcinogenic activity of PbS quantum dots screened using exosomal biomarkers secreted from HEK293 cells
Authors Kim J , Kim H, Lee B, Choi ES, In S, Kim E
Received 30 May 2015
Accepted for publication 8 July 2015
Published 31 August 2015 Volume 2015:10(1) Pages 5513—5528
DOI https://doi.org/10.2147/IJN.S89593
Checked for plagiarism Yes
Review by Single anonymous peer review
Peer reviewer comments 2
Editor who approved publication: Dr Thomas Webster
Jung-Hee Kim,1 Hye-Rim Kim,2 Bo-Ram Lee,1 Eun-Sook Choi,1 Su-Il In,2 Eunjoo Kim1
1Division of Nano and Energy Convergence Research, 2Department of Energy Systems Engineering, DGIST, Daegu, Republic of Korea
Abstract: Lead sulfide (PbS) quantum dots (QDs) have been applied in the biomedical area because they offer an excellent platform for theragnostic applications. In order to comprehensively evaluate the biocompatibility of PbS QDs in human cells, we analyzed the exosomes secreted from cells because exosomes are released during cellular stress to convey signals to other cells and serve as a reservoir of enriched biomarkers. PbS QDs were synthesized and coated with 3-mercaptopropionic acid (MPA) to allow the particles to disperse in water. Exosomes were isolated from HEK293 cells treated with PbS–MPA at concentrations of 0 µg/mL, 5 µg/mL, and 50 µg/mL, and the exosomal expression levels of miRNAs and proteins were analyzed. As a result, five miRNAs and two proteins were proposed as specific exosomal biomarkers for the exposure of HEK293 cells to PbS–MPA. Based on the pathway analysis, the molecular signature of the exosomes suggested that PbS–MPA QDs had carcinogenic activity. The comet assay and expression of molecular markers, such as p53, interleukin (IL)-8, and C-X-C motif chemokine 5, indicated that DNA damage occurred in HEK293 cells following PbS–MPA exposure, which supported the carcinogenic activity of the particles. In addition, there was obvious intensification of miRNA expression signals in the exosomes compared with that of the parent cells, which suggested that exosomal biomarkers could be detected more sensitively than those of whole cellular extracts.
Keywords: comet assay, DNA damage, exosome, high-throughput screening, lead sulfide quantum dots (PbS QDs), nanoparticle toxicity
Introduction
Owing to the increased interest in nanomaterial toxicity, studies have been performed to evaluate the pathological effects of nanomaterials on human body. Previous reports have revealed the toxic effects of nanomaterials, such as oxidative stress, inflammation, growth inhibition, and apoptosis. However, high-throughput screening of biomarkers also is required because new nanomaterials with unprecedented structures and functions are constantly being synthesized, resulting in unpredictable toxicological responses.
High-throughput screening approaches, including gene arrays, RNA sequencing, and proteome analysis by two-dimensional (2D) electrophoresis and subsequent matrix assisted laser desorption/ionization time of flight mass spectrometry (MALDI-TOF) analysis, have been applied to identify the biological pathways affected by nanomaterials.1,2 These are efficient tools to identify molecular changes in extracts of whole cells or tissue, but the results include numerous molecular changes and sometimes lead to false-positive or false-negative results.
In most mammalian cells, portions of the plasma membrane are regularly internalized as endosomes, which become exosomes when they merge with the cell membrane and subsequently, are released into the extracellular space. The secreted exosomes can be transferred from one cell to another via membrane vesicle trafficking and may function in cell-to-cell signaling to affect signal transduction in recipient cells.3–5 RNAs, proteins, lipids, and metabolites in exosomes reflect the physiological status of their cells of origin, suggesting that they can serve as reservoirs of enriched biomarkers to predict the progress of pathological conditions.6–9
Therefore, we propose that the analysis of exosomal content following exposure to nanomaterials can provide insight into their characteristic biological responses and allow us to focus on toxicologically potential molecules during biomarker screening. Because exosomes are present in the cell culture medium of primary cells and cell lines, as well as in various biological fluids such as blood and urine, exosome-based biomarker characterization could be applied to in vitro screening of nanomaterial toxicity.
Lead sulfide (PbS) has been used in recent years to study the quantum size effect by analysis of its structural, optical, and electrical properties.10,11 PbS quantum dots (QDs), with diameters <10 nm and emission wavelengths in the near-infrared region, have been proposed as materials that could be applied in biomedical detection approaches.12 However, QDs can transfer energy to nearby oxygen molecules, which could induce reactive oxygen species generation, and thus lead to inflammation or carcinogenesis.13 Therefore, biosafety concern is an important issue in approaches using ultra-small QDs instead of organic dyes for cancer imaging and intracellular diagnostics.14 Reports have demonstrated that PbS QDs are toxic to fishes15 and rat neurons;12 however, the responses of human cells to PbS QDs have not been evaluated comprehensively.
In this study, PbS QDs modified by 3-mercaptopropionic acid (MPA) were synthesized, and their toxic effects on HEK293 cells were evaluated by utilizing an exosome-based screening approach. The exosomal miRNA and proteins significantly altered by PbS–MPA QDs were proposed as specific biomarkers, which were used to predict related biological processes that might have been affected by the treatment. The effects of PbS–MPA QDs on signaling in HEK293 cells were confirmed by cellular and molecular assays. In addition, the intensification of biomarker expression signals in exosomes in comparison with the parent cells was analyzed to verify the increased sensitivity of the exosome-based biomarker screening method.
Materials and methods
Preparation of PbS and PbS–MPA QDs
Moody et al16 have previously reported this procedure. Briefly, a solution containing 0.45 g of PbO (2.016 mmol), 1.5 mL of oleic acid (4.75 mmol), 0.165 mL of oleyl amine (0.502 mmol), and 18 mL of 1-octadecene was degassed in a 100-mL three-neck flask at room temperature for 24 hours under vacuum. Then, the solution was heated to 120°C under an argon atmosphere and was maintained at this temperature for 5 minutes until the solution color became clear. Another solution containing 10 mL of 1-octadecene was degassed in a 100-mL three-neck flask at 80°C for 16 hours under vacuum. After the degassing process, 0.213 mL of bis(trimethylsilyl) sulfide was added to this solution, and the solution was cooled to ambient temperature. The two solutions were then mixed using a glass syringe, and the combined solution was cooled to ambient temperature. The product was purified with acetone via two rounds of centrifugation at 10,000× g for 10 minutes each and stored in toluene.
PbS–MPA QDs dispersed in water were prepared by the exchange of oleic acid with MPA, a conventional water dispersant for nanoparticles.17 Briefly, 0.5 g of QD sample was washed and precipitated thrice with a solution of 50:50 methanol:acetone and dissolved in 12 mL of chloroform containing 0.25 g of MPA. This solution was stirred under nitrogen for 24 hours. The solution was then centrifuged to separate the hydrophilic nanoparticles and washed thrice in hexane. Excess organic solvent was removed from the dry product using vacuum and, subsequently, dispersed in phosphate-buffered saline (PBS).
Property analysis of synthesized PbS QDs and PbS–MPA QDs
The morphology of the synthesized particles was analyzed using transmission electron microscopy ([TEM]; HF-3300, Hitachi, Tokyo, Japan) at an acceleration voltage of 300 kV. For TEM analysis, samples were dispersed in toluene, and a drop of this suspension was deposited on an amorphous carbon film copper grid at ambient air. The average particle size was determined by image analysis. The elemental analysis of the synthesized particles was performed by powder X-ray diffraction (XRD; Empyrean, PANalytical, Almelo, the Netherlands) using Cu K-alpha radiation at a generator voltage of 40 kV and a tube current of 30 mA.
After MPA treatment, the particles were reanalyzed using TEM, and the mean diameter of the MPA-coated particles dispersed in PBS was determined by dynamic light scattering ([DLS]; ZetaSizer NanoZS, Malvern Instrument, Malvern, UK). Fourier transform infrared (FT-IR) spectra were obtained using Nicolet iS10 (Thermo Fisher Scientific, Waltham, MA, USA). All spectra were averaged across 512 scans and reported in transmission mode relative to a clean gold surface.
Cell culture
HEK293 cells (ATCC® CRL-1573™; American Type Culture Collection, Manassas, VA, USA) and TCMK-1 cells (ATCC CCL-139™) were grown in minimum essential medium (MEM) (Thermo Fisher Scientific) supplemented with 10% fetal bovine serum (FBS) (Thermo Fisher Scientific). THP-1 cells (ATCC TIB-202™) were grown in RPMI-1640 medium (Thermo Fisher Scientific) supplemented with 10% FBS. AML12 cells (ATCC CRL-2254™) were grown in Ham’s F-12K medium (Thermo Fisher Scientific) supplemented with 10% FBS. The cells were maintained at 37°C and 5% CO2 in a humidified incubator, and the medium was changed every other day.
Cytotoxicity of PbS–MPA
To determine the cytotoxicity of PbS–MPA QDs, cells were seeded at a density of 1×10³ cells/well in 96-well plates in 100 μL medium and incubated for 24 hours. The cells were then incubated with fresh medium containing PbS–MPA particles at the intended concentrations (0–400 μg/mL) for 48 hours. Cells cultured in an equal volume of vehicle (PBS) were used as a control. To measure the cytotoxicity, the Cell Counting Kit-8 (CCK-8; Enzo Life Science, Farmingdale, NY, USA) was used in accordance with the manufacturer’s instructions. Briefly, 10 μL of CCK-8 reagent was added into each well, and the plate was incubated at 37°C for 2 hours. The absorbance was detected at 450 nm using a Multiskan microplate reader (Thermo Fisher Scientific). The cytotoxicity was expressed as the percent cell viability relative to the viability of the control cells. All experiments were performed in triplicate, and the half-maximal inhibitory concentration (IC50) for growth inhibition was calculated using Sigma Plot version 12.3 (Systat Software, Inc., San Jose, CA, USA).
Isolation and characterization of exosomes secreted from PbS–MPA QD-exposed HEK293 cells
The exosomes were isolated using ExoQuick-TC™ (System Bioscience, Mountain View, CA, USA), according to the manufacturer’s instructions. Briefly, 10 mL of HEK293 culture media was collected after 0 μg/mL, 5 μg/mL, and 50 μg/mL PbS–MPA treatment and centrifuged at 3,000× g for 15 minutes to remove cells and cell debris. The supernatant was transferred to a sterile tube and 2 mL of ExoQuick-TC was added. The ExoQuick-TC/biofluid mixture was refrigerated overnight and then centrifuged at 1,500× g for 30 minutes. After centrifugation, the exosome pellet at the bottom of the tube was resuspended in 500 μL of PBS and used for further analysis.
The isolated exosomes were observed by TEM (Tecani™ G2 Spirit; FEI Company, Hillsboro, OR, USA) to identify the shape and the extent of dispersion. Prior to observation with bio-TEM, the samples were stained with methanolic uranyl acetate and lead citrate.18 The particle size distribution was analyzed by DLS.
Quantitative polymerase chain reaction analysis of exosomal and cellular miRNAs
The isolated exosomes and parent cells exposed to 0 μg/mL, 5 μg/mL, and 50 μg/mL PbS–MPA were used for miRNA analysis. Small RNA isolation, poly-A tailing, and cDNA synthesis were performed using the SeraMir™ RNA Amplification Kit (System Bioscience). To normalize the sample-to-sample variation, control miRNA provided by the manufacturer was spiked into each sample, and after this step, the RNA Amplification Kit protocol was followed in accordance with the manufacturer’s instructions. Small RNA concentrations were verified using an Agilent 2100 bioanalyzer (Agilent Technologies, Santa Clara, CA, USA), and 10 ng of small RNA was used for cDNA synthesis. The synthesized cDNA was diluted to 1:10, and 1 μL of cDNA was used in each quantitative polymerase chain reaction (qPCR) reaction. The global expression profiling of exosomal miRNAs was performed according to manufacturer’s instructions using 380 miRNA-specific primers that were obtained from the human exosomal miRNA profiling kit (Cat# RA820TC-1; System Bioscience) in combination with a universal reverse primer. qPCR was carried out in an ABI7900HT Real-Time PCR System (Thermo Fisher Scientific). Samples from three independent experiments were analyzed. The comparative threshold cycle (Ct) method was used to quantify the expression levels. The expression level (2−ΔCt) was determined by normalization to the control miRNA, and fold changes in expression from treated samples to untreated samples were calculated with the 2−ΔΔCt method.19
Exosomal proteome analysis
The isolated exosomes from 0 μg/mL, 5 μg/mL, and 50 μg/mL PbS–MPA were used for proteome analysis. Exosomes isolated from three independent experiments were pooled into one sample. The pooled exosomes were lysed with a solution containing 7 M urea, 2 M thiourea containing 4% (w/v) 3-[(3-cholamidopropy)dimethyammonio]-1-propanesulfonate, 1% (w/v) dithiothreitol and 2% (v/v) pharmalyte, and 1 mM benzamidine. Proteins were extracted for 1 hour at room temperature with vortexing. After centrifugation at 15,000× g for 1 hour at 15°C, the soluble fraction obtained was used for 2D sodium dodecyl sulfate-polyacrylamide gel electrophoresis (SDS-PAGE). Isoelectric focusing was performed using immobilized pH gradient dry strips (24 cm, Genomine, Pohang, Korea) loaded with 30 μg of proteins with a Multiphor II electrophoresis unit (Amersham Bioscience, Piscataway, NJ, USA) according to the manufacturer’s instruction. Subsequently, gels were silver stained as described previously.20 Quantitative analysis of digitized images was carried out using PDQuest Ver. 7.0 software (Bio-Rad Laboratories Inc., Hercules, CA, USA). Protein spots that met the selection criteria were excised from the gels, digested with trypsin, and subjected to MALDI-TOF analysis (Microflex LRF 20; Bruker, Billerica, MA, USA).21 The search program MASCOT, developed by Matrixscience (http://www.matrixscience.com/), was used for protein identification by peptide map fingerprint (PMF). Spectra were calibrated with trypsin autodigestion ion peaks m/z (842.510 and 2,211.1046) as the internal standard.
Cellular and exosomal protein expression analysis by Western blotting
To identify the protein expression by Western blotting, the exosome and cell pellets were resuspended in 200 μL RIPA buffer (Sigma-Aldrich Co., St Louis, MO, USA) with protease inhibitor cocktail (Sigma-Aldrich) and incubated at room temperature for 5 minutes to allow complete lysis of exosomes. Next, Laemmli buffer (4% SDS, 20% glycerol, 10% 2-mercaptoethanol, 0.004% bromophenol blue, 0.125 M Tris–HCl, pH 6.8) with β-mercaptoethanol was added, and SDS-PAGE was performed following the procedure described by Laemmli.22 The proteins separated by SDS-PAGE were transferred to a polyvinylidene difluoride membrane using a transfer apparatus according to the manufacturer’s protocols (Bio-Rad Laboratories Inc.). After incubation with 5% nonfat milk in tris-buffered saline and tween 20 (TBST) (10 mM Tris, pH 8.0, 150 mM NaCl, 0.5% Tween 20) for 60 minutes, the membrane was washed once with TBST and incubated with antibodies against target proteins at 4°C for 12 hours. Membranes were washed thrice for 10 minutes and incubated with a 1:3,000 dilution of horseradish peroxidase-conjugated anti-rabbit antibodies for 2 hours. Blots were washed with TBST thrice and developed with the ECL system (Amersham Biosciences) according to the manufacturer’s protocols.
For CD63 and CD9 expression analysis, rabbit anti-human CD63 and CD9 antibodies (1:1,000) were used (ExoAb Antibody Sampler Kit, System Bioscience). To measure leucine-rich repeat-containing protein 23 (LRRC23) and keratin 5 (KRT5) expression levels in exosomes and parent cells, rabbit anti-human LRRC23 and anti-human KRT5 antibodies (1:1,000) (Abcam, Cambridge, UK) were used. The exosomal and cellular protein expression levels were normalized to CD9 and β-actin expression, respectively. The fold changes for upregulated samples were determined by the ratio of the expression levels for treated to control samples. In the case of downregulated samples, the fold changes were determined by the ratio of the control to treated samples and expressed as negative values.
Samples from three independent experiments were used in this analysis. The relative expression level was determined using an image analyzer (UN-SCAN-IT Ver. 6.1; Silk Scientific Corporation, Orem, UT, USA).
Analysis of DNA damage activity by comet assay
HEK293 cells were plated at a density of 2×10⁵ cells/well in six-well dishes. After treatment with 0 μg/mL, 5 μg/mL, and 50 μg/mL PbS–MPA QDs for 48 hours, cells were trypsinized and analyzed using the Comet SCGE assay kit (Enzo Life Science) according to the manufacturer’s instructions. Briefly, cells were embedded in agarose on a glass slide. Cells were maintained in lysis buffer (2.5 M NaCl, 0.1 M EDTA, 10 mM Tris, 1% sodium lauryl sarcosinate, and 1% (v/v) Triton X-100) for 1 hour at 4°C. Slides were then incubated with alkaline electrophoresis buffer (10 M NaOH and 200 mM EDTA) for 60 minutes to allow the DNA to unwind. Subsequently, electrophoresis was carried out for 30 minutes at 300 mA. Next, the slide was immersed in 70% ethanol for 5 minutes, air dried, and stained with Hoechst dye (Enzo Life Science). For quantification, comets on each gel were observed using a fluorescence microscope (Leica Microsystems, Wetzlar, Germany) and classified according to the relative intensity and shape of fluorescence.
qPCR for cellular mRNAs
RNA extraction was performed using TRIzol reagent (Thermo Fisher Scientific). RNA cleanup was performed using the RNeasy Mini Kit 50 (Qiagen NV, Venlo, the Netherlands). cDNA synthesis was performed at 37°C for 60 minutes with 100 ng RNA using random hexamer primers and virus reverse transcriptase (GibcoBRL, Karlsruhe, Germany). qPCR was performed using the LightCycler-DNA Master SYBR Green I Kit (Hoffman-La Roche Ltd., Basel, Switzerland) according to the manufacturer’s instructions with an ABI7900HT Real-Time PCR System (Thermo Fisher Scientific). Measurement of gene expression was performed for target genes using human-specific primers purchased from Exiqon (Vedbaek, Denmark). The relative quantity of the target mRNA was normalized to an endogenous gene (glyceraldehyde 3-phosphate dehydrogenase). The fold changes in RNA expression were calculated using the 2−ΔΔCt method.
Statistical analysis
To select differentially expressed miRNAs, a P-value of <0.05 for expression level and a fold change of >3 in samples treated with 50 μg/mL were defined as the selection criteria. For all experiments, data from three independent experiments were analyzed using the Student’s t-test and are reported as mean ± standard deviation. Sigma Plot version 12.3 was used (Systat Software, Inc.) to determine the P-values, and a P-value <0.05 was considered statistically significant.
Results
Properties of the synthesized PbS and PbS–MPA QDs
Figure 1 shows the physicochemical properties of the synthesized PbS and PbS–MPA QDs. Based on the TEM images shown in Figure 1A, the PbS QDs were extremely monodispersed in size and shape, and the particle size was determined to be 2.15 nm (n=92) by image analysis (Figure 1B). XRD analysis of the PbS QDs showed that the synthesized particles were composed of PbS compounds (JCPDS 03-065-0692 and ICCD-5-592) (Figure 1C).23 For biological tests of the PbS QDs synthesized in this study, the hydrophobic particle surface was exchanged with MPA to allow the particles to disperse in water. After the particles were coated, the TEM images showed particle agglomeration (Figure 1D). The hydrodynamic diameter was determined to be 223±11 nm via DLS analysis (Figure 1E). The aggregation of the PbS–MPA QDs was attributed to the negative charge (−8.43±4.89 mV zeta potential) of the MPA on the particle surface. It has been reported that small molecules carrying a net charge, such as MPA, tend to contribute to aggregation of QDs in buffers, resulting in increased hydrodynamic diameter.24
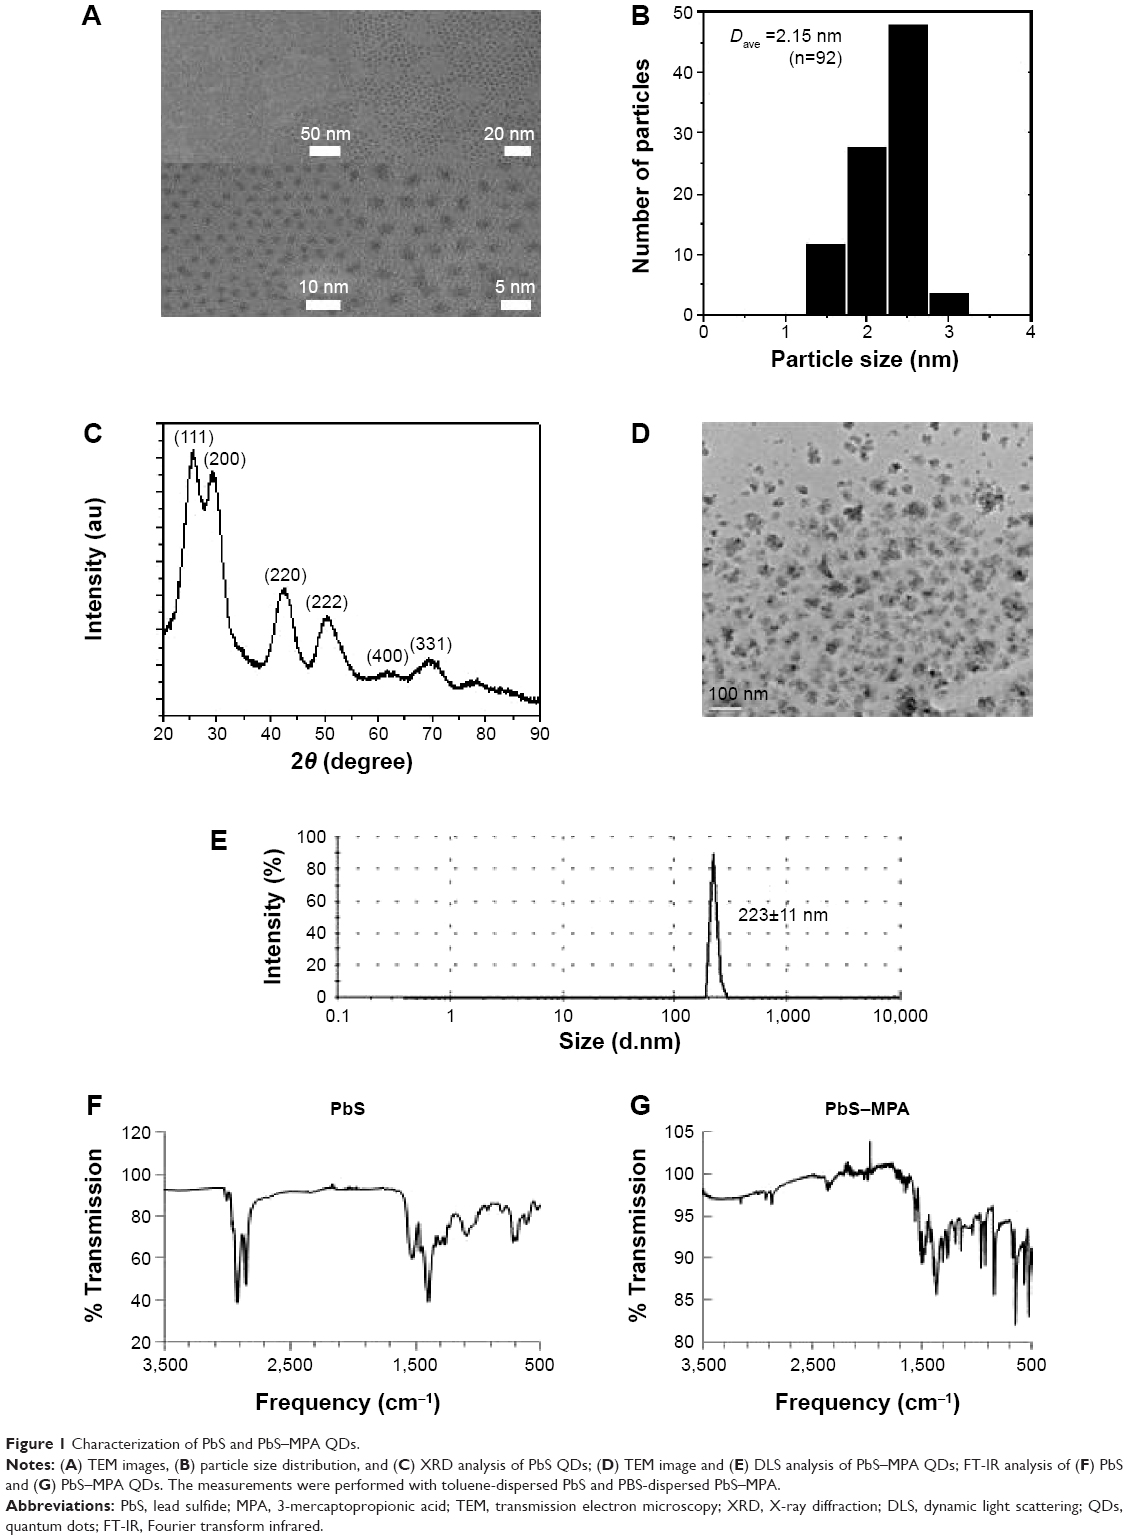 | Figure 1 Characterization of PbS and PbS–MPA QDs. |
Immobilization of MPA on the PbS QDs was confirmed by FT-IR analysis. As shown in Figure 1F, the conventional spectrum of the PbS QDs was similar to that reported in a previous study.25 Ligand exchange from oleic acid to MPA on the PbS QD surface was clearly observed (Figure 1G). After MPA treatment, the intensities of the peaks for C–H stretching vibrations (2,924 cm−1 and 2,857 cm−1) were decreased dramatically due to the removal of 1-oleic acid, which has a long hydrocarbon chain, from the surface of the prepared PbS QDs and its replacement with MPA, which has a short hydrocarbon chain. The –SH moiety signal was not detectable by FT-IR. Similar FT-IR analysis results have been reported previously using QDs with surfaces modified by MPA.26
Cytotoxicity of PbS–MPA
Following exposure of HEK293 cells to 2 μg/mL, 6 μg/mL, 25 μg/mL, 100 μg/mL, and 400 μg/mL PbS–MPA, cell proliferation was decreased to 97%, 85%, 63%, 38%, and 38%, respectively, compared with that of the control cells (Figure 2A). The IC50 of PbS–MPA was 43 μg/mL. The cytotoxicity for human monocytic THP-1 cells was tested to provide data for toxicity in circulating cells in human bloodstream. For comparison, cell proliferation following exposure of mouse TCMK-1 and AML12 cells to PbS–MPA was also measured. PbS–MPA was cytotoxic to TCMK-1 and THP-1 cells at a concentration of 150 μg/mL (Figure 2B). The IC50 values of PbS–MPA in TCMK-1 and THP-1 cells were 127 μg/mL and 132 μg/mL, respectively. In contrast to the human-originated cells, the AML12 mouse cell line was not affected by PbS–MPA QDs at concentrations as high as 150 μg/mL (Figure 2B).
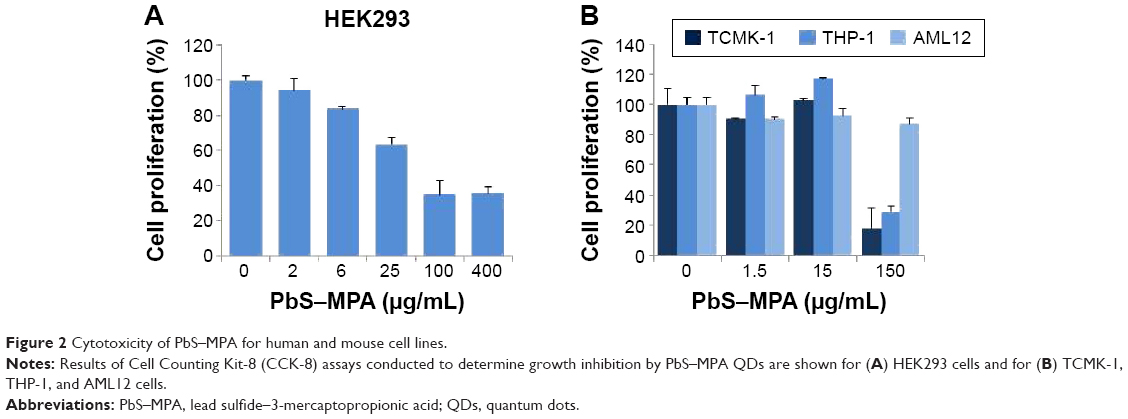 | Figure 2 Cytotoxicity of PbS–MPA for human and mouse cell lines. |
The PbS–MPA QDs prepared in this study induced severe cytotoxic responses in HEK293 cells compared to those reported in several previous studies using PbS nanoparticles, although the results could not be compared directly due to the divergent physicochemical properties of the tested particles and differences in test methods. The IC50 value of PbS nanodendrite in Saccharomyces cerevisiae was 708 μg/mL.27 In embryonic zebrafish, 3-mercaptopropanesulfonate coated PbS nanoparticles caused 20% cell mortality at a concentration of 10 μg/mL and 100% cell mortality at a concentration of 160 μg/mL.15 The mortality of Panc-1 cells treated with PEGylated phospholipid micelle-encapsulated PbS QDs at a concentration of 250 μg/mL was 20% of that of control cells.12
Isolation and characterization of exosomes secreted from HEK293 cells
Exosomes were isolated from the culture media of HEK293 cells after they were exposed to PbS–MPA QDs at concentrations of 0 μg/mL, 5 μg/mL, and 50 μg/mL. The isolated exosomes were analyzed by TEM in order to study their morphology. The majority of the exosomes were observed in nanosized vesicles (Figure 3A). The image analysis indicated that the size distribution of the nanosized vesicles was nearly monodispersed and determined to be 28±3 nm (n=50). However, DLS provided a relative size distribution of the particles between 10 nm and 500 nm, and the hydrodynamic diameter was determined to be 109±84 nm (Figure 3B). A strong peak at 109 nm was attributed to exosomes released by the cells, but the smaller particle distribution around 10 nm was attributed to proteins. Peaks in the range of hundreds of nanometers were attributed to microvesicles. This result was comparable to that of a previous report on exosomes secreted from HEK293 cells (average hydrodynamic diameter of 70–80 nm in DLS).28 Western blotting analysis for the representative exosomal biomarkers CD63 and CD929,30 confirmed that the isolated vesicles were enriched in the exosomal fraction.
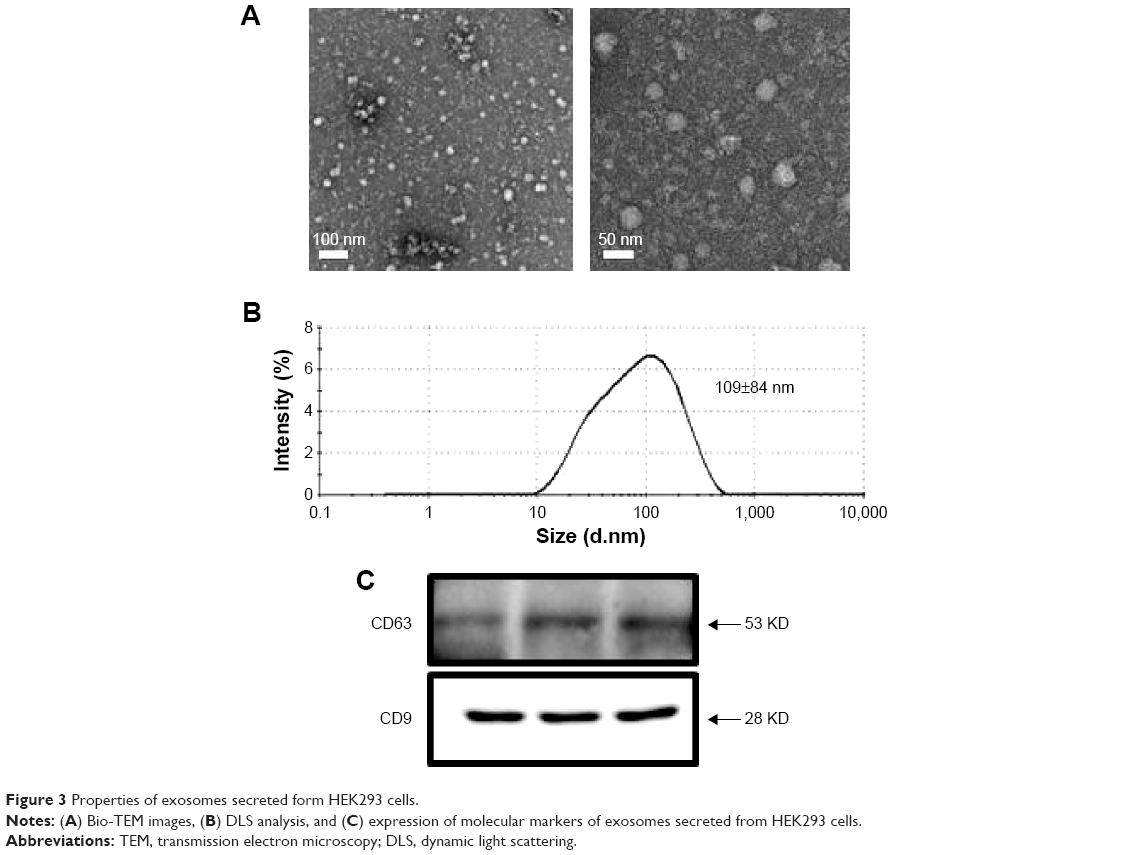 | Figure 3 Properties of exosomes secreted form HEK293 cells. |
miRNA expression in exosomes
To determine specific biomarkers that are up- or downregulated by PbS–MPA QDs, expression levels of 380 human miRNAs frequently found in cells were measured by real-time qPCR analysis, using a human exosomal miRNA profiling kit provided by System Bioscience.31,32
The criteria for biomarker selection were 1) dose dependent increase or decrease following PbS–MPA treatment at 5 μg/mL and 50 μg/mL, 2) a change in expression of at least more than threefold following treatment with 50 μg/mL PbS–MPA QDs (in comparison with the untreated control sample), and 3) a statistically significant change in expression level in comparison with that of control sample (P<0.05). Five miRNAs, hsa-miR-525-5p, hsa-miR-527, hsa-miR-532-3p, hsa-miR-548e, and hsa-miR-199a-5p, met the criteria and were proposed as exosomal biomarkers of exposure of HEK293 cells to PbS–MPA. Figure 4A shows the fold changes of the miRNA biomarkers for PbS–MPA QD exposure. All of the identified miRNA markers were downregulated by PbS–MPA exposure in comparison to the control sample (2−ΔΔCt), with fold changes of 8.3×10⁻⁴–1.6×10⁻¹.
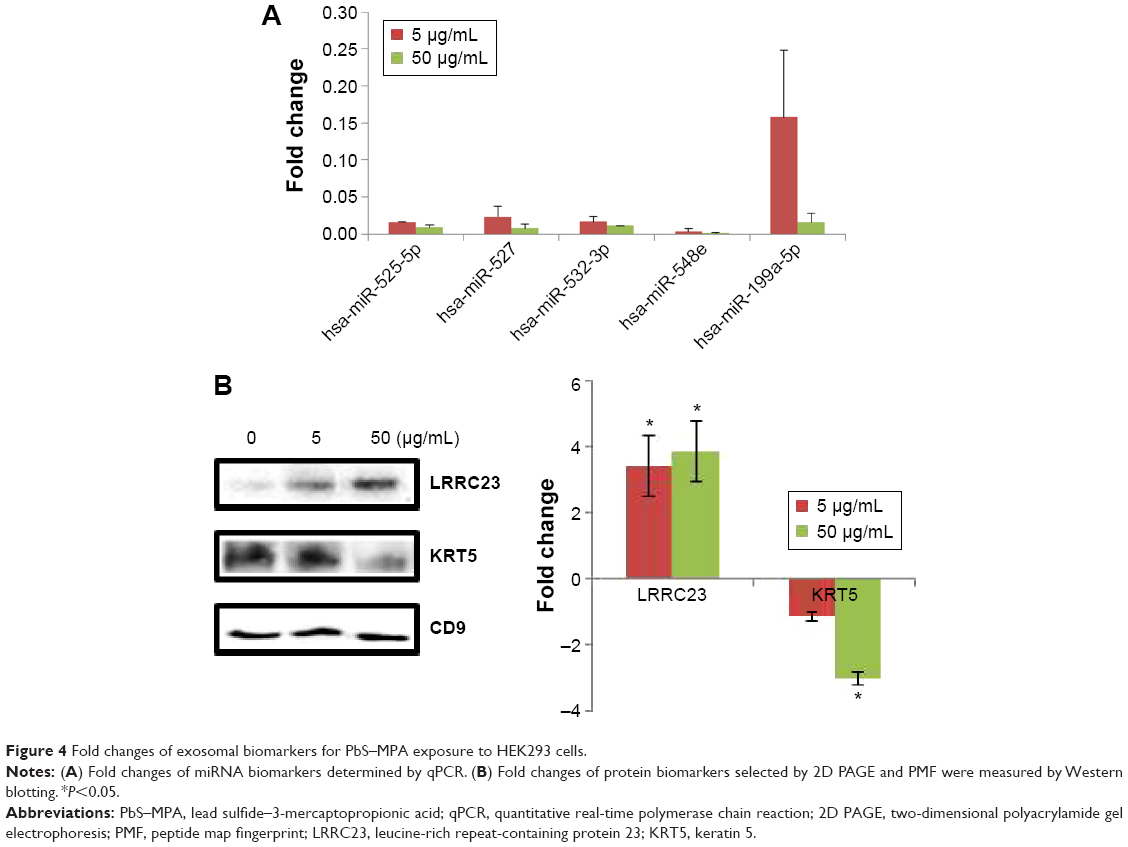 | Figure 4 Fold changes of exosomal biomarkers for PbS–MPA exposure to HEK293 cells. |
To identify comprehensively the pathways and functions that might be affected by changes in the identified biomarkers, the biomarkers were analyzed using Ingenuity Pathway Analysis.33 As shown in Table S1, organismal injury and abnormalities, reproductive system disease, and cancer were identified as the most relevant diseases and disorders for the miRNA biomarkers of PbS–MPA exposure. Based on the pathway analysis, we focused on the carcinogenetic function of the miRNAs decreased owing to PbS–MPA exposure. The representative functions of miRNAs related to carcinogenesis are summarized in Table 1. Most miRNAs proposed as PbS–MPA biomarkers have been reported to suppress expression of target mRNAs, leading to enhancement of cancer progression (miR-525-5p,34 miR-527,35 miR-548e,36 and miR-199a-5p37). It has been shown that miRNAs generally are downregulated in cancer,38 and tumor cells often have reduced levels of mature miRNAs as a consequence of genetic loss, epigenetic silencing, defects in synthesis pathways, or widespread transcriptional repression.39,40 The results indicated that PbS–MPA-exposed cells secreted exosomes with reduced levels of cancer-suppressive miRNAs in the extracellular matrix.
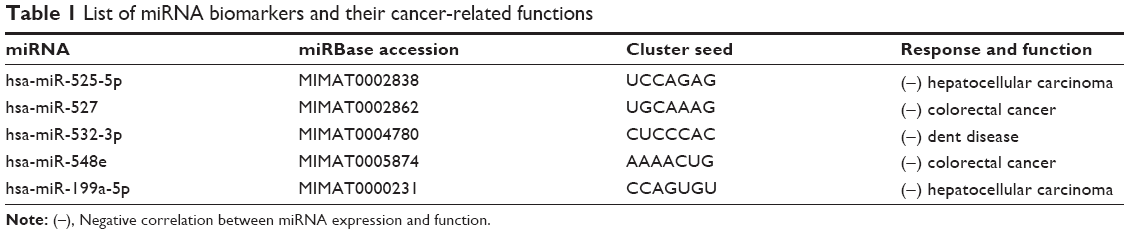 | Table 1 List of miRNA biomarkers and their cancer-related functions |
Proteome analysis in exosomes
The proteomes of the exosomes from the PbS–MPA QD-exposed HEK293 cells were analyzed with MALDI-TOF mass spectrometry following 2D SDS-PAGE. The 2D SDS-PAGE showed that levels of 121 proteins (identified as spots on the gel) were increased or decreased more than twofold in exosomes from cells exposed to 5 μg/mL and 50 μg/mL PbS–MPA QDs. Among these proteins, 29 were selected for MALDI-TOF mass spectrometry analysis to identify the proteins according to the following criteria: 1) concentration-dependent changes following treatment with 5 μg/mL and 50 μg/mL PbS–MPA QDs and 2) changes greater than threefold following treatment with 50 μg/mL PbS–MPA QDs (in comparison with the untreated control sample). Figure S1 shows the 29 spots in the 2D gels, in which 19 proteins showed concentration-dependent increases in expression and ten proteins showed concentration-dependent decreases in expression.
The 29 spots were excised from the gels and analyzed by mass spectroscopy to identify the proteins via PMF. Three proteins were matched with the MASCOT database for the PMF results and identified as leucine-rich repeat-containing protein 23, gi|5901898 (LRRC23), keratin 5, gi|119617038 (KRT5), and albumin-like protein (gi|763431). A separate Western blotting analysis for these proteins to measure LRRC23 (increased expression) and KRT5 (decreased expression) expression in exosomes confirmed the results of the proteome screening by 2D SDS-PAGE and MALDI-TOF (Figure 4B). Therefore, LRRC23 and KRT5 were proposed as exosomal protein biomarkers for PbS–MPA QD exposure. Table 2 lists the known functions of LRRC23 and KRT5 with regard to cancer progression. LRRC23 expression increases in breast cancer,41 and KRT5 has been reported as a biomarker for various cancer types, including lung and breast cancers.42,43 Similar to the miRNAs, the protein biomarkers for PbS–MPA QD exposure also were related to carcinogenesis.
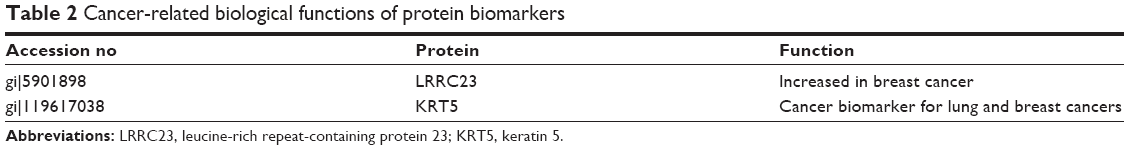 | Table 2 Cancer-related biological functions of protein biomarkers |
DNA damage caused by PbS–MPA QDs in HEK293 cells
Because cellular DNA damage is an indicator of carcinogen exposure,44 the comet assay (single-cell alkaline gel electrophoresis), which measures single- and double-strand breaks of DNA, was performed to support carcinogenic activity.45–47 The intensity of the comet tail relative to the head reflects the number of DNA breaks in a particular cell.48
Long comet tails extending toward the anode were observed for cells exposed to 5 μg/mL PbS–MPA QDs, which was attributed to DNA strand breakage and loss of supercoiled structure (Figure 5A). Positive control cells were exposed to ultraviolet irradiation (0.1 J/cm2) for 10 minutes to induce DNA damage. The cells exposed to 50 μg/mL PbS–MPA QDs showed a level of DNA damage similar to that of the positive control cells, as indicated by DNA adduct smears that surrounded the cells. To determine the extent of DNA damage by manual scoring, 50 randomly selected comets from each gel were classified according to the relative intensity of fluorescence in the tail.49 The comet tails were scored from 0 to 3, indicating undamaged (0 value) to maximally damaged (3 value) cells (Figure 5B). As shown in Figure 5C, the average scores increased with the PbS–MPA concentration in treated HEK293 cells.
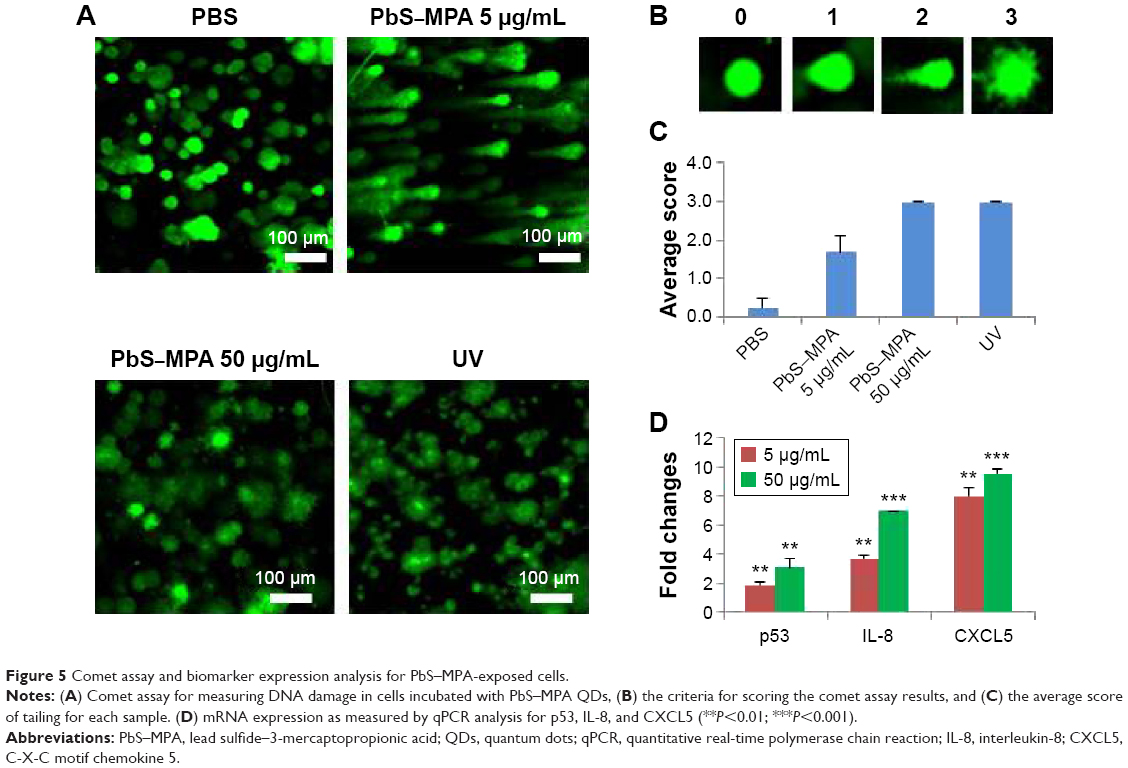 | Figure 5 Comet assay and biomarker expression analysis for PbS–MPA-exposed cells. |
To support the comet assay results, expression of p53, interleukin (IL)-8, and C-X-C motif chemokine 5 (CXCL5) (DNA damage-related biomarkers) were analyzed by qPCR. Pathways involved in DNA damage response can activate p53 for cell cycle arrest, which can be transient or permanent.50 If the p53 damage response pathway fails to protect against DNA damage, cancer progression will occur.51 Therefore, p53 is increased upon DNA damage, and combination of the comet assay with detection of molecular markers, such as p53, offers a comprehensive approach for the assessment of DNA damage in vitro.52
IL-8 expression has been reported to be increased by DNA strand breaks53 and in renal cancer.54 CXCL5 is known to be increased in renal cell carcinoma patients, and this change in CXCL5 expression is accompanied by DNA fragmentation.55,56 In this study, p53, IL-8, and CXCL5 mRNA expression levels in HEK293 cells were increased significantly by PbS–MPA QDs (Figure 5D). These results suggested that PbS–MPA QDs could have carcinogenic activity related to deficient DNA repair, as indicated by the comet assay and molecular expression related to DNA damage.
Signal intensification in exosomal biomarker expression signals
The expression levels of exosomal biomarkers specific to PbS–MPA exposure were analyzed in the parent cell extracts and compared with those of the exosomal extracts to calculate the level of signal intensification that occurred in the exosomes. Cellular levels of hsa-miR-532-3p and hsa-miR-548e were decreased significantly in HEK293 cells exposed to 5 μg/mL and 50 μg/mL PbS–MPA QDs (Figure 6A). However, hsa-miR-525-5p expression was decreased significantly only following exposure to 50 μg/mL PbS–MPA QDs, and hsa-miR-199a-5p expression was not changed significantly following exposure to 5 μg/mL and 50 μg/mL PbS–MPA QDs. miR-527 was not detected in the parent cell extracts, including the control sample. These results indicated that the molecular signatures of the identified biomarkers were exosome specific and, thus, would not be measurable using conventional approaches involving cellular screening. Significant differences in miRNA expression profiles were previously reported between human cancer cells and the secreted exosomes.57
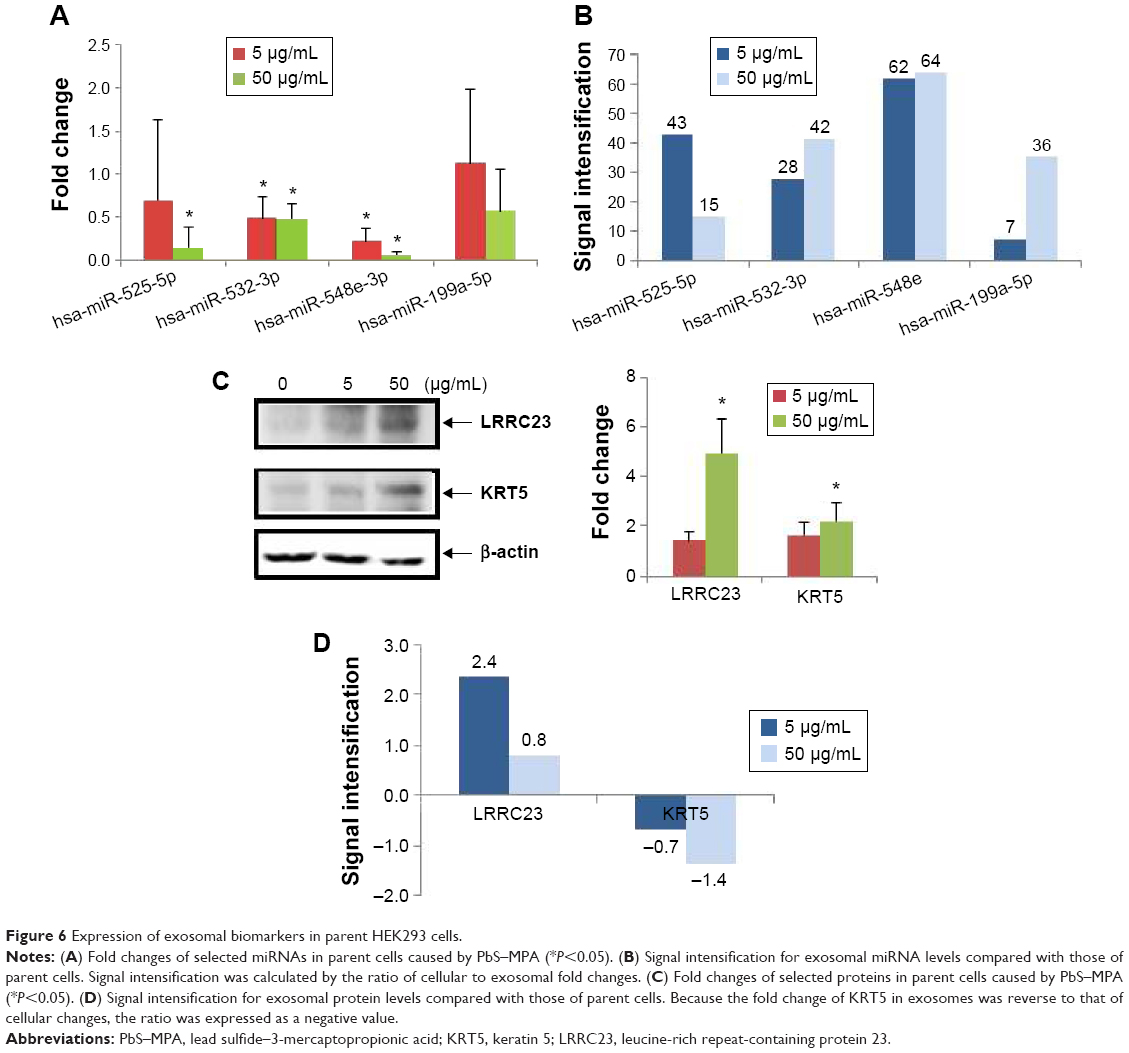 | Figure 6 Expression of exosomal biomarkers in parent HEK293 cells. |
When the fold changes of miRNA expression caused by PbS–MPA QDs in the exosomes and parent cells were compared, the signal intensification was calculated as 7–64-fold (ratio of cellular/exosomal fold changes from the data shown in Figures 4A and 6A) following exposure to 5 μg/mL and 50 μg/mL PbS–MPA (Figure 6B). This result was attributed to the observation that the exosomal fold changes of miRNAs were decreased greater than that of cellular extracts, indicating that the exosomal signal would be more sensitive for detection of toxicological effects by exposure to PbS–MPA QDs.
Figure 6C shows the cellular levels of protein biomarkers. LRRC23 expression in parent cells was similar to its expression in exosomes following exposure to 5 μg/mL and 50 μg/mL PbS–MPA, but KRT5 expression in parent cells was increased by exposure to PbS–MPA QDs, which was opposite to the change in exosomal levels of KRT5 (Figure 4B). KRT5 levels increase in cancerous cells and, thus, it is accepted as a positive biomarker of cancer progression.41 Although KRT5 was selected as a biomarker via exosomal screening, its expression level in exosomes was not positively correlated with its cellular expression level. Previous reports have shown that changes in protein expression levels in exosomes do not always correspond with changes in the expression levels in their parent cells.58 Because of the limited information available on exosome biogenesis and regulation of exosomal composition,59,60 specific mechanisms responsible for differences in biomarker levels could not be explained, but it is known that exosomal content is highly regulated.61 Our results implied that increased KRT5 expression in cells might be required for cellular function, but not for transfer to recipient cells.
Figure 6D shows the signal intensification of protein biomarkers in exosomes compared to their parent cells (ratio of exosomal/cellular fold changes from the data shown in Figures 4B and 6C). The fold change of LRRC23 expression was 2.4 times higher in exosomes following exposure to 5 μg/mL PbS–MPA QDs. The KRT5 showed downregulation in exosomes in contrast to upregulation in parent cells; thus, the signal intensification was expressed in negative values. In considering the absolute value for signal intensification in exosomes, the fold change of KRT5 was 1.4 times higher in exosomes than that of parent cells following exposure to 50 μg/mL PbS–MPA QDs.
Discussion
Lead-based nanoparticle toxicity has been studied widely in recent years because these nanoparticles offer an excellent platform for theragnostic applications via coloading of hydrophobic drugs in the micelle core.62 The purpose of our study was to comprehensively evaluate PbS–MPA-induced toxicity in human cells by means of exosomal biomarkers. In this study, the miRNA and protein expression signatures in exosomes primarily indicated the possibility of carcinogenic activity of the particles, and this finding was supported by single-cell assays for DNA damage and qPCR analysis of molecular markers for deficient DNA repair, including p53, IL-8, and CXCL5.
Several reports have found that nanomaterials induce carcinogenesis. Zinc oxide nanoparticles induced epithelial hyperplasia of terminal bronchioles in rats.63 Multiwalled carbon nanotubes showed mesotheliomagenicity in rats.64 Exposure to single-walled carbon nanotubes has been associated with an increased risk of human lung cancer owing to the effects of chronic exposure on human lung epithelial cells.65 Cobalt nanoparticles increased carcinogenic risk following long-term exposure.66 Based on these previous studies and our results, carcinogenic activity should be given more importance while evaluating nanomaterial toxicity.
Exosomes are thought to be attractive sources to assess biological response induced by exogenous materials, because they are actively released from stressed cells to mediate cell-to-cell communication,8 convey information regarding cellular state,67 are highly stable in biofluids,68 and are enriched with pathological biomarkers.69 For example, metastatic factors are found in exosomes from several types of cancer cells, including human isogenic colorectal cells,69 breast cancer cells,70 and prostate cancer cells.71 Recent studies demonstrate that exosome contents can be important indicators of in vivo pathogenesis.72 Hence, exosomal screening was applied to identify the biological response of HEK293 cells to PbS QD exposure.
An additional advantage of the exosome-based approach in biomarker studies is the intensification of expression signals in comparison with those of parent cells, as shown in Figure 6B. The signal intensification measured by the ratio of fold changes in miRNA expression in cells to exosomes indicated that the exosomal response would be more sensitive than that of whole cells in miRNA screening, because the exosomal fraction is a narrower, but more specific, screening target pool to detect potential biomarkers. Intensification of miRNA expression signals has been reported in several recent studies.73–75 However, the exosomal intensification effect on protein biomarkers was not as significant as its effect on miRNAs in this study. Further study is needed on the mechanism of miRNA and protein compartmentation into exosomes to explain the significant reduction of signal intensification of proteins compared to that of miRNAs.
Conclusion
Toxicological effects of synthesized nanomaterials are important issues to determine where they can be used or not. PbS QDs have prominent potential for biomedical applications; however, the information on their toxicological effects has been limited. In this study, PbS QDs induced changes of molecular markers for carcinogenesis, and DNA damages accordingly. Together, it was proposed that PbS QDs have carcinogenic activity for human kidney cells. These results implied that the toxicity issues should be considered in the development of PbS QDs for biomedical applications.
Based on the biogenic and functional properties of exosomes, the molecular changes in exosomes could provide more significant and effective information on cellular response than those in whole cells. Our results supported this assumption: the proposed pathway induced by PbS QDs based on exosomal biomarkers was identified in the parent cells, and the signal intensification of miRNA expression was inherent to exosomes.
Exosomes are noninvasive biomarkers providing a new paradigm of molecular marker studies, which make possible to monitor the signaling molecules in circulating system by time-series analysis for the same animal or human body. To the best of our knowledge, this is the first in-depth study of exosomal miRNA/protein for toxicological evaluation. It will serve as a starting point to use exosomes for comprehensive screening and prediction of pathological toxicity caused by newly synthesized nanomaterials with various morphology and function.
Acknowledgments
This study was supported in part by the Ministry of Science, ICT, and Future Planning of the Republic of Korea (DGIST Basic Research Fund 15-NB-01 and 15-BD-0404). This research was supported also by the Basic Science Research Program through the National Research Foundation of Korea (NRF) funded by the Ministry of Science, ICT, and Future Planning (NRF-2013R1A1A1008678). We are thankful to the DGIST Center for Core Research Facilities for providing aid with the TEM and XRD experiments. We also are thankful to the Korea Basic Science Institute (KBSI) for providing technical assistance on the operation of Bio-TEM and the Ultra microtome.
Disclosure
The authors report no conflicts of interest in this work.
References
Simon DF, Domingos RF, Hauser C, Hutchins CM, Zerges W, Wilkinson KJ. Transcriptome sequencing (RNA-seq) analysis of the effects of metal nanoparticle exposure on the transcriptome of Chlamydomonas reinhardtii. Appl Environ Microbiol. 2013;79:4774–4785. | ||
Kim E, Chu YC, Han JY, et al. Proteomic analysis of silver nanoparticle toxicity in rat. Toxicol Environ Health Sci. 2010;2:251–262. | ||
Nanbo A, Kawanishi E, Yoshida R, Yoshiyama H. Exosomes derived from epstein-barr virus-infected cells are internalized via caveola-dependent endocytosis and promote phenotypic modulation in target cells. J Virol. 2013;87:10334–10347. | ||
Ghossoub R, Lembo F, Rubio A, et al. Syntenin-ALIX exosome biogenesis and budding into multivesicular bodies are controlled by ARF6 and PLD2. Nat Commun. 2014;5:3477–3488. | ||
Kogure T, Lin WL, Yan IK, Braconi C, Patel T. Intercellular nanovesicle-mediated microRNA transfer: a mechanism of environmental modulation of hepatocellular cancer cell growth. Hepatology. 2011;54:1237–1248. | ||
Conde-Vancells J, Falcon-Perez JM. Isolation of urinary exosomes from animal models to unravel noninvasive disease biomarkers. Methods Mol Biol. 2012;909:321–340. | ||
Keller S, Ridinger J, Rupp AK, Janssen JW, Altevogt P. Body fluid derived exosomes as a novel template for clinical diagnostics. J Transl Med. 2011;9:86–94. | ||
Eldh M, Ekström K, Valadi H, et al. Exosomes communicate protective messages during oxidative stress; possible role of exosomal shuttle RNA. PLoS One. 2010;5:e15353. | ||
Kobayashi M, Salomon C, Tapia J, Illanes SE, Mitchell MD, Rice GE. Ovarian cancer cell invasiveness is associated with discordant exosomal sequestration of Let-7 miRNA and miR-200. J Transl Med. 2014;12:4–15. | ||
Bhunia AK, Samanta PK, Saha S, Kamilya T. Safety concerns towards the biomedical application of PbS nanoparticles: an approach through protein-PbS interaction and corona formation. Appl Phys Lett. 2014;104:123–703. | ||
Bradshaw TD, Junor M, Patanè A, et al. Apoferritin-encapsulated PbS quantum dots significantly inhibit growth of colorectal carcinoma cells. J Mater Chem B. 2013;1:6254–6260. | ||
Hu R, Law WC, Lin G, et al. PEGylated phospholipid micelle-encapsulated near-infrared PbS quantum dots for in vitro and in vivo bioimaging. Theranostics. 2012;2:723–733. | ||
Choi AO, Brown SE, Szyf M, Maysinger D. Quantum dot-induced epigenetic and genotoxic changes in human breast cancer cells. J Mol Med. 2008;86:291–302. | ||
Fang M, Peng CW, Pang DW, Li Y. Quantum dots for cancer research: current status, remaining issues, and future perspectives. Cancer Biol Med. 2012;9:151–163. | ||
Truong L, Moody IS, Stankus DP, Nason JA, Lonergan MC, Tanguay RL. Differential stability of lead sulfide nanoparticles influences biological responses in embryonic zebrafish. Arch Toxicol. 2011;85:787–798. | ||
Moody IS, Stonas AR, Lonergan MC. PbS nanocrystals functionalized with a short-chain, ionic, dithiol ligand. J Phys Chem C. 2008;112:19383–19389. | ||
Murcia MJ, Shaw DL, Long EC, Naumann CA. Fluorescence correlation spectroscopy of CdSe/ZnS quantum dot optical bioimaging probes with ultra-thin biocompatible coatings. Opt Commun. 2008;281:1771–1780. | ||
Zhao FQ, Craig R. Capturing time-resolved changes in molecular structure by negative staining. J Struct Biol. 2003;141:43–52. | ||
Livak KJ, Schmittgen TD. Analysis of relative gene expression data using real-time quantitative PCR and the 22DDCT method. Methods. 2001;25:402–408. | ||
Oakley BR, Kirsch DR, Morris NR. A simplified ultrasensitive silver stain for detecting proteins in polyacrylamide gels. Anal Biochem. 1980;105:361–363. | ||
Shevchenko A, Wilm M, Vorm O, Mann M. Mass spectrometric sequencing of proteins from silver-stained polyacrylamide gels. Anal Chem. 1996;68:850–858. | ||
Laemmli UK. Cleavage of structural proteins during the assembly of the head of bacteriophage T4. Nature. 1970;227:680–685. | ||
Akhtar J, Malik MA, O’Brien P, et al. A greener route to photoelectrochemically active PbS nanoparticles. J Mater Chem. 2010;20:2336–2344. | ||
Zhang Y, Clapp A. Overview of stabilizing ligands for biocompatible quantum dot nanocrystals. Sensors. 2011;11:11036–11055. | ||
Kim S, Im SH, Kang M, et al. Air-stable and efficient inorganic–organic heterojunction solar cells using PbS colloidal quantum dots co-capped by 1-dodecanethiol and oleic acid. Phys Chem Chem Phys. 2012;14:14999–15002. | ||
Fu W, Shi Y, Qiu W, et al. High efficiency hybrid solar cells using post-deposition ligand exchange by monothiols. Phys Chem Chem Phys. 2012;14:12094–12098. | ||
Yu Q, Sun M, Wang Y, Li M, Liu L. The interaction between lead sulfide nano-dendrites and Saccharomyce cerevisiae is involved in nanotoxicity. RSC Adv. 2014;4:20371–20378. | ||
Goda T, Masuno K, Nishida J, et al. A Label-free electrical detection of exosomal microRNAs using microelectrode array. Chem Commun. 2012;48:11942–11944. | ||
Caby MP, Lankar D, Vincendeau-Scherrer C, Raposo G, Bonnerot C. Exosomal-like vesicles are present in human blood plasma. Int Immunol. 2005;17:879–887. | ||
Jørgensen M, Bæk R, Pedersen S, Søndergaard EK, Kristensen SR, Varming K. Extracellular vesicle (EV) array: microarray capturing of exosomes and other extracellular vesicles for multiplexed phenotyping. J Extracell Vesicles. 2013;2:20920–20928. | ||
Suryawanshi S, Vlad AM, Lin HM, et al. Plasma microRNAs as novel biomarkers for endometriosis and endometriosis-associated ovarian cancer. Clin Cancer Res. 2013;19:1213–1224. | ||
Virts EL, Thoman ML. Age-associated changes in miRNA expression profiles in thymopoiesis. Mech Ageing Dev. 2010;131:743–748. | ||
Ingenuity Pathway Analysis. Redwood City: Qiagen; 2014. Available from: www.qiagen.com/ingenuity. Accessed October 3, 2014. | ||
Huang YS, Dai Y, Yu XF, et al. Microarray analysis of microRNA expression in hepatocellular carcinoma and non-tumorous tissues without viral hepatitis. J Gastroenterol Hepatol. 2008;23:87–94. | ||
Slaby O, Svoboda M, Michalek J, Vyzula R. MicroRNAs in colorectal cancer: translation of molecular biology into clinical application. Mol Cancer. 2009;8:102–114. | ||
Lin M, Chen W, Huang J, et al. MicroRNA expression profiles in human colorectal cancers with liver metastases. Oncol Rep. 2011;25:7397–7347. | ||
Lee JM, Heo MJ, Lee CG, Yang YM, Kim SG. Increase of miR-199a-5p by protoporphyrin IX, a photocatalyzer, directly inhibits E2F3, sensitizing mesenchymal tumor cells to anti-cancer agents. Oncotarget. 2015;6:3918–3931. | ||
Jansson MD, Lund AH. MicroRNA and cancer. Mol Oncol. 2012;6:590–610. | ||
Lu J, Getz G, Miska EA, et al. MicroRNA expression profiles classify human cancers. Nature. 2005;435:834–838. | ||
Chang TC, Yu D, Lee YS, et al. Widespread microRNA repression by Myc contributes to tumorigenesis. Nat Genet. 2008;40:43–50. | ||
Adélaïde J, Finetti P, Bekhouche I, et al. Integrated profiling of basal and luminal breast cancers. Cancer Res. 2007;67:11565. | ||
Comin CE, Novelli L, Cavazza A, Rotellini M, Cianchi F, Messerini L. Expression of thrombomodulin, calretinin, cytokeratin 5/6, D2-40 and WT-1 in a series of primary carcinomas of the lung: an immunohistochemical study in comparison with epithelioid pleural mesothelioma. Tumori. 2014;100:559–567. | ||
Houseman EA, Ince TA. Normal cell-type epigenetics and breast cancer classification: a case study of cell mixture-adjusted analysis of DNA methylation data from tumors. Cancer Inform. 2014;13(suppl 4):53–64. | ||
Anderson D, Yu TW, McGregor DB. Comet assay responses as indicators of carcinogen exposure. Mutagenesis. 1998;13:539–555. | ||
Olive PL, Banáth JP. The comet assay: a method to measure DNA damage in individual cells. Nat Protoc. 2006;1:23–29. | ||
Smith TR, Miller MS, Lohman KK, Case LD, Hu JJ. DNA damage and breast cancer risk. Carcinogenesis. 2003;24:883–889. | ||
Moktar A, Ravoori S, Vadhanam MV, Gairola CG, Gupta RC. Cigarette smoke-induced DNA damage and repair detected by the comet assay in HPV-transformed cervical cells. Int J Oncol. 2009;35:1297–1304. | ||
Collins AR. The comet assay for DNA damage and repair. Mol Biotechnol. 2004;26:249–261. | ||
Klagge A, Weidinger C, Krause K, Jessnitzer B, Gutknecht M, Fuhrer D. The role of FOXO3 in DNA damage response in thyrocytes. Endocr Relat Cancer. 2011;18:555–564. | ||
Mombach JCM, Bugs CA, Chaouiya C. Modelling the onset of senescence at the G1/S cell cycle checkpoint. BMC Genomics. 2014;15(suppl 7):S7. | ||
Lakin ND, Jackson SP. Regulation of p53 in response to DNA damage. Oncogene. 1999;18:7644–7655. | ||
Marrot L, Belaïdi JP, Meunier JR. Comet assay combined with p53 detection as a sensitive approach for DNA photoprotection assessment in vitro. Exp Dermatol. 2002;11(suppl 1):33–36. | ||
Marczynski B, Raulf-Heimsoth M, Pesch B, et al. Detection of DNA strand breaks by comet assay in sputum leucocytes of bitumen-exposed workers: a pilot study. Hum Exp Toxicol. 2010;29:721–729. | ||
Bi LK, Zhou N, Liu C, et al. Kidney cancer cells secrete IL-8 to activate Akt and promote migration of mesenchymal stem cells. Urol Oncol. 2014;32:607–612. | ||
Addison CL, Belperio JA, Burdick MD, Strieter RM. Overexpression of the duffy antigen receptor for chemokines (DARC) by NSCLC tumor cells results in increased tumor necrosis. BMC Cancer. 2004;4:28. | ||
Mestas J, Burdick MD, Reckamp K, Pantuck A, Figlin RA, Strieter RM. The role of CXCR2/CXCR2 ligand biological axis in renal cell carcinoma. J Immunol. 2005;175:5351–5357. | ||
Liao J, Liu R, Yin L, Pu Y. Expression profiling of exosomal miRNAs derived from human esophageal cancer cells by solexa high-throughput sequencing. Int J Mol Sci. 2014;15:15530–15551. | ||
Webber J, Stone TC, Katilius E, et al. Proteomics analysis of cancer exosomes using a novel modified aptamer-based array (SOMAscanTM) platform. Mol Cell Proteomics. 2014;13:1050–1064. | ||
Savina A, Fader CM, Damiani MT, Colombo MI. Rab11 promotes docking and fusion of multivesicular bodies in a calcium-dependent manner. Traffic. 2005;6:131–143. | ||
Hsu C, Morohashi Y, Yoshimura SI, et al. Regulation of exosome secretion by Rab35 and its GTPase-activating proteins TBC1D10A-C. J Cell Biol. 2010;189:223–232. | ||
Braicu C, Tomuleasa C, Monroig P, Cucuianu A, Berindan-Neagoe I, Calin GA. Exosomes as divine messengers: are they the Hermes of modern molecular oncology? Cell Death Differ. 2015;22:34–45. | ||
Tan TT, Selvan ST, Zhao L, Gao S, Ying JY. Size control, shape evolution, and silica coating of near-infrared-emitting PbSe quantum dots. Chem Mater. 2007;19:3112–3117. | ||
Xu J, Futakuchi M, Alexander DB, et al. Nanosized zinc oxide particles do not promote DHPN-induced lung carcinogenesis but cause reversible epithelial hyperplasia of terminal bronchioles. Arch Toxicol. 2014;88:65–75. | ||
Nagai H, Okazaki Y, Chew SH, et al. Diameter and rigidity of multiwalled carbon nanotubes are critical factors in mesothelial injury and carcinogenesis. Proc Natl Acad Sci U S A. 2011;108:E1330–E1338. | ||
Luanpitpong S, Wang L, Castranova V, Rojanasakul Y. Induction of stem-like cells with malignant properties by chronic exposure of human lung epithelial cells to single-walled carbon nanotubes. Part Fibre Toxicol. 2014;11:22–39. | ||
Annangi B, Bach J, Vales G, Rubio L, Marcos R, Hernandez A. Long-term exposures to low doses of cobalt nanoparticles induce cell transformation enhanced by oxidative damage. Nanotoxicology. 2015;9:138–147. | ||
Montecalvo A, Larregina AT, Shufesky WJ, et al. Mechanism of transfer of functional microRNAs between mouse dendritic cells via exosomes. Blood. 2012;9:756–766. | ||
Cheng L, Sharples RA, Scicluna BJ, Hill AF. Exosomes provide a protective and enriched source of miRNA for biomarker profiling compared to intracellular and cell-free blood. J Extracell Vesicles. 2014;3:23743–23755. | ||
Ji H, Greening DW, Barnes TW, et al. Proteome profiling of exosomes derived from human primary and metastatic colorectal cancer cells reveal differential expression of key metastatic factors and signal transduction components. Proteomics. 2013;13:1672–1686. | ||
Kruger S, Elmageed ZYA, Hawke DH, et al. Molecular characterization of exosome-like vesicles from breast cancer cells. BMC Cancer. 2014;14:44. | ||
Duijvesz D, Burnum-Johnson KE, Gritsenko MA, et al. Proteomic profiling of exosomes leads to the identification of novel biomarkers for prostate cancer. PLoS One. 2013;8:e82589. | ||
Ji H, Chen M, Greening DW, et al. Deep sequencing of RNA from three different extracellular vesicle (EV) subtypes released from the human LIM1863 colon cancer cell line uncovers distinct mirna-enrichment signatures. PLoS One. 2014;9:e110314. | ||
Lv LL, Cao Y, Liu D, et al. Isolation and quantification of microRNAs from urinary exosomes/microvesicles for biomarker discovery. Int J Biol Sci. 2013;9:1021–1031. | ||
Villarroya-Beltri C, Gutiérrez-Vázquez C, Sánchez-Cabo F, et al. Sumoylated hnRNPA2B1 controls the sorting of miRNAs into exosomes through binding to specific motifs. Nat Commun. 2013;4:2980–2983. | ||
Madhavan B, Yue S, Galli U, et al. Combined evaluation of a panel of protein and miRNA serum-exosome biomarkers for pancreatic cancer diagnosis increases sensitivity and specificity. Int J Cancer. 2015;136:2616–2627. |
Supplementary materials
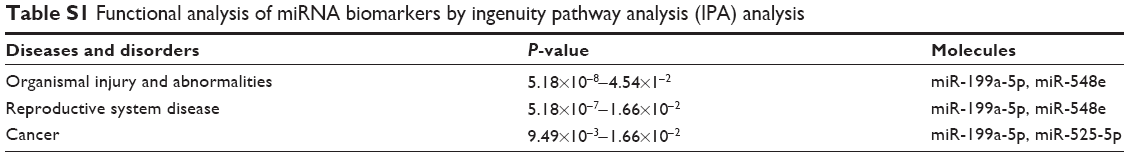 | Table S1 Functional analysis of miRNA biomarkers by ingenuity pathway analysis (IPA) analysis |
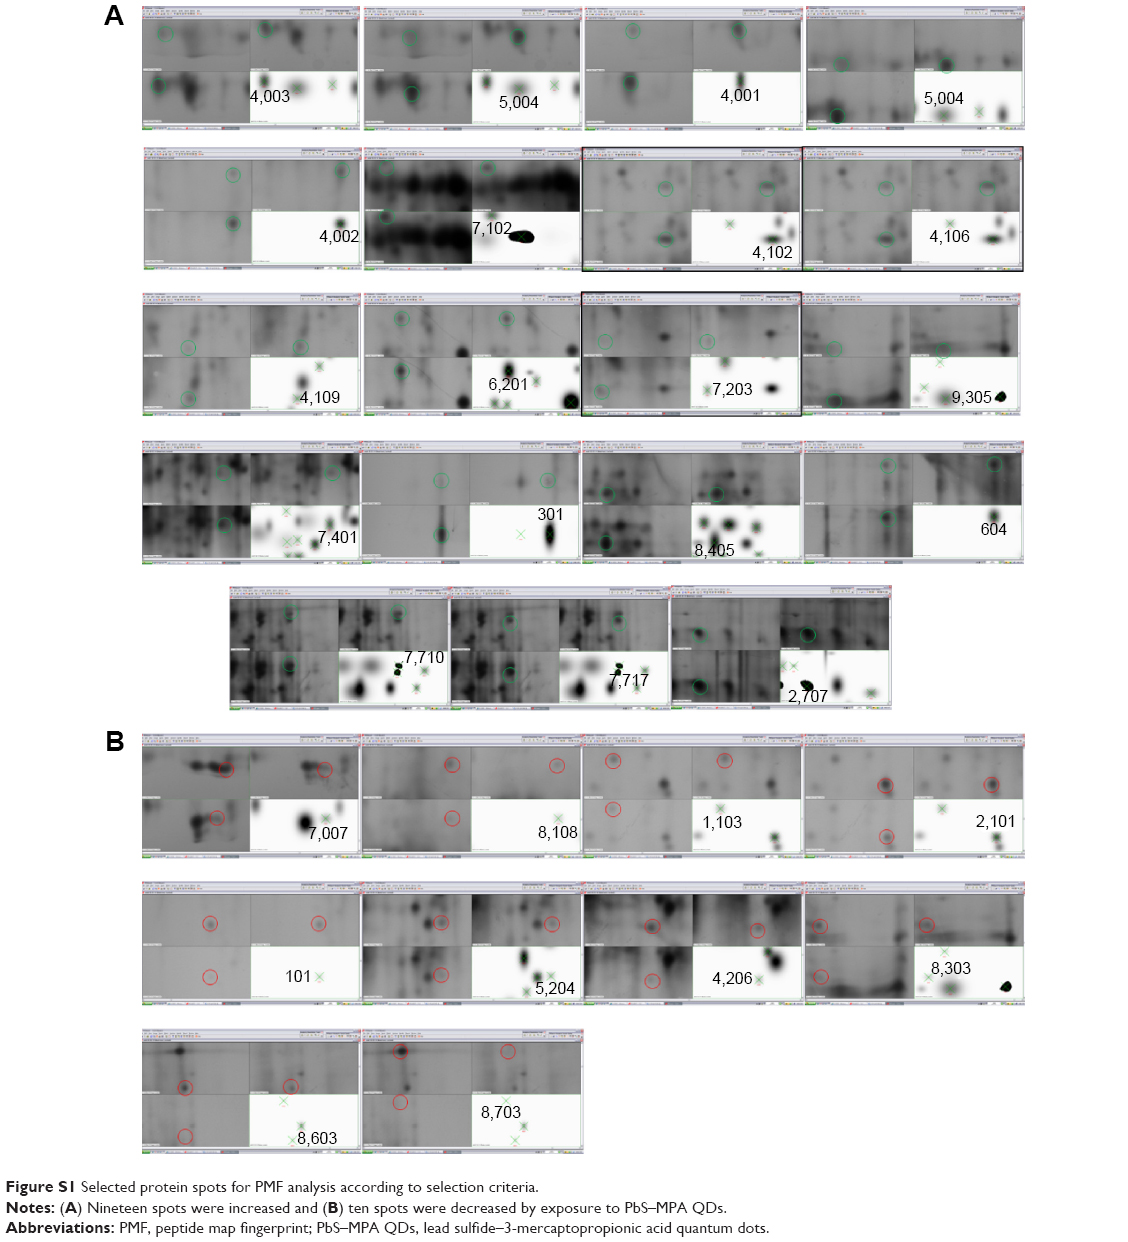 | Figure S1 Selected protein spots for PMF analysis according to selection criteria. |
 © 2015 The Author(s). This work is published and licensed by Dove Medical Press Limited. The full terms of this license are available at https://www.dovepress.com/terms.php and incorporate the Creative Commons Attribution - Non Commercial (unported, v3.0) License.
By accessing the work you hereby accept the Terms. Non-commercial uses of the work are permitted without any further permission from Dove Medical Press Limited, provided the work is properly attributed. For permission for commercial use of this work, please see paragraphs 4.2 and 5 of our Terms.
© 2015 The Author(s). This work is published and licensed by Dove Medical Press Limited. The full terms of this license are available at https://www.dovepress.com/terms.php and incorporate the Creative Commons Attribution - Non Commercial (unported, v3.0) License.
By accessing the work you hereby accept the Terms. Non-commercial uses of the work are permitted without any further permission from Dove Medical Press Limited, provided the work is properly attributed. For permission for commercial use of this work, please see paragraphs 4.2 and 5 of our Terms.