")
Back to Journals » Open Access Journal of Clinical Trials » Volume 6
Between- and within-patient n-level response surface pathway design in dose-finding studies
Authors Dewi S, Kristiansen V, Lindkær-Jensen S, Larsen S
Received 20 November 2013
Accepted for publication 15 April 2014
Published 3 July 2014 Volume 2014:6 Pages 63—74
DOI https://doi.org/10.2147/OAJCT.S57955
Checked for plagiarism Yes
Review by Single anonymous peer review
Peer reviewer comments 2
Sagita Dewi,1 Veronica Kristiansen,2 Steen Lindkær-Jensen,3,4 Stig Larsen1
1Centre for Epidemiology and Biostatistics, Faculty of Veterinary Medicine and Biosciences, Norwegian University of Life Sciences, Ås, Norway; 2Department of Companion Animal Sciences, Faculty of Veterinary Medicine and Biosciences, Norwegian University of Life Sciences, Oslo, Norway; 3Department of Surgery and Cancer, Hammersmith Hospital Campus, Imperial College, Du Cane Road, London, UK; 4Meabco A/S, Copenhagen, Denmark
Background: The most commonly used escalation methods in dose-finding studies have obvious weaknesses, and the Bayesian approach is difficult for clinicians to understand and to apply. The study aims were to introduce and assess the performance of clinically based response surface pathway (RSP) design for dose-finding studies, exemplified by one between-patient study, one within-patient study, and simulation studies.
Methods: The between-patient study consisted of 15 women suffering from stage IV breast cancer, while the within-patient study consisted of seven female dogs with metastatic mammary cancer. The studies were conducted to determine the maximum tolerated dose (MTD) of a new anticancer agent named BP-C1 using three-level RSP designs. Adjustment of the dose from one design level to the next was based on a k-adjustment factor estimated to ensure coverage of the entire predefined dose window. Patient sequences with an equal number of patients as design levels were included in the between-patient design, whereas the same patients were included in all the design levels in the within-patient design.
Results: Four of the five patient sequences in the between-patient study and all seven dogs in the within-patient study reached the upper limit of the dose windows without any increase in toxicity. The MTD of BP-C1 was thus found to be higher than the predefined cumulative dose window for both patient groups. In all three scenarios, the RSP design estimated MTDs better than the traditional 3+3 design; however, the toxicity rates were found to be higher when the target MTD was under the starting dose.
Conclusion: The RSP designs do not need an assumed statistical model, and may be useful in estimating MTD, using a minimal sample size. The k-adjustment factor ensures complete dose window coverage and the design utilizes more information by allowing multinomial outcomes.
Keywords: dose escalation procedure, maximum tolerated dose, MTD, phase I clinical trial, RSP
Background
Development of Phase I trial methodology in the oncology field has to take into account aspects such as safety, ethics, and efficiency.1 The majority of patients enrolled in this phase have unsuccessfully undergone treatment using the available standard treatments, and are in an advanced stage of cancer.2 For safety and ethical reasons, the designs to be used for such studies must include the lowest possible number of patients. Additionally, study designs should minimize the number of patients receiving doses resulting in undesirable toxic events whilst maximizing the number of patients to be treated with doses closest to the maximum tolerated dose (MTD). In general, dose-response Phase I studies are conducted sequentially, allocating dose levels to patients based on the observed toxicity effect from previous patients or treatment periods.
Several statistically based models have been proposed for designing Phase I oncology trials.3 This type of design aims at identifying a dose level, which yields a prespecified probability of dose-limiting toxicity by using all toxicity information accumulated during the trial to compute a more precise dose–toxicity curve.3 These methods were developed in order to shorten the duration of Phase I trials and to determine a more precise dose for Phase II trials.4 The majority of these designs use the Bayesian model, which requires an initial prior distribution of the parameter in question. The design allows escalation, with the probability of obtaining a dose-limiting toxicity being updated for each new patient entering the study at any dose level, until a prespecified condition is attained. The trial ends once the prespecified condition has been reached. The continual reassessment method,5 the escalation with overdose control,6 and the accelerated biased-coin design with isotonic regression estimator7 are some of the designs that use this approach. However, clinicians usually avoid these approaches because of the advanced statistical methodology. Rule-based designs, such as the traditional 3+3 design8 and its extensions – the A + B design9 and group up-and-down design – do not specify any modeling of the dose–toxicity curve.10 These designs are developed within the classical assumption for cytotoxic drugs that toxicity increases with dose. In estimating the MTD, the traditional design uses neither mathematical function nor hypothesized relationship curves between the incidence of toxicity and dose. Clinicians prefer this design because its implementation and interpretation are relatively easy. However, ethical concerns have arisen regarding the possibility of involving an excessive number of escalation steps and the inclusion of a high number of patients being treated at potentially biologically inactive dose levels.5,11 Furthermore, the likelihood of discontinuing at an incorrect level is greater than is commonly assumed.12
Toxicity response levels in the oncology field are typically multinomial and expressed in grades. The common approach, when assigning doses to the next patients, is to reduce the multinomial toxicity response into a binary variable. Although this method is practical, some useful information might be lost. The degree of toxicity will better reflect the dose response and will obviously increase the information of the toxicity profile. The possibility of using multinomial toxicity outcome, when the target dose was defined in different toxicity grades, has been described.10,13–15
The philosophy behind the up-and-down designs16–18 and response surface methodology19 was used as the basic concept in the development of response surface pathway (RSP) design.20 The aim was to develop a design that would reduce the number of laboratory animals for the estimation of toxic levels and dose-response curves, but which would not lead to loss of information. A laboratory-animal study was conducted with the basic concept of RSP design21 and developed by simulation of these data. The strength of the RSP design was verified in another laboratory study that aimed to estimate the toxicity dose-response of a new toxin. The RSP design consists of n-levels, in which the results obtained on one design level give the dose to be used on the next. The demands on the RSP design were to cover the predefined dose window, to include a procedure for escalation and de-escalation of the dose between design levels, to use multinomial outcome, to ensure a rapid dose adjustment toward the area of interest, and to use most of the subjects at the highest design level. The RSP design was developed for toxicity study in laboratory animals, but might fit in common Phase I dose-finding studies.
The RSP design does not require any prior probability distribution. The procedure for escalating and de-escalating is based purely on patient outcomes and the demand for covering the predefined dose window. In cases in which the same patient is used in all the steps or design levels, the design is to be classified as a Markov chain.22 If only one patient can participate at a single design level, it is necessary to create patient sequences, where each sequence consists of a number of patients equal to the number of levels in the design. In this situation, the dose to be used for one patient in the sequence is based on the results obtained from the previous patient in the same sequence.
The aims of the present paper are to introduce and assess the performance of clinically based RSP design for dose-finding studies. The application of the RSP design was exemplified by data from one between-patient study in women and one within-patient study in dogs, and its performance was assessed using simulations.
Methods
Material
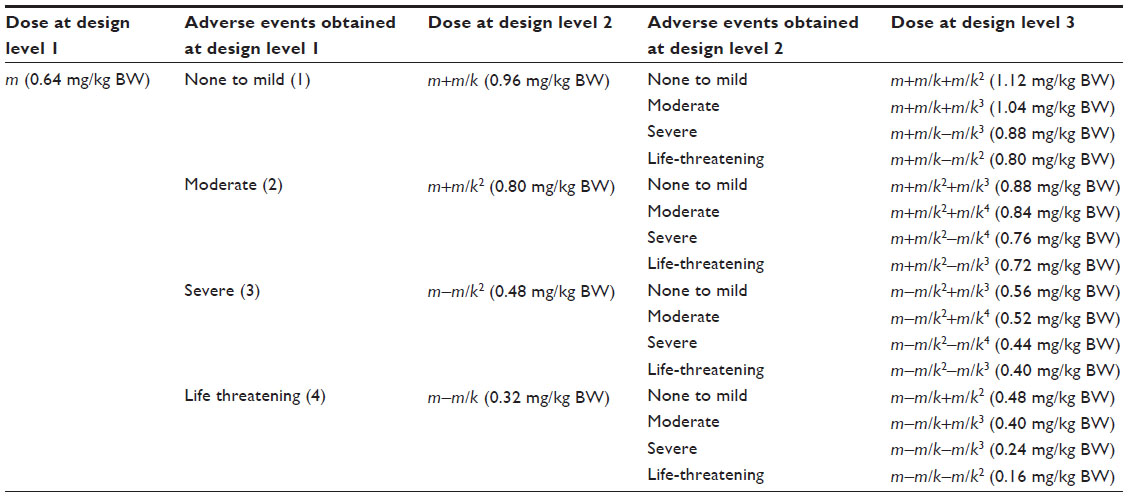
The between-patient study material consisted of 15 women with stage IV breast cancer with a mean duration of disease of 5.2 years.23 The patients were recruited in five sequences of three patients from three different hospitals. The aim of this study was to estimate the MTD of a new anticancer agent BP-C1. This is an innovative anticancer agent that contains benzene-poly-carboxylic acid complex with cis-Diammineplatinum (II) dichloride,24 and which was developed to establish a low toxic and cost-effective treatment of breast cancer. The treatment was given intramuscularly with one injection every day over a period of 32 days. The outcome variable was toxicity increase from baseline to 32 days of treatment, recorded by using the National Cancer Institute Common Toxicity Criteria.25 This gave the following four possible outcomes: 1) no to mild increase; 2) moderate increase; 3) severe increase; and 4) life-threatening increase (Table 1). The study was approved by the ethics committees in the three participating countries, Indonesia, Thailand, and Taiwan, while all the patients gave their written consent for participation.
 | Table 1 Pattern of changes in cumulative dose in the between-patient three-level response surface pathway design |
The within-patient study material consisted of seven privately owned female dogs of different breeds, diagnosed with inoperable or metastatic mammary cancer. They were recruited and treated at the Department of Companion Animal Clinical Science at the Faculty of Veterinary Medicine and Biosciences, Norwegian University of Life Sciences.26 The mean disease duration was 21.2 months. The aim of this study was to estimate the cumulative MTD of BP-C1 in dogs. A daily subcutaneous injection was given to the dogs for three periods of 7 days, with 7-day rest periods between the treatment periods. The outcome variable was toxicity increase from baseline to 7 days of treatment, recorded using the Common Terminology Criteria for adverse events following chemotherapy in dogs and cats,27 giving a similar outcome as that described for the National Cancer Institute Common Toxicity Criteria. The study was approved by the ethics committee at the Faculty of Veterinary Medicine and Biosciences, Norwegian University of Life Sciences, while all dog owners gave their written consent for participation.
Between-patient response surface pathway design
In the between-patient RSP design, the patients included were allocated into groups of three; the same number as the number of levels in the design. The first patient in each group was included at the first design level, the next at the second design level, and the last at the third design level. These groups defined the study sequences. Within each study sequence, the outcome from the patient at the first design level determined the dose to be used for the patient at the second design level. Similarly, the outcome from this patient determined the dose to be used for the third patient at the last design level. In general, the between-patient RSP design consisted of n levels and r independent patient sequences. Each sequence contained the same number of patients as the number of levels in the design. The first patient allocated to a sequence was given a predefined starting dose (Figure 1). The outcome for this patient determined the dose for the second patient in the sequence. The outcome for the patient at design level i (1≤ i≤ n) determined the dose to be used for the patient at the next design level: i+1. Each patient sequence was developed as a random walk and describes a pathway in the design. The outcome variable X is multinomial. If the number of outcomes is denoted as 2c, the number of different sequences or pathways will be (2c)n–1. Of these possible 2c outcomes, c indicates an escalation, and the remaining c outcomes indicate a de-escalation, of the dose to the next patient in the sequence.
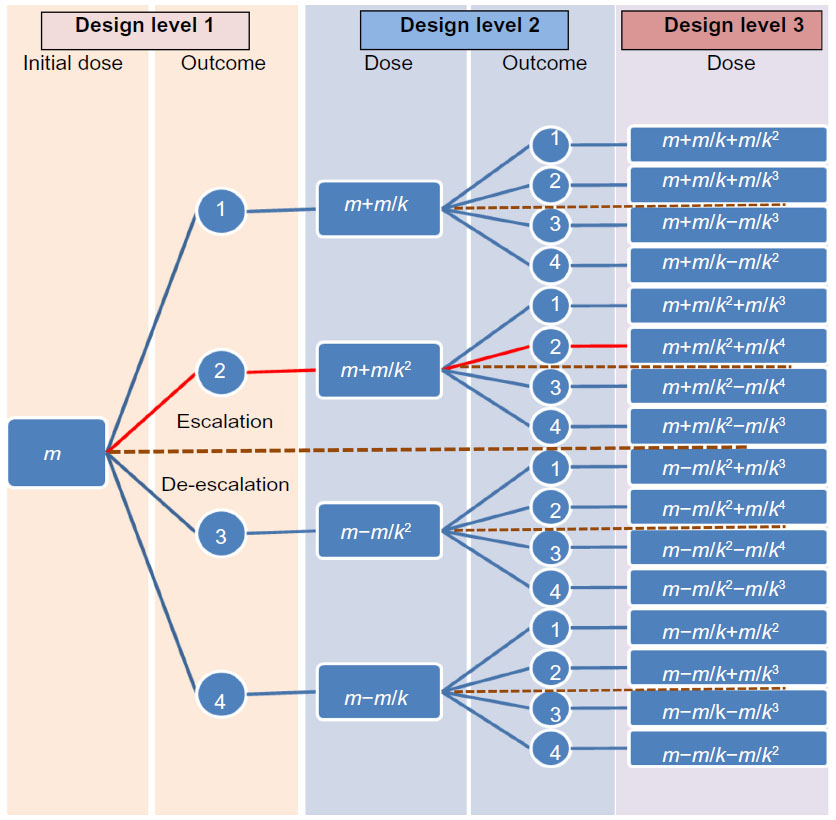 | Figure 1 Dose escalation and de-escalation procedures in a between-patient and a within-patient response surface pathway design. |
The dose window is defined as DU= the highest and DL= the lowest predefined dose of the trial medication. It may be convenient to use the mid dose in the predefined dose window as the starting dose, denoted as m. In order to ensure coverage of the dose window, a dose adjustment procedure is established.
Dose adjustment procedure
Let mi denote the dose at design level i, and let k denote the dose adjustment factor. The dose at dose level i is given by the equation:

The largest possible dose obtained at design level n will then be:

With known starting dose m and design level n, the k-adjustment factor can be calculated by using the formula for the sum of a geometric series.28 The upper dose DU of the window on the last design level n will be given by:
The adjustment k-factor will be used to calculate the dose for the next dose level. Hence, the adjustment k-factor will allow the design to establish the desired dose within the dose window. In the between-patient study presented in this paper, a (n=3)-level RSP design was used with a predefined window of BP-C1 as DL=0.16 mg/kg of body weight (BW) and DU=1.12 mg/kg BW. By using the midpoint strategy, the starting dose m=0.64 mg/kg BW was obtained. The k-adjustment factor was calculated from Equation 4 and gave k as:

Escalation and de-escalation procedure
Let the outcome variable X have a sample space {1, 2, … 2c}. Let i represent the new design level, j the outcome from the previous dose level i−1, and h the outcome that results in dose level i−1. For calculation of the second dose level, h≡1 per definition, then for design level i≥2, the dose will be given as:

If the outcome is an unequal number (2c+1), then the median outcome will be c+1. This means that the first c outcome indicates a dose escalation, and the last c indicates a dose de-escalation. The outcome c+1 may, therefore, result in an unchanged dose from the previous, whilst Equations 6–9 will be used for calculation of the remaining 2c doses. In the present between-patient study, the outcome was an equal number, with 2c=4 and a k-adjustment factor of k=2, as calculated previously (Figure 1). In accordance with Equations 6 and 7, the doses for the second level are as follows:
Within-patient response surface pathway design
As previously described for the between-patient RSP design, the within-patient RSP design consists of n levels. However, in this situation, the same patient was included at all the n-levels. Consequently, the patient sequence in this design consisted of one single patient. The patients were given the same predefined starting dose. The dose to be used at the second level for the same patient was determined by the patient outcome (Figure 1). In general, the patient outcome at design level i (1≤ i≤ n) determined the dose to be used for the same patient at the next design level i+1. The further descriptions and definition of symbols are the same in both the within- and the between-patient RSP designs.
In the within-patient study presented in this paper, a (n=3)-level RSP design was used with a predefined window of BP-C1 as DL=0.07 mg/kg BW and DU=0.46 mg/kg BW. By using the midpoint strategy, the starting dose m=0.26 mg/kg BW was obtained. The k-adjustment factor was calculated from Equation 4 and gave k as:

In the present within-patient study, the outcome (2c=4) is an equal number, similar to the between-patient example. If the outcome at the first level is h=2= moderate, the doses on the third level (Figure 1) will be:
MTD
MTD is defined as the highest dose that has a probability ≤1/3 of leading to severe and/or life-threatening toxicity.
Statistical analysis
The sample space of the dose in the present studies may be expressed as:

Let μ be the MTD and assume μ is contained in ΩD. The recorded degree of toxicity is ordinal and the probability of severe toxicity monotonically increases over the dose levels. Isotonic regression for multinomial outcome is the suggested model for analyzing the material.29 The selected probability of declining acceptability of toxicity grade for quantile estimation was set to τ=(0.95, 0.50, 0.30, 0.05) for the grades mild, moderate, severe, and life-threatening, respectively. In the three scenarios using RSP design, the MTDs were estimated using isotonic regression with binary outcome.30–32 The MTDs for both between- and within-patient studies were also estimated using isotonic regression.
Simulation study
Three scenarios were created based on data where the dose window was set arbitrarily to be from 100 to 700. The MTD was estimated using between-patient RSP design and traditional 3+3 design.4 The increment of doses for the traditional 3+3 design was set to be 100, 250, 400, 550, and 700. One hundred simulations were performed for every design for each scenario. The MTD in the simulations is defined as the dose where the probability to obtain severe and/or life threatening adverse events is less than or equal to 0.33. The regression models were used in order to provide the probability of obtaining toxicity for every dose. A common slope β for the dose, and coefficients of regression α1, α2, and α3, were used to predict the cumulative probability in the scenarios. The coefficients α1, α2, and α3 represent the parameters that are used to predict the probability of obtaining adverse events that are higher or equal to moderate, higher or equal to severe, and higher or equal than life-threatening for every assigned dose, respectively. In these simulations, the probabilities of obtaining mild and no adverse events were merged.
Scenario 1
Scenario 1 was based on a model where β=0.00249024, α1=1.4319236, α2=–1.3327211, and α3=–3.3495348 were implemented. In this scenario, the target MTD was set equal to 250.
Scenario 2
Scenario 2 was based on a model where β=0.0029917, α1=0.4666749, α2=–1.8898425, and α3=–3.9113343 were implemented. In this scenario, the target MTD was set equal to 400.
Scenario 3
Scenario 3 was based on a model where β=0.00281718, α1=–0.554871, α2=–2.2568783, and α3=–4.0975592 were implemented. In this scenario, the target MTD was set equal to 550.
Results
Between-patient study
The first patients in each of the five patient sequences were given a cumulative dose of 0.64 mg/kg BW. Of these, three patients had unchanged toxicity levels, one reported a mild increase, and the final patient displayed a moderate increase in toxicity. This resulted in a cumulative dose of 0.96 mg/kg BW for the second patients in these four sequences (Figure 2). One patient had a mild toxicity increase, whilst the remaining three were unchanged from the second design level. Consequently, the patients at the third design level in each of these four sequences were assigned the maximum cumulative dose of 1.12 mg/kg BW. No increase in toxicity was reported by these patients.
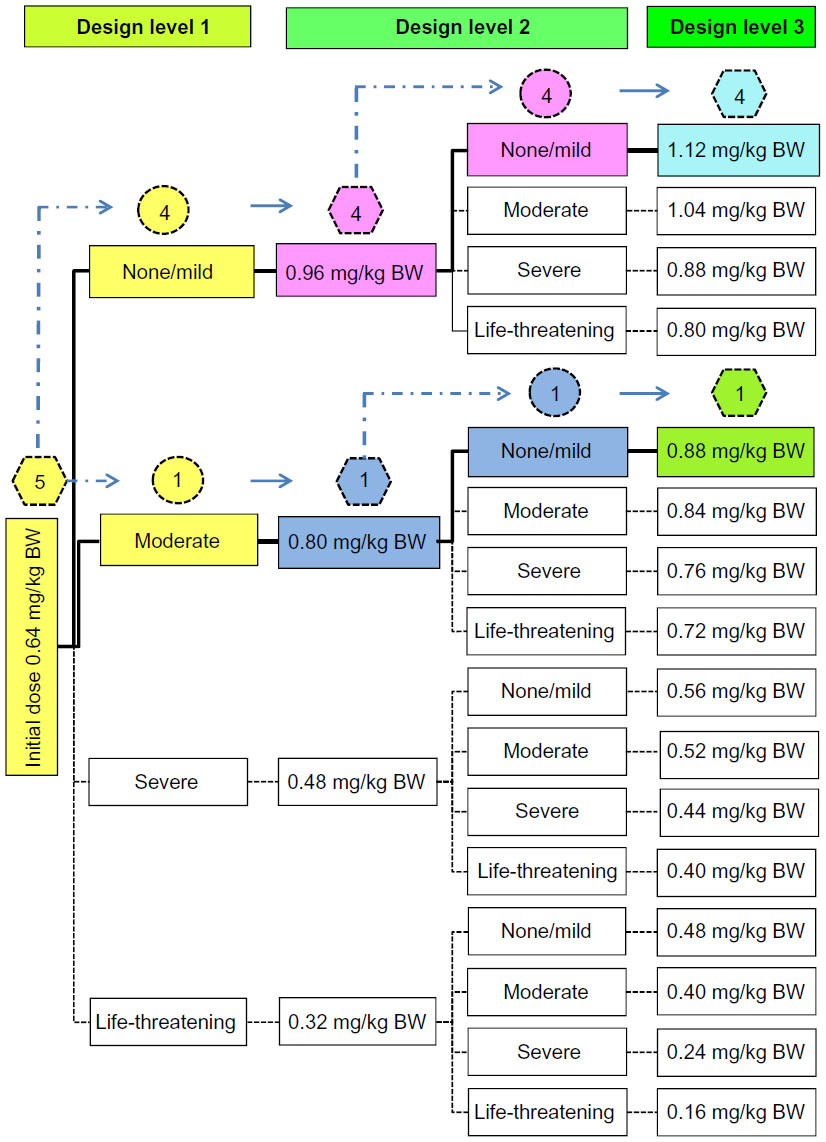 | Figure 2 The pathway when estimating the maximum tolerated dose of BP-C1 in women with stage IV breast cancer using a between-patient response surface pathway design. |
In the last patient sequence, the first patient treated with the starting dose of 0.64 mg/kg BW reported a moderate toxicity increase (Figure 2). This resulted in a cumulative dose of 0.80 mg/kg BW for the patient at the second design level. No toxicity increase was detected. This resulted in the following patient at the third design level receiving a cumulative dose of 0.88 mg/kg BW. No toxicity increase was reported for this patient. The MTD was estimated to be 1.12 mg/kg BW with 95% confidence interval: 1.059–1.194 mg/kg BW, and the quantile estimation obtained for the ordinal response based on the selected probabilities was 1.12 mg/kg BW for all grades. These results indicate that the MTD of BP-C1 in humans suffering from stage IV breast cancer is probably above the upper limit of the predefined cumulative dose window.
Within-patient study
All seven dogs included in the study were given a cumulative dose of 0.26 mg/kg BW at the first design level. No change in toxicity was detected in four of the dogs, while a mild increase was recorded in the remaining three (Figure 3). All seven dogs were given 0.39 mg/kg BW at the second design level, in which six were found unchanged and one with reduced toxicity. In accordance with the design, all seven dogs were given the upper limit of the cumulative dose window at the third design level. No increase in toxicity was detected in any of the dogs (Figure 3). The MTD is estimated to be 0.46 mg/kg BW, and the quantile estimation obtained for the ordinal response based on the selected probabilities is 0.46 mg/kg BW for all grades. These results indicate that the MTD of BP-C1 in dogs with mammary cancer is probably above the upper limit of the predefined cumulative dose window.
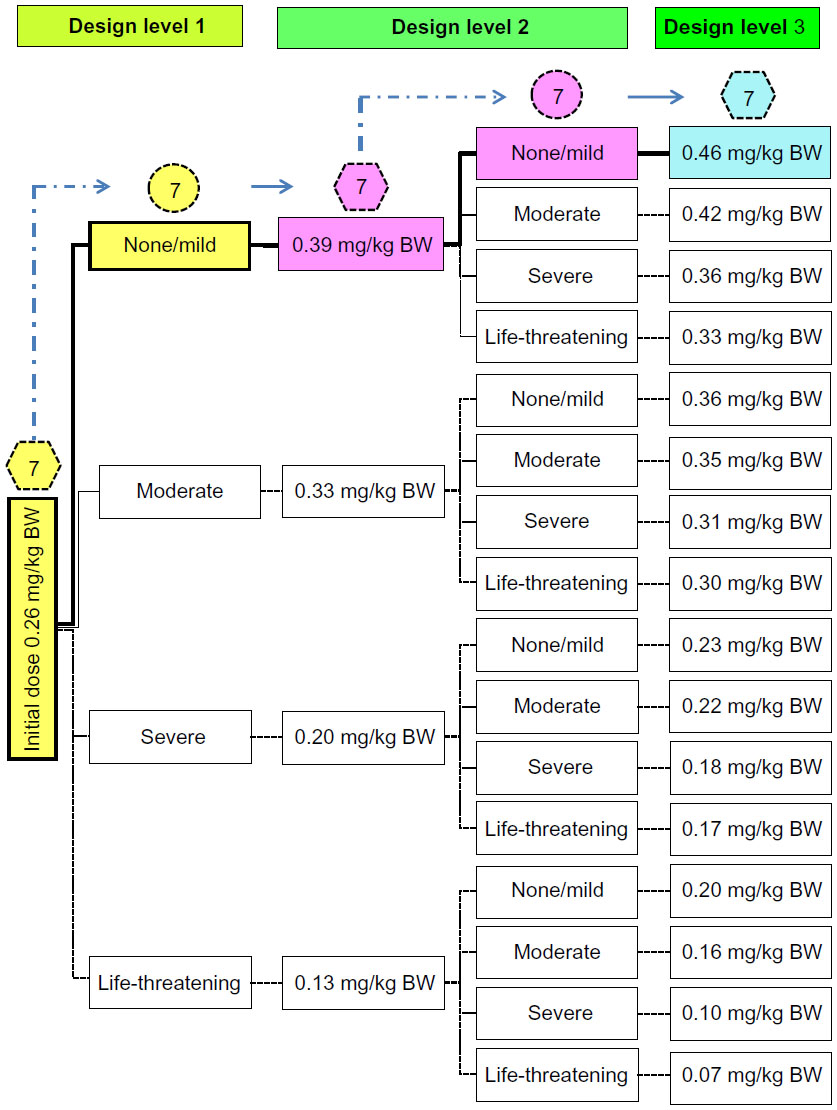 | Figure 3 The pathway when estimating the maximum tolerated dose of BP-C1 in dogs with metastatic mammary cancer using a within-patient response surface pathway design. |
Simulation results
In all the three scenarios, the RSP design estimated MTDs better than the traditional 3+3 design (Table 2). The 3+3 design estimated MTD at one step lower than the targeted value. However, the median number of patients with toxicity grade 3 and/or 4 was higher in the RSP design compared to the traditional 3+3 design. The median percent of patients treated above the estimated MTD was found to be higher in the RSP design in two scenarios, but was found lower in the third scenario.
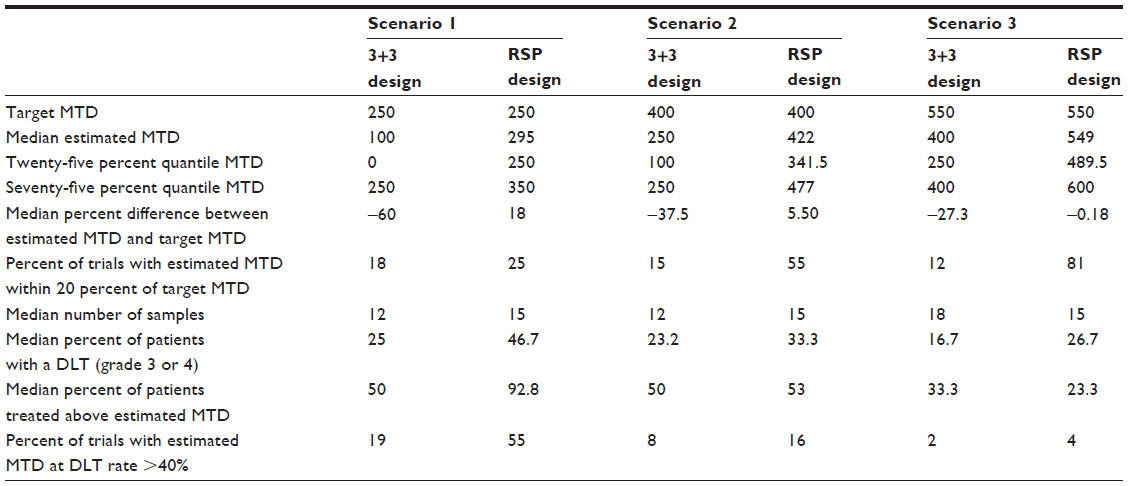 | Table 2 Performance of the traditional 3+3 design and response surface pathway design in three scenarios |
Discussion
In the between-patient designed study, four of the five patient sequences reached the upper limit of the predefined window at the third design level. The same pattern was also detected in the within-patient designed study, in which all the dogs reached the upper limit of the dose window. Due to the fact that severe toxicity was not obtained in either of the two studies, the suggested and recommended isotonic regression could not be performed accurately. However, these results indicate that the upper limit in the predefined dose window was too low and that the MTD is above the upper limit for both humans and dogs. These two examples demonstrate that the RSP design reaches the area of interest rapidly by using a small number of patients. The between-patient-design study consisted of five patients at each dose level, whereas a total of seven dogs were included in the within-patient-design study. This could have been reduced to three patient sequences in the between-patient study and three dogs in the within-patient study. However, this would have weakened the estimate of the parameter in question.
In the 3+3 design, the procedure for dose escalation is commonly said to be based on the modified Fibonacci sequences.3 However, the modification used in the dose adjustment sequence is often not completely described and almost never cited as the source of the scheme.33 In addition, the modified Fibonacci sequences are usually constructed by the investigator before starting the trial and lacks meaningful attributes.34 Some rule-based designs do not follow Fibonacci fixed escalation or de-escalation procedures; instead, they use a constant or logarithmic scale escalation.35 An obvious weakness of these procedures is that they are only based on the starting dose and do not take into account the possibility of a predefined dose window. Consequently, these procedures do not guarantee any coverage of the dose window and might terminate beyond the upper limit of such a predefined window. The procedure to escalate or de-escalate in the RSP design is based on the k-adjustment factor, ensuring that all values within the dose window are covered and that all doses to be included will fall inside the window. The k-adjustment factor depends on the starting dose (m), the upper and lower border in the predefined dose window (DU, DL, respectively), and the number of levels within the design (n). The number of design levels used will influence the width of the step. If the dose window is known to be wide, the number of design levels may be increased. However, when the dose window is narrow, a smaller number of design levels may be sufficient. The number of design levels influences the sample size in a between-patient study. However, this will in turn increase the amount of information obtained. The number of design levels will not influence the number of patients needed for a within-patient RSP design. In turn, the study duration for each patient included will obviously increase and may invalidate the study.
Patients often differ in their reactions to cytotoxic agents at a given dose level. Therefore, using a binary outcome response to determine the dose may be inappropriate as this method ignores the severity of the toxicity. In the RSP design, the toxicity outcome is recorded in a multinomial manner and used to determine the dose for the patient at the next level. This is in accordance with the method described elsewhere.10,13–15 In contrast, the target dose for the next design level in the RSP is not based on the sum of the toxicity rate, but on the actual results obtained from the previous design level. The degree of increase or decrease in toxicity obtained at a given design level is used to determine the dose to be used at the next design level. The dose increase in the case of mild toxicity will be larger, compared to the dose increase in the case of a moderate toxicity increase. Similarly, the decrease in dose for the next design-level will be less in the case of severe increase compared to a life-threatening response.
The chosen starting dose is commonly based on preclinical data, supported by experience with the new agent. When choosing this dose, it is important to make it neither too high nor too low. A too-low starting dose will result in under-treatment of the patient.36,37 Similarly, if the chosen dose is too high, the risk of excessive toxicity is increased. The simulation results indicated the limitation of the RSP design when the target MTD was lower than the starting dose, in which more patients experienced toxicities. The RSP design performed better when the target MTD is around the starting dose or higher. The traditional 3+3 design has been criticized for allocating low, possibly suboptimal, doses to a high proportion of patients. The estimation of MTD was made based on the information given by the last three or six patients at each iteration step, which has imprecise correlation with any percentile of the dose–toxicity distribution.5,38 In the simulations, the traditional design estimated MTDs lower than the targeted MTDs. This is in support with findings from another simulation study that the probability to obtain the dose-limiting toxicity in the traditional design was not equal to 33%, but varied from 18.9% to 29%.9 Oron and Hoff assumed that the mid-dose range to some extent is likely to be chosen.39 In cases in which one does not know where to determine the parameter in question in the predefined window, a suggested strategy is to use the mid value of the window as the starting point. In both of the two examples given in the present study, this strategy was the most obvious. In several dose-finding studies, it is commonly recommended to use LD10 (the dose that was lethal to 10% of animals) or functions based on LD10 as the starting dose.1 In the present examples, LD10 of BP-C1 was estimated to be too high for practical use. The mid-dose was therefore used. Because of the symmetry in the procedure for calculation of the k-adjustment factor in the RSP design, both DU and the lower limit DL of the dose window are covered. If it is known or assumed that the parameter in question is in the upper part of the window, a start value in the upper part may result in a more optimal design pathway and is, therefore, to be recommended. In such a situation, the k-adjustment factor has to be calculated using DU. If it is known or assumed that the parameter in question is in the lower part, a start value in the lower part is to be recommended. The lower limit of the dose window, DL, has to then be used in the calculation of the k-adjustment factor. Due to the concept of geometric series, the formula for calculation is then:

In cases where prior knowledge is available to detect the parameter in the dose window, a more optimal design pathway may be obtained. By applying 3+3 design on the present observed results, using three or five design levels, and starting with the lower limit of the dose window and equal dose space, only three patients will reach the upper limit of the dose window. The majority of the patients will be allocated to doses in the lower part of the dose window using 3+3 design in this situation.
One limitation of the RSP designs in this study is that the assigned dose for the next patient was based on the outcome obtained from the previous patient in the sequence. It does not take into account the variability from the patients. In the between-patient study, this limitation can be mitigated by increasing the number of participating patients with increasing design levels, using a minimum number of patients at the first level and gradually increasing this at the second level, third level, etc, with the highest at the last design level. In the present example, three patients could be included at the first, five at the second, and seven at the third design level. This strategy would increase the amount of information since more patients would be allocated at the third design level, at which data could be assumed to be closest to the parameter in question. In this case, a randomization procedure could be applied to the assigned dose for the next design level. However, the use of patient sequences would have to be dropped. The doses for the second design level would be determined by the three patients at the first design level. Assuming a1 represents patients at the first design level indicating a dose A1, a2 determines the dose A2, and a3 determines the dose A3 for the second design level. In general, the randomization would be performed based on a1:a2:a3. If the indicated doses were equal, all the five patients included at the second design level would be given the same dose (A1=A2=A3). If two doses were equal, ie, a1=2 and a2=1, then the randomization would be (2a1:a2). Theoretically, two-thirds of the five patients included at the second design level would receive dose A1 and one-third of the five patients would receive dose A2. The same procedure would be performed for the next seven patients at design level 3. Let b1 represent patients at the second design level determining the dose B1, b2 the dose B2, b3 the dose B3, b4 the dose B4, and b5 the dose B5. In general, the randomization of the seven patients for the third design level would be performed (b1:b2:b3:b4:b5). If the determined doses were equal, all seven patients included at the third design level would be given the same dose. By using the material obtained from the between-patient example and allocating three patients at the first design level, five at the second, and seven at the third, five patients would receive a cumulative dose of 0.96 mg/kg BW at the second design level. By simulation, six patients would have been allocated to the upper limit of 1.12 mg/kg BW and one patient to 1.04 mg/kg BW at the third design level. Altogether, 12 of the included 15 patients would have received a cumulative dose equal to or larger than the estimated minimum efficient dose. An increase of the sample size with increasing design levels increases the power of the between-patient RSP design. In the simulation studies, it was shown that when the target MTD was lower than the starting dose, the number of patients treated on the dose higher than the estimated MTD was very large. This kind of strategy could be beneficial in reducing the number of over-treated patients. However, the disadvantage with such an addition is related to the difficulties of application in multicenter studies. Additionally, it is more time consuming, because allocation of the dose for the next design level can only be performed when all of the information from the previous design levels has been collected.
Most of the new designs are heavily influenced by advanced statistical methods, with which average medical doctors and researchers are not familiar. The introduction of more statistically based designs in the area has obviously increased the level of information, but at the same time made it more difficult to understand. The RSP design is based more on a clinical way of thinking in which the results obtained from one patient determine what to do with the next or the same patient in the next treatment period. In contrast to most of the commonly used designs in dose-finding studies, the RSP design provides an approach for investigating the dose–toxicity relationship throughout the dose window, but the MTD is identified using a statistical analysis, which is not tied to the design. Due to the outline of the design, it is possible to obtain information on MTD without using statistical analysis. By visual inspection of the obtained pattern, together with the commonly used definition of MTD, it is possible to determine the dose. However, statistical analysis of the results is to be recommended. Quantile estimation for ordinal response should be worthwhile to investigators in understanding the toxic properties of the drug for upcoming decisions. The nonparametric modified isotonic regression for multinomial outcome might be the optimal method and is recommended for small samples.29 This method assumes the probability of toxicity to be nondecreasing over the set of possible dosages. The proportional odds model can also be employed to express the dose relationship for ordinal data. The maximum likelihood estimate (MLE) can be used to achieve the MLE of the quantile, however, in small samples, the MLE usually fails.40 Nevertheless, when the MTD should be determined as a formal single number, the isotonic regression with binomial outcome is the suggested method for analysis.30,31 By this, MTD is defined as the dose corresponding with dose-limiting toxicity (the severe and life-threatening adverse events), which is set by the investigator.
The two studies described above are only used to exemplify how these two RSP designs performed in real studies. The between- and within-patient RSP designs could be applied in dose-finding studies both in human and veterinary medicine. In a rare disease or in a situation where the number of cases is limited, the within-patient RSP design is a better choice. In the within-patient RSP design, the sequences in the design used the same patients, which means that the variability between patients can be eliminated. However, the number of patients assigned to design level 2 or higher may be reduced if patients drop out from the study. Patients can withdraw from the study or experience unresolved serious and/or life-threatening adverse events. Moreover, when using the within-patient design, the investigators need to consider the carryover effects of treatments across design levels,41 which could potentially alter the results obtained in the next design level. A washout period between design levels would be sufficient to prevent the carryover effects.41
The RSP philosophy may be used in several situations, not only in dose finding. In a clinical trial, patient examination is planned to be at predefined time intervals. In general, the goal is to perform the patient examinations at a time that will provide optimal information. The predetermined interval strategy will not meet that goal for all patients. Examination of a given patient will create additional information regarding the development of the disease in question. The time for examination may be used as a random variable instead of a fixed time based on an educated guess.
Conclusion
The RSP design is based on clinical philosophy, is easy to apply, and may be useful in estimating MTD. The obtained pathway is a result of random walk and the design does not need an assumed statistical model. The k-adjustment factor ensures complete dose-window coverage and the design utilizes more information by allowing multinomial outcomes.
Acknowledgment
This study was financially supported by Meabco AS, Richard Mortensens vej 61A, DK-23000 Copenhagen S, Denmark.
Disclosure
The authors report no conflicts of interest in this work.
References
Eisenhauer EA, O-Dwyer PJ, Christian M, Humphrey JS. Phase I clinical trial design in cancer drug development. J Clin Oncol. 2000;18:684–692. | |
Roberts TG Jr, Goulart BH, Squitieri L, et al. Trends in the risks and benefits to patients with cancer participating in phase 1 clinical trials. JAMA. 2004;292:2130–2140. | |
Le Tourneau C, Lee JJ, Siu LL. Dose escalation methods in phase I cancer clinical trials. J Natl Cancer Inst. 2009;101:708–720. | |
Gerke O, Siedentop H. Optimal phase I dose-escalation trial designs in oncology-a simulation study. Stat Med. 2008;27:5329–5344. | |
O’Quigley J, Pepe M, Fisher L. Continual reassessment method: a practical design for phase 1 clinical trials in cancer. Biometrics. 1990;46:33–48. | |
Babb J, Rogatko A, Zacks S. Cancer phase I clinical trials: efficient dose escalation with overdose control. Stat Med. 1998;17:1103–1120. | |
Stylianou M, Follmann DA. The accelerated biased coin up-and-down design in phase I trials. J Biopharm Stat. 2004;14:249–260. | |
Storer BE. Design and analysis of phase I clinical trials. Biometrics. 1989;45:925–937. | |
Lin Y, Shih WJ. Statistical properties of the traditional algorithm-based designs for phase I cancer clinical trials. Biostatistics. 2001;2:203–215. | |
Ivanova A. Escalation, group and A + B designs for dose-finding trials. Stat Med. 2006;25:3668–3678. | |
Korn EL, Midthune D, Chen TT, Rubinstein LV, Christian MC, Simon RM. A comparison of two phase I trial designs. Stat Med. 1994;13:1799–1806. | |
Reiner E, Paoletti X, O’Quigley J. Operating characteristics of the standard phase I clinical trial design. Comput Stat Data Anal. 1999;30:303–315. | |
Iasonos A, Zohar S, O’Quigley J. Incorporating lower grade toxicity information into dose finding designs. Clin Trials. 2011;8:370–379. | |
Van Meter EM, Garrett-Mayer E, Bandyopadhyay D. Proportional odds model for dose-finding clinical trial designs with ordinal toxicity grading. Stat Med. 2011;30:2070–2080. | |
Van Meter EM, Garrett-Mayer E, Bandyopadhyay D. Dose-finding clinical trial design for ordinal toxicity grades using the continuation ratio model: an extension of the continual reassessment method. Clin Trials. 2012;9:303–313. | |
OECD Guidelines for the Testing of Chemicals [webpage on the Internet]. OECD. Available from: http://www.oecd.org/env/ehs/testing/oecdguidelinesforthetestingofchemicals.htm. Accessed June 30, 2011. | |
Bruce RD. An up-and-down procedure for acute toxicity testing. Fundam Appl Toxicol. 1985;5:151–157. | |
Tsutakawa RK. Random Walk Design in Bio-Assay. J Am Stat Assoc. 1967;62:842–856. | |
Myer RH, Montgomery DC. Response Surface Methodology: Process and Product Optimization Using Designed Experiments. New Jersey: John Wiley and sons; 2002. | |
Dewi S, Aune T, Bunaes JA, Smith AJ, Larsen S. The development of response surface pathway design to reduce animal numbers in toxicity studies. BMC Pharmacol Toxicol. 2014;15:18. | |
Aune T, Aasen JA, Miles CO, Larsen S. Effect of mouse strain and gender on LD50 of yessotoxin. Toxicon. 2008;52:535–540. | |
Norris JR. Markov Chains. 3rd ed. Cambridge: Cambridge University Press, 2008. | |
Dewi S, Larsen S, Srimuninnimit V, Lu Y, Manuaba T, Lindkær-Jensen S. Benzene-poly-carboxylic acids complex with cis-diamminepolatinum (II) dichloride in the treatment of stage IV breast cancer patients. TOBCANJ. 2013;5:7–15. | |
Fares F, Azzam N, Fares B, Larsen S, Lindkaer-Jensen S. benzene-poly-carboxylic acid complex, a novel anti-cancer agent induces apoptosis in human breast cancer cells. PLoS One. 2014;9:e85156. | |
Common Toxicity Criteria (CTC) version 2.0 [webpage on the Internet]. Bethesda: National Cancer Institute; 1999. Available from: http://ctep.cancer.gov/protocolDevelopment/electronic_applications/ctc.htm. Accessed August 17, 2007. | |
Kristiansen V, Dewi S, Jonasdottir T, Larsen S. Toxicity and Pharmacokinetic Profile of a New Anticancer Agent in Canine Mammary Cancer: Proceedings of the Second World Veterinary Cancer Congress, Paris, France, 1–3 March, 2012. Vet Comp Oncol. 2013;11:e20. | |
Veterinary Co-operative Oncology Group (VCOG). Veterinary Co-operative Oncology Group – Common Terminology Criteria for Adverse Events (VCOG-CTCAE) following chemotherapy or biological antineoplastic therapy in dogs and cats v1.0. Vet Comp Oncol. 2004;2:195–213. | |
Fisher G. Series and Sequences. Putney: Phoenix Education; 1996. | |
Paul RK, Rosenberger WF, Flournoy N. Quantile estimation following non-parametric phase I clinical trials with ordinal response. Stat Med. 2004;23:2483–2495. | |
Stylianou M, Flournoy N. Dose finding using the biased coin up-and-down design and isotonic regression. Biometrics. 2002;58:171–177. | |
Stylianou M, Proschan M, Flournoy N. Estimating the probability of toxicity at the target dose following an up-and-down design. Stat Med. 2003;22:535–543. | |
Pace NL, Stylianou MP. Advances in and limitations of up-and-down methodology: a précis of clinical use, study design, and dose estimation in anesthesia research. Anesthesiology. 2007;107(1):144–152. | |
Omura GA. Modified Fibonacci Search. J Clin Oncol. 2003;21:3177. | |
Rogatko A, Schoeneck D, Jonas W, Tighiouart M, Khuri FR, Porter A. Translation of Innovative Designs into phase I trials. J Clin Oncol. 2007;25:4982–4986. | |
Ivanova A, Montazer-Haghighi A, Mohanty SG, Durham SD. Improved up-and-down designs for phase I trials. Stat Med. 2003;22:69–82. | |
Collins JM, Grieshaber CK, Chabner BA. Pharmacologically guided phase I clinical trials based upon preclinical drug development. J Natl Cancer Inst. 1990;82:1321–1326. | |
Penta J, Rosner G, Trump D. Choice of starting dose and escalation for phase I studies of antitumor agents. Cancer Chemother Pharmacol. 1992;31:247–250. | |
O’Quigley J, Chevret S. Methods for dose finding studies in cancer clinical trials: a review and results of a monte carlo study. Stat Med. 1991;10:1647–1664. | |
Oron AP, Hoff PD. Small-sample behavior of novel phase I cancer trial designs. Clinical Trials. 2013;10:63–80. | |
Albert A, Anderson JA. On the existence of maximum likelihood estimates in logistic regression models. Biometrika. 1984;71:1–10. | |
Chin R, Lee BY. Principles and Practice of Clinical Trial Medicine. 1st ed. Academic Press, 2008. |
 © 2014 The Author(s). This work is published and licensed by Dove Medical Press Limited. The full terms of this license are available at https://www.dovepress.com/terms.php and incorporate the Creative Commons Attribution - Non Commercial (unported, v3.0) License.
By accessing the work you hereby accept the Terms. Non-commercial uses of the work are permitted without any further permission from Dove Medical Press Limited, provided the work is properly attributed. For permission for commercial use of this work, please see paragraphs 4.2 and 5 of our Terms.
© 2014 The Author(s). This work is published and licensed by Dove Medical Press Limited. The full terms of this license are available at https://www.dovepress.com/terms.php and incorporate the Creative Commons Attribution - Non Commercial (unported, v3.0) License.
By accessing the work you hereby accept the Terms. Non-commercial uses of the work are permitted without any further permission from Dove Medical Press Limited, provided the work is properly attributed. For permission for commercial use of this work, please see paragraphs 4.2 and 5 of our Terms.