")
Back to Archived Journals » Gastrointestinal Cancer: Targets and Therapy » Volume 4
Association between time to disease progression end points and overall survival in patients with neuroendocrine tumors
Authors Singh S, Wang X, Law C
Received 31 January 2014
Accepted for publication 1 May 2014
Published 16 August 2014 Volume 2014:4 Pages 103—113
DOI https://doi.org/10.2147/GICTT.S61671
Checked for plagiarism Yes
Review by Single anonymous peer review
Peer reviewer comments 3
Simron Singh,1 Xufang Wang,2 Calvin HL Law1
1Sunnybrook Odette Cancer Center, University of Toronto, Toronto, ON, Canada; 2Novartis Oncology, Florham Park, NJ, USA
Abstract: Overall survival can be difficult to determine for slowly progressing malignancies, such as neuroendocrine tumors. We investigated whether time to disease progression is positively associated with overall survival in patients with such tumors. A literature review identified 22 clinical trials in patients with neuroendocrine tumors that reported survival probabilities for both time to disease progression (progression-free survival and time to progression) and overall survival. Associations between median time to disease progression and median overall survival and between treatment effects on time to disease progression and treatment effects on overall survival were analyzed using weighted least-squares regression. Median time to disease progression was significantly associated with median overall survival (coefficient 0.595; P=0.022). In the seven randomized studies identified, the risk reduction for time to disease progression was positively associated with the risk reduction for overall survival (coefficient on −ln[HR] 0.151; 95% confidence interval −0.843, 1.145; P=0.713). The significant association between median time to disease progression and median overall survival supports the assertion that time to disease progression is an alternative end point to overall survival in patients with neuroendocrine tumors. An apparent albeit not significant trend correlates treatment effects on time to disease progression and treatment effects on overall survival. Informal surveys of physicians’ perceptions are consistent with these concepts, although additional randomized trials are needed.
Keywords: neuroendocrine tumors, progression-free survival, disease progression, mortality
Introduction
Overall survival (OS) remains the gold standard end point for randomized controlled clinical trials in patients with cancer.1 Health technology assessments and cost-effectiveness analyses of cancer therapies also typically require estimates of treatment effects on OS. Clinical trial design assessing OS as a primary end point can be particularly challenging in rare tumor types because of increased requirements for patient recruitment and follow-up.2,3 Time to disease progression (TDP) end points such as progression-free survival (PFS) and time to tumor progression (TTP), evaluated using prespecified criteria, are often accepted by regulatory authorities as alternative or surrogate end points to OS, particularly in situations in which it may not be feasible to use OS as a primary end point.1 This may be particularly relevant when it is not feasible to determine the OS benefit irrespective of antitumor activity, such as in trials that have crossover designs or populations in whom survival would be expected to be prolonged beyond 12 months despite disease progression.1,3–5
Use of PFS as a primary end point in cancer clinical trials has some important advantages and disadvantages.3 For instance, compared with OS, measurement of PFS benefit derived from a particular therapeutic agent or regimen in a clinical trial is less confounded by other variables, such as crossover to active agents or subsequent active therapies.3 Moreover, statistically significant differences in PFS compared with OS can be measured in smaller patient populations in shorter time frames; however, there are risks for potential measurement errors or statistical biases in smaller patient populations.3 Other possible limitations are the difficulty validating PFS as a surrogate for survival in certain treatment settings; the definition of PFS varies among trials and does not typically account for factors such as quality of life, pain, and performance status, which may be important in the patient population with neuroendocrine tumors (NET) because of the indolent nature of the disease, the requirement for frequent radiologic or other assessments to determine disease status, and the requirement for balanced timing of assessment among treatment arms.
NET represent a tumor type in which OS is particularly difficult to evaluate because of disease heterogeneity (resulting in difficult patient recruitment in large Phase III trials), low numbers of eligible patients (ie, those with proper diagnoses), and variable survival times for patients with distal or regional NET (median OS, 33 or 111 months, respectively).6 Survival times are even shorter among patients with specific subtypes of NET. For example, patients with metastatic pancreatic NET have a median OS time of 17 months, whereas those with regionally advanced pancreatic NET have a median OS time of 69 months.7
In rare tumors such as NET, for which treatment options are limited, crossover to the active agent is often included in the trial study design, thus confounding the impact of the specific therapy on OS. Although statistical methods such as inverse probability of censoring weights and rank-preserving structural failure time can be used to account for crossover in the estimation of OS, the impact of a specific drug on survival is often unclear in most crossover clinical trial designs.
Although overall response rate (complete response + partial response) remains an important end point in NET, results from recent prospective Phase II and III trials in NET have demonstrated low overall response rates with different therapeutic agents (including everolimus, octreotide long-acting repeatable, and sunitinib) in spite of observed benefits in PFS and TTP.8–14 It may be that a morphologic response to treatment in patients with NET is not demonstrated as clearly and obviously on radiologic imaging as it is in patients with other tumors. This has certainly been the case in gastrointestinal stromal tumors, for which Response Evaluation Criteria In Solid Tumors (RECIST) did not capture clinical response to treatment in clinical trials.15
It should also be noted that although PFS has already been recognized as a valuable primary end point for several solid tumors (colorectal, breast, ovarian, and kidney),3 discussions continue as to whether PFS may be regarded as a clinically meaningful end point if an OS benefit is not ultimately achieved.2,16 Recently, a consensus report from the US National Cancer Institute Neuroendocrine Tumor Clinical Trials Planning Meeting recommended PFS as a feasible and relevant primary end point for Phase III NET clinical trials.17 In many diseases, PFS may be an important clinical outcome for treating physicians as well. A 2009 survey of physicians showed that PFS had the most influence on their treatment decisions for patients with advanced NET.18
Clearly, clinical trials in NET must be designed using end points that enable safe and efficacious agents to be identified and that ultimately offer improved outcomes to patients. Using OS as the sole threshold for the adoption of new drugs in a rare cancer such as NET would likely discourage the development of new, much needed agents in uncommon tumors.
One approach is to project these effects on the basis of estimates of the association between treatment effects on TDP and those on OS. In addition, PFS used as a disease end point and its use to estimate the OS benefit of a particular therapeutic agent or regimen yield important information for clinicians. We discuss here the evidence (based on a thorough review of the literature and a weighted least-squares regression analysis) that supports the use of TDP end points (including PFS and TTP) in the design of clinical trials in NET.
Materials and methods
Data identification
A thorough review of the literature was conducted to identify published or presented clinical trials of medical therapies in patients with NET. Our approach differs from a comprehensive systematic review in that the literature review and analysis of the relationship between PFS and OS conducted herein involved only major studies (not all possible studies available) and did not include all possible arms within each study. Trials published in the English language after January 1, 2000, were identified from the PubMed/MEDLINE database. Additional trials were identified by reviewing the reference lists of a previous technology assessment19 and retrieved articles and by searching the 2007–2010 conference proceedings of the American Society of Clinical Oncology, the European CanCer Organisation, the North American Neuroendocrine Tumor Society, and the European Neuroendocrine Tumour Society. To be included in the analysis, the study had to be a clinical trial (single-arm clinical trial or randomized clinical trial; Phase I, II, or III); be conducted in patients with NET; assess somatostatin analogs, targeted therapies (ie, inhibitors of endothelial growth factor receptors, vascular endothelial growth factor receptors, mammalian target of rapamycin [mTOR], and tyrosine kinases), immunotherapies, cytotoxic chemotherapy, or peptide receptor radionuclide therapy; and report survival probabilities for both TDP and OS. Any trials not meeting these criteria were excluded from the analysis. For each of the studies selected for inclusion, data on study design, treatments, patient characteristics, and outcomes measurements were extracted.
Analyses
Associations between median TDP and median OS (unit of observation: study arm) and between treatment effects on TDP and treatment effects on OS (unit of observation: comparison of study arms) were analyzed using weighted least-squares regression. The intercept of the regression equations was not forced to zero. The negative log of the hazard ratio (HR) for TDP and OS (ie, −ln[HR]) was used as a measure of treatment effects on TDP and OS.20 For small treatment effects, −ln(HR) is approximately equal to 1−HR; therefore, −ln(HR) is approximately equal to the relative risk reduction with treatment. If necessary, HRs of the observed treatment effect between treatment groups were estimated on the basis of reported survival probabilities.21 Prediction intervals were calculated for each regression line using the mean number of subjects per arm or comparison as a weight.
Results
Association between TDP end points and OS
A total of 1,343 potential studies were identified from the PubMed/MEDLINE database, conference proceedings, and reference lists of health technology assessments and retrieved articles; 1,213 were excluded because they did not meet the inclusion criteria (controlled or uncontrolled clinical trial; conducted in patients with NET; assessed somatostatin analogs, targeted therapies, immunotherapies, cytotoxic chemotherapy, or peptide receptor radionuclide therapy; or reported survival probabilities for both TDP and OS). After a detailed review of the remaining 130 articles and abstracts, 22 were identified as meeting all inclusion criteria and were included in the analysis (Figure 1). These 22 studies included seven controlled and 15 uncontrolled trials, representing 29 unique treatment arms and 2,584 patients (Table 1).8,9,11–14,22–37
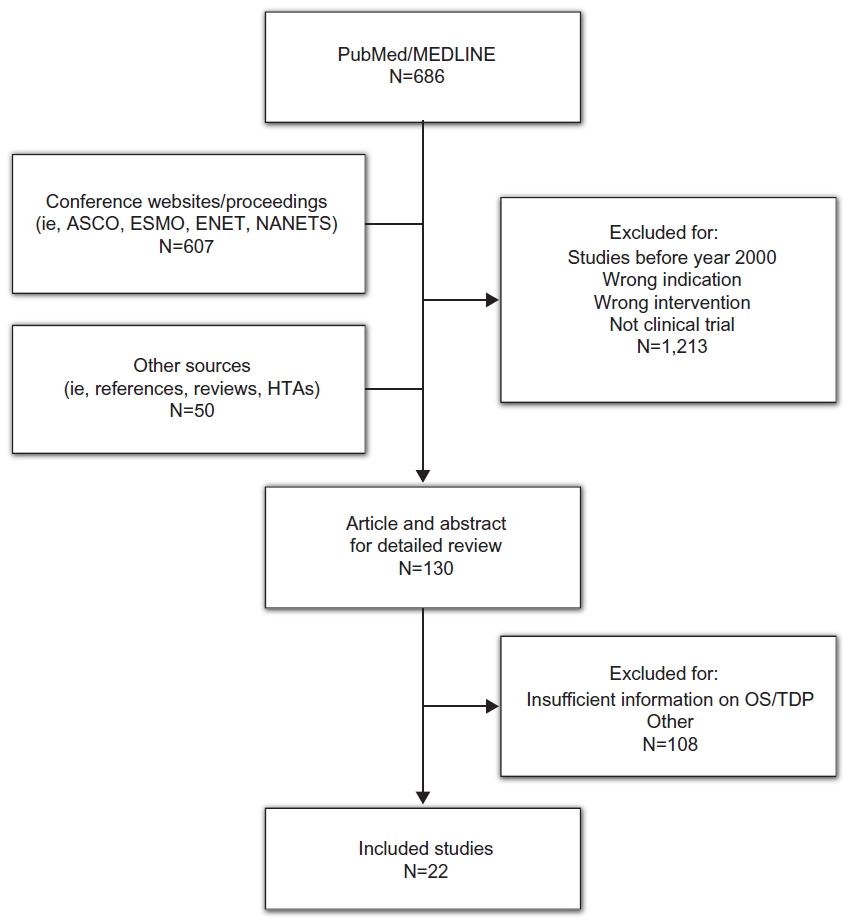 | Figure 1 Results of the search strategy. |
 | Table 1 Summary characteristics and results of included studies |
The trials covered a broad range of therapeutics, including octreotide,8,11,37 everolimus,13,14,37 interferon-α,8,34 sunitinib,9,12 and streptozocin plus 5-fluorouracil.26,34,36 Four of the controlled studies included placebo arms.11,12,14,37 Eight of the single-arm studies investigated chemotherapies,22–24,27–29,31 and the others studied peptide receptor radionuclide therapy, imatinib, or interferon-γ.
Although tumor grade is not consistently reported, most patients had well-differentiated or moderately differentiated disease; patients with poorly differentiated tumors were included in some of the uncontrolled trials. Similarly, although the subtype of NET is not consistently reported, most patients had gastroenteropancreatic NET. Most of these patients had carcinoid syndrome. Overall, 24 of the 29 treatment arms reported both median TDP and OS (Table 1). Across available treatment arms, median TDP and OS averaged 9.6 and 30.1 months, respectively. In 14 studies, the TDP measure was PFS; in the remaining eight studies, the TDP measure was TTP. Of these 24 treatment arms, three used somatostatin analogs as the experimental therapy, three used targeted therapies, two used immunotherapies, eleven used cytotoxic chemotherapy, and two used peptide receptor radionuclide therapy; one trial had a placebo arm, and two trials used somatostatin analogs in combination with agents of different modalities (one immunotherapy, one targeted therapy). Of the seven randomized trials, four reported median TDP and OS for both treatment arms (Table 1).
Association between median TDP and median OS
Based on linear regression of the 24 eligible treatment arms, median TDP was significantly associated with median OS (coefficient on median TDP 0.595; 95% confidence interval [CI] 0.094–1.097; P=0.022, Figure 2A). The low R2 of 0.216 suggests that median TDP explains a relatively small proportion of the variability in median OS. When the extreme outlier values of TDP =6 and OS =75 (obtained from the placebo arm of the PROMID study of octreotide, ClinicalTrials.gov identifier NCT0017187311) were excluded, the coefficient on median TDP increased to 0.698 (95% CI 0.311–1.086). Results were also similar if the RADIANT-237 and RADIANT-314 controlled trials of everolimus (ClinicalTrials.gov identifiers NCT00412061 and NCT00510068, respectively), each of which included a high proportion of crossover from control to active therapy after progression, were excluded from the analysis (coefficient on median TDP 0.625; 95% CI 0.110–1.139; P=0.020).
 | Figure 2 Linear regression and treatment effects comparison. |
Association between risk reduction for PFS and risk reduction for OS in controlled trials
Seven comparisons were available for the analysis of the association between treatment effects on TDP and treatment effects on OS, including six randomized trials8,11,12,14,34,37 that reported HRs for both TDP and OS and one randomized trial26 for which the HRs could be estimated on the basis of reported survival probabilities. Based on linear regression of these seven randomized studies, the risk reduction for TDP was positively associated with the risk reduction for OS (coefficient on −ln[HR] 0.151; 95% CI −0.843, 1.145; P=0.713, Figure 2B). Similar to the analysis of the association between median TDP and median OS, the low R2 of 0.030 suggests that the HR for TDP explains a relatively small proportion of the variability in the HR for OS. If the RADIANT-2 and RADIANT-3 studies13,37 were excluded from the linear regression because of the high degree of crossover, the coefficient increased to 0.413 and the R2 increased nearly 10-fold to 0.273; however, the relationship between risk reduction for median TDP and risk reduction for median OS remained statistically insignificant (P=0.366).
Publication bias (eg, if studies with small and/or nonsignificant findings remain unpublished) was assessed using the funnel plot method (Figure 3). Egger’s regression test was conducted to test for funnel plot asymmetry. Neither the plot nor the test (P=0.2828) suggests publication bias.
 | Figure 3 Funnel plot for –ln(hazard ratio) for overall survival. |
Discussion
Based on this analysis of 22 controlled and uncontrolled studies representing 29 unique treatment arms and 2,584 patients, median TDP is positively and significantly associated with median OS in clinical trials of medical treatments for NET. When only randomized controlled trials were considered, the treatment effects on TDP appeared to show a trend for association with the treatment effects on OS, although the association was not statistically significant because of the small number of randomized trials. The small number of trials also limited the analysis to a pooled analysis rather than one by response criteria (World Health Organization versus RECIST). Regardless, these associations are consistent with findings in other cancers in which the surrogacy of TDP for OS has been well established, but they clearly underscore the need for a larger number of randomized trials in NET to generate sufficient data to meet the consensus-defined significance threshold for survival measures.20,38–44 For example, in an analysis of the relationship between TTP and OS in 146 trials of first-line chemotherapy for metastatic colorectal cancer, the treatment effect on TTP was positively and significantly correlated with the treatment effect on OS (R2=0.33; P<0.0001).42 An analysis of 67 studies of therapy for metastatic breast cancer revealed that a treatment effect on TDP was positively and significantly associated with a treatment effect on OS (R2=0.30; P<0.001).44 Analyses of metastatic colorectal and breast cancer showed that the treatment effect on OS was less than the treatment effect on TDP. A likely explanation for this difference is the susceptibility of OS to differences between treatment groups in post-progression therapies, which typically are not controlled and are subject to the discretion of the investigator. Trials in which the study design dictates that patients in the control group who experience disease progression be allowed to cross over to receive active treatment are particularly sensitive to the confounding effects of post-study treatment on OS, perhaps because another effective treatment may not be available for these patients. The confounding effects of selective crossover were illustrated in the present analysis of advanced NET by the larger correlation between the treatment effect on TDP and the treatment effect on OS when the RADIANT-237 and RADIANT-314 studies of everolimus were excluded (R2=0.030 with the RADIANT studies; R2=0.273 without the RADIANT studies). Aside from the exclusion of RADIANT-2 and RADIANT-3, we did not attempt to control for the crossover effect or for the potential correlation of arms within trials. These observations seem to support the hypothesis that TDP is a truer measure than OS of the study therapy effect, especially when a crossover design is used.
In clinical practice, physicians with experience treating patients with advanced NET have their own definitions and perceptions about disease progression. In 2009, 502 practicing physicians, either oncologists (n=398) or gastroenterologists/endocrinologists (n=104), from six countries (USA, 250; UK, 51; Spain, 51; France, 50; Germany, 50; Italy, 50) participated in a brief, online, third-party survey sponsored by Novartis Pharmaceuticals Corporation concerning their opinions about the definition of disease progression in patients with NET (data on file). The specific ratio of oncology to gastroenterology/endocrinology specialties in each country was set deliberately to try to replicate the approximate mix of specialists who treat advanced NET; thus, no weighting of the data by specialty was necessary. All qualified physicians met specific screening criteria, including the following: in practice between 2 and 30 years, >50% of professional time spent in direct patient care, and currently treating a minimum of three patients with advanced NET (minimum of one patient in Japan). Information regarding clinician perceptions of disease progression was extracted from the survey and presented at the 35th Congress of the European Society for Medical Oncology, held October 8–12, 2010, in Milan, Italy.18 Among the surveyed physicians, the effect on PFS was the attribute most likely to affect clinical therapeutic decisions (Figure 4).18 Increased tumor size (albeit not necessarily per RECIST) and the development of clinical symptoms associated with NET were the top considerations for defining and measuring disease progression (Table 2). Additional criteria mentioned frequently included changes in biomarkers and increased metastases (Table 2). This survey provides needed insight regarding physicians’ perceptions of disease progression at a clinical level.
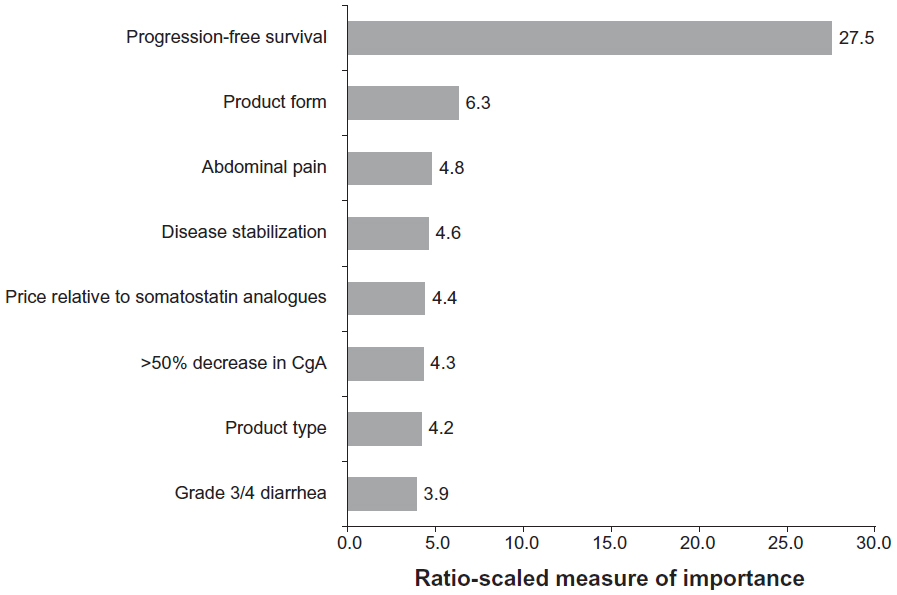 | Figure 4 Importance of advanced therapy attributes (n=397). |
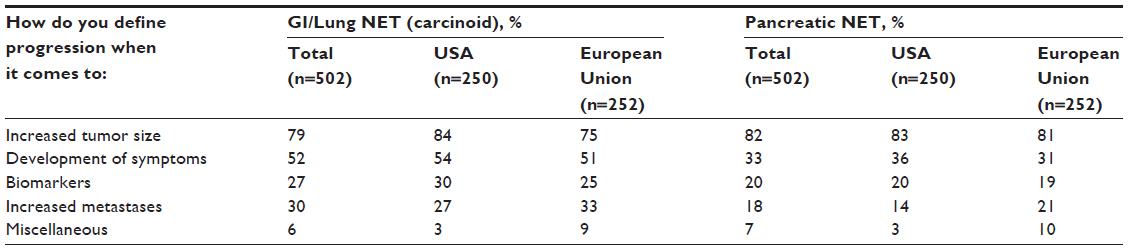 | Table 2 Physicians’ definitions of disease progression in patients with NET |
Given the usefulness of TDP end points and physicians’ perceptions of disease progression as presented here, the way in which progression is assessed becomes a pivotal issue. Traditionally, both PFS and overall response rate end points have been based on RECIST; however, PFS also takes disease stabilization into consideration, whereas overall response rate addresses only changes in tumor size. In fact, the updated RECIST (version 1.1) does not require confirmation of tumor response in studies for which PFS is the primary end point, particularly in Phase III trials.45 Because of the broader inclusion of patients who derive treatment benefit on the basis of delayed disease progression, the US Food and Drug Administration issued specific guidance in 2007 on clinical trial end points that confirmed the acceptability of PFS as a primary end point for drug approval.4
Although RECIST has been adopted as the standard for assessment of imaging-related end points in clinical trials in populations with solid tumors,46,47 this set of rules has recognized limitations in the current era of evolving assessments and may not fully measure or quantify disease control in patients with tumors such as NET and gastrointestinal stromal tumors, which are slow growing or present radiologic challenges, and in patients with widely disseminated disease.47 Moreover, newer targeted cytostatic agents may work by mechanisms unlikely to cause radiologically measurable tumor regression.45 For example, RECIST has been shown to underestimate the effect of imatinib in patients with gastrointestinal stromal tumors, an observation that may be related to the occurrence of drug-induced cystic changes early in the course of treatment.48 Such a response may be better measured by tumor density rather than size, which is not measured according to RECIST. This is especially true in cancers such as NET, which are often associated with functional hormonal secretion causing patient symptoms and decreased quality of life. Meaningful clinical response in such cancers may include decreased hormonal secretion with or without obvious radiologic changes according to RECIST. Another measurement of response may include imaging with 68Ga-labeled analogs of octreotide, such as DOTATOC, DOTANOC, and DOTA-TATE.49
Improved methods of assessing tumor response have been developed. RECIST was updated (version 1.1) in 2009 to incorporate advances in imaging technology and issues arising from recent clinical trials.49 Both computed tomography (CT) and magnetic resonance imaging (MRI) are used for localizing and staging NET, and although CT and MRI have similar sensitivities,50 MRI has been shown to equal or exceed CT in some applications.51 Combined functional/morphologic positron emission tomography (PET)/CT imaging has been demonstrated to detect tumor response more accurately than either modality alone.52 Fluorine-18 2-fluoro-2-deoxy-d-glucose/PET has limited usefulness compared with CT/MRI, especially in patients with well-differentiated NET. Another type of tumor response assessment, ie, the Choi criteria, developed in 2007,15 involves tumor size reduction ≥10% or tumor density reduction ≥15%, particularly in tumors that have indistinct boundaries or are diffuse. The Choi criteria have been positively correlated with TTP and disease-specific survival in patients with gastrointestinal stromal tumors.15,53
The literature search was not conducted according to PRISMA (Preferred Reporting Items for Systematic Reviews and Meta-Analysis) guidelines. Our evaluation differs from a systematic review in that our analysis of the relationship between PFS and OS did not include all possible studies; thus, there may be gaps in the available data that were analyzed. Other limitations of this study include the following: we could not look at the potential confounding effects of individual factors such as age, gender, histologic stage, and therapies because these data were not available for all patients in all studies; we could not control for the potential correlation of arms within trials (although randomization would assist with independence); we could not control for the confounding effects of selective crossover of patients from placebo to active treatment arms because of tumor progression on OS; the overall sample size was small (including a small number of trials and a small number of participants within each trial), and this could have contributed to the lack of statistical significance for the relationship between risk reduction for median TDP and risk reduction for median OS; the small number of trials limited our analysis to a pooled analysis rather than one by response criteria (World Health Organization versus RECIST); and the inclusion of patients with poorly differentiated NET might have introduced bias. The number of studies in patients with poorly differentiated tumors was very small, and the number of patients in each of those studies was small. Thus, any potential impact of bias is expected to be minimal. Further, we cannot predict how tumor differentiation and grade might have affected our analysis because these data were not consistently reported across studies, nor were the effects of these factors evaluated on PFS and OS in the studies included in our analysis. Collection of these data (tumor grade and differentiation) is important for survival analysis in future clinical trials in NET.
A wide variety of clinical practice guidelines for NET recommend regular follow-up, including MRI, CT, and biomarker assessment, especially for chromogranin A, to aid in determination of disease progression (Table 3).54–60
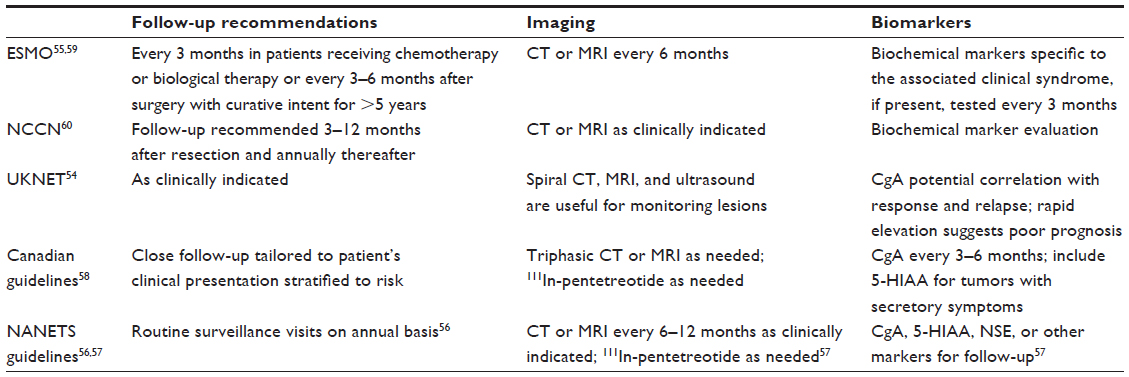 | Table 3 Practice guidelines for imaging and biomarkers in NET |
Conclusion
In summary, median TDP is significantly associated with median OS in clinical trials of therapies for NET. Associations between median TDP and median OS and HR for TDP and OS observed in NET trials are consistent with those in other cancers for which surrogacy has been established. Although the small number of studies conducted to date in patients with NET did not enable significance to be achieved, a positive association was noted between treatment-related effects on TDP and treatment-related effects on OS. Thus, TDP appears to be an appropriate alternative end point to OS in patients with NET. Informal surveys of physicians’ perceptions are consistent with these concepts. Preliminary PFS results from three recent Phase III trials have been reported for patients with advanced NET, but long-term follow-up is required for validation of PFS as a valuable end point in this patient population. The key implication from the results of our study is that choice of an appropriate end point for NET clinical trials is imperative to provide both accurate evaluation of therapies and clinically meaningful extension of patient life span. Because of the short time frames of the studies included in our analysis and patient crossover from the placebo arm to the treatment arm on disease progression, we acknowledge that an end point such as OS will likely not be met, whereas determination of PFS may be a feasible surrogate for OS. Contemporary clinical trials of treatments for patients with advanced NET are incorporating investigation of these hypotheses and have the potential to affect how disease progression and PFS in the NET population are defined in the future.
Acknowledgment
The authors thank Tara B Gibson and Jennifer M Kulak, of ApotheCom, Yardley, PA, USA, for writing and editorial assistance, and Haitao Gao for assistance with statistics.
Author contributions
SS developed the concept, assisted in analyzing the results from the clinician survey, wrote the manuscript, reviewed the drafts, and approved the final draft for submission. XW analyzed the results, wrote the manuscript, reviewed the drafts, and approved the final draft for submission. CL developed the concept, assisted in analyzing the results from the clinician survey, wrote the manuscript, reviewed the drafts, and approved the final draft for submission.
Disclosure
SS has received research grants from Novartis and consulting fees and honoraria from Novartis and Pfizer. XW is an employee of and a stockholder in Novartis Oncology. CL has received research grants from Novartis Oncology and consulting fees from Pfizer Oncology and Novartis Oncology, and serves on the speakers bureau for Novartis Oncology. Financial support for writing and editorial assistance was provided by Novartis Pharmaceuticals, Inc., in compliance with international guidelines on Good Publication Practice.
References
Shi Q, Sargent DJ. Meta-analysis for the evaluation of surrogate endpoints in cancer clinical trials. Int J Clin Oncol. 2009;14(2):102–111. | |
Sargent DJ, Hayes DF. Assessing the measure of a new drug: is survival the only thing that matters? J Clin Oncol. 2008;26(12):1922–1923. | |
Lebwohl D, Kay A, Berg W, Baladi JF, Zheng J. Progression-free survival: gaining on overall survival as a gold standard and accelerating drug development. Cancer J. 2009;15(5):386–394. | |
US Department of Health and Human Services, Food and Drug Administration, Center for Drug Evaluation and Research, Center for Biological Evaluation and Research. Guidance for Industry: Clinical Trial Endpoints for the Approval of Cancer Drugs and Biologics. 2007. Available from: http://www.fda.gov/downloads/drugsGuidanceComplianceRegulatoyInformation/Guidance/UCM071590.pdf. Accessed May 27, 2014. | |
Broglio KR, Berry DA. Detecting an overall survival benefit that is derived from progression-free survival. J Natl Cancer Inst. 2009; 101(23):1642–1649. | |
Yao JC, Hassan M, Phan A, et al. One hundred years after “carcinoid”: epidemiology of and prognostic factors for neuroendocrine tumors in 35,825 cases in the United States. J Clin Oncol. 2008;26(18):3063–3072. | |
Halfdanarson TR, Rabe KG, Rubin J, Petersen GM. Pancreatic neuroendocrine tumors (PNETs): incidence, prognosis and recent trend toward improved survival. Ann Oncol. 2008;19(10):1727–1733. | |
Arnold R, Rinke A, Klose KJ, et al. Octreotide versus octreotide plus interferon-alpha in endocrine gastroenteropancreatic tumors: a randomized trial. Clin Gastroenterol Hepatol. 2005;3(8):761–771. | |
Kulke MH, Lenz HJ, Meropol NJ, et al. Activity of sunitinib in patients with advanced neuroendocrine tumors. J Clin Oncol. 2008;26(20):3403–3410. | |
Yao JC, Phan AT, Chang DZ, et al. Efficacy of RAD001 (everolimus) and octreotide LAR in advanced low- to intermediate-grade neuroendocrine tumors: results of a phase II study. J Clin Oncol. 2008;26(26):4311–4318. | |
Rinke A, Muller HH, Schade-Brittinger C, et al; PROMID Study Group. Placebo-controlled, double-blind, prospective, randomized study on the effect of octreotide LAR in the control of tumor growth in patients with metastatic neuroendocrine midgut tumors: a report from the PROMID Study Group. J Clin Oncol. 2009;27(28):4656–4663. | |
Raymond E, Dahan L, Raoul JL, et al. Sunitinib malate for the treatment of pancreatic neuroendocrine tumors. N Engl J Med. 2011;364(6):501–513. | |
Yao JC, Lombard-Bohas C, Baudin E, et al. Daily oral everolimus activity in patients with metastatic pancreatic neuroendocrine tumors after failure of cytotoxic chemotherapy: a phase II trial. J Clin Oncol. 2010;28(1):69–76. | |
Yao JC, Shah MH, Ito T, et al; RAD001 in Advanced Neuroendocrine Tumors, Third Trial (RADIANT-3) Study Group. Everolimus for advanced pancreatic neuroendocrine tumors. N Engl J Med. 2011; 364(6):514–523. | |
Choi H, Charnsangavej C, Faria SC, et al. Correlation of computed tomography and positron emission tomography in patients with metastatic gastrointestinal stromal tumor treated at a single institution with imatinib mesylate: proposal of new computed tomography response criteria. J Clin Oncol. 2007;25(13):1753–1759. | |
Burzykowski T, Buyse M, Piccart-Gebhart MJ, et al. Evaluation of tumor response, disease control, progression-free survival, and time to progression as potential surrogate end points in metastatic breast cancer. J Clin Oncol. 2008;26(12):1987–1992. | |
Kulke MH, Siu LL, Tepper JE, et al. Future directions in the treatment of neuroendocrine tumors: Consensus report of the National Cancer Institute Neuroendocrine Tumor Clinical Trials Planning Meeting. J Clin Oncol. 2011;29(7):934–943. | |
Singh S, Law C. Utility of progression-free survival as a primary endpoint in clinical studies of advanced neuroendocrine tumors. Ann Oncol. 2010;21:viii 265 (Abstr 851P). | |
Murphy G, Perras C, Desjardin B, et al. Technology report number 111. Ottawa, Canada: Canadian Agency for Drugs and Technologies in Health; 2008. Available from: http://www.cadth.ca/media/pdf/H0348_Octreotide_tr_e.pdf. Accessed May 27, 2014. | |
Buyse M, Burzykowski T, Carroll K, et al. Progression-free survival is a surrogate for survival in advanced colorectal cancer. J Clin Oncol. 2007;25(33):5218–5224. | |
Tierney JF, Stewart LA, Ghersi D, Burdett S, Sydes MR. Practical methods for incorporating summary time-to-event data into meta-analysis. Trials. 2007;8:16. | |
Ansell SM, Pitot HC, Burch PA, Kvols LK, Mahoney MR, Rubin J. A phase II study of high-dose paclitaxel in patients with advanced neuroendocrine tumors. Cancer. 2001;91(8):1543–1548. | |
Bajetta E, Ferrari L, Procopio G, et al. Efficacy of a chemotherapy combination for the treatment of metastatic neuroendocrine tumours. Ann Oncol. 2002;13(4):614–621. | |
Kulke MH, Kim H, Clark JW, et al. A Phase II trial of gemcitabine for metastatic neuroendocrine tumors. Cancer. 2004;101(5):934–939. | |
Stuart K, Levy DE, Anderson T, et al. Phase II study of interferon gamma in malignant carcinoid tumors (E9292): a trial of the Eastern Cooperative Oncology Group. Invest New Drugs. 2004;22(1):75–81. | |
Sun W, Lipsitz S, Catalano P, Mailliard JA, Haller DG; Eastern Cooperative Oncology Group. Phase II/III study of doxorubicin with fluorouracil compared with streptozocin with fluorouracil or dacarbazine in the treatment of advanced carcinoid tumors: Eastern Cooperative Oncology Group Study E1281. J Clin Oncol. 2005;23(22):4897–4904. | |
Ducreux MP, Boige V, Leboulleux S, et al. A Phase II study of irinotecan with 5-fluorouracil and leucovorin in patients with pretreated gastroenteropancreatic well-differentiated endocrine carcinomas. Oncology. 2006;70(2):134–140. | |
Hainsworth JD, Spigel DR, Litchy S, Greco FA. Phase II trial of paclitaxel, carboplatin, and etoposide in advanced poorly differentiated neuroendocrine carcinoma: a Minnie Pearl Cancer Research Network Study. J Clin Oncol. 2006;24(22):3548–3554. | |
Kulke MH, Wu B, Ryan DP, et al. A Phase II trial of irinotecan and cisplatin in patients with metastatic neuroendocrine tumors. Dig Dis Sci. 2006;51(6):1033–1038. | |
Valkema R, Pauwels S, Kvols LK, et al. Survival and response after peptide receptor radionuclide therapy with [90Y-DOTA0,Tyr3]octreotide in patients with advanced gastroenteropancreatic neuroendocrine tumors. Semin Nucl Med. 2006;36(2):147–156. | |
Correale P, Sciandivasci A, Intrivici C, et al. Chemo-hormone therapy of non-well-differentiated endocrine tumours from different anatomic sites with cisplatinum, etoposide and slow release lanreotide formulation. Br J Cancer. 2007;96(9):1343–1347. | |
Yao JC, Zhang JX, Rashid A, et al. Clinical and in vitro studies of imatinib in advanced carcinoid tumors. Clin Cancer Res. 2007;13(1):234–240. | |
Kwekkeboom DJ, De Herder WW, Kam BL, et al. Treatment with the radiolabeled somatostatin analog [177 Lu-DOTA 0,Tyr3]octreotate: toxicity, efficacy, and survival. J Clin Oncol. 2008;26(13):2124–2130. | |
Dahan L, Bonnetain F, Rougier P, et al. Phase III trial of chemotherapy using 5-fluorouracil and streptozotocin compared with interferon alpha for advanced carcinoid tumors: FNCLCC-FFCD 9710. Endocr Relat Cancer. 2009;16(4):1351–1361. | |
Bushnell DL Jr, O’Dorisio TM, O’Dorisio MS, et al. 90Y-edotreotide for metastatic carcinoid refractory to octreotide. J Clin Oncol. 2010; 28(10):1652–1659. | |
Turner NC, Strauss SJ, Sarker D, et al. Chemotherapy with 5-fluorouracil, cisplatin and streptozocin for neuroendocrine tumours. Br J Cancer. 2010;102(7):1106–1112. | |
Pavel ME, Hainsworth JD, Baudin E, et al; RADIANT-2 Study Group. Everolimus plus octreotide long-acting repeatable for the treatment of advanced neuroendocrine tumours associated with carcinoid syndrome (RADIANT-2): a randomised, placebo-controlled, phase 3 study. Lancet. 2011;378(3808):2005–2012. | |
Delea TE, Khuu A, Kay A, Zheng J, Baladi JF. Association between treatment effects on disease progression (DP) endpoints and overall survival (OS) in patients with metastatic renal cell carcinoma (mRCC). J Clin Oncol. 2009;27:S105. | |
Louvet C, de Gramont A, Tournigand C, Artru P, Maindrault-Goebel F, Krulik M. Correlation between progression free survival and response rate in patients with metastatic colorectal carcinoma. Cancer. 2001;91(11):2033–2038. | |
Sargent DJ, Wieand HS, Haller DG, et al. Disease-free survival versus overall survival as a primary end point for adjuvant colon cancer studies: individual patient data from 20,898 patients on 18 randomized trials. J Clin Oncol. 2005;23(34):8664–8670. | |
Buyse M. Is PFS a “valid” surrogate for OS in advanced ovarian cancer? A meta-analysis. North Bethesda, MD, USA: Public Workshop on Endpoints for Ovarian Cancer; 2006. Available from: http://www.fda.gov/downloads/Drugs/DevelopmentApprovalProcess/Development Resources/CancerDrugs/ucm094610.pdf. Accessed May 27, 2014. | |
Johnson KR, Ringland C, Stokes BJ, et al. Response rate or time to progression as predictors of survival in trials of metastatic colorectal cancer or non-small-cell lung cancer: a meta-analysis. Lancet Oncol. 2006;7(9):741–746. | |
Knox JJ. Progression-free survival as endpoint in metastatic RCC? Lancet. 2008;372(9637):427–429. | |
Sherrill B, Amonkar M, Wu Y, et al. Relationship between effects on time-to-disease progression and overall survival in studies of metastatic breast cancer. Br J Cancer. 2008;99(10):1572–1578. | |
Verweij J, Therasse P, Eisenhauer E. Cancer clinical trial outcomes: any progress in tumour-size assessment? Eur J Cancer. 2009;45(2):225–227. | |
Jaffe CC. Measures of response: RECIST, WHO, and new alternatives. J Clin Oncol. 2006;24(20):3245–3251. | |
Sargent DJ, Rubinstein L, Schwartz L, et al. Validation of novel imaging methodologies for use as cancer clinical trial end-points. Eur J Cancer. 2009;45(2):290–299. | |
Verweij J, Casali PG, Zalcberg J, et al. Progression-free survival in gastrointestinal stromal tumours with high-dose imatinib: randomised trial. Lancet. 2004;364(9440):1127–1134. | |
Eisenhauer EA, Therasse P, Bogaerts J, et al. New response evaluation criteria in solid tumours: revised RECIST guideline (version 1.1). Eur J Cancer. 2009;45(2):228–247. | |
Massironi S, Sciola V, Peracchi M, Ciafardini C, Spampatti MP, Conte D. Neuroendocrine tumors of the gastro-entero-pancreatic system. World J Gastroenterol. 2008;14(35):5377–5384. | |
Reznek RH. CT/MRI of neuroendocrine tumours. Cancer Imaging. 2006;6:S163–S177. | |
Antoch G, Kanja J, Bauer S, et al. Comparison of PET, CT, and dual-modality PET/CT imaging for monitoring of imatinib (STI571) therapy in patients with gastrointestinal stromal tumors. J Nucl Med. 2004;45(3):357–365. | |
Benjamin RS, Choi H, Macapinlac HA, et al. We should desist using RECIST, at least in GIST. J Clin Oncol. 2007;25(13):1760–1764. | |
Ramage JK, Davies AH, Ardill J, et al; UK and Ireland Neuroendocrine Tumour Society. Guidelines for the management of gastroenteropancreatic neuroendocrine (including carcinoid) tumours. Gut. 2005; 54 Suppl 4:iv1–iv16. | |
Oberg K, Jelic S. Neuroendocrine gastroenteropancreatic tumors: ESMO clinical recommendations for diagnosis, treatment and follow-up. Ann Oncol. 2008;19 Suppl 2:ii104–ii105. | |
Anthony LB, Strosberg JR, Klimstra DS, et al; North American Neuroendocrine Tumor Society (NANETS). The NANETS consensus guidelines for the diagnosis and management of gastrointestinal neuroendocrine tumors (NETs): well-differentiated NETs of the distal colon and rectum. Pancreas. 2010;39(6):767–774. | |
Boudreaux JP, Klimstra DS, Hassan MM, et al; North American Neuroendocrine Tumor Society (NANETS). The NANETS consensus guideline for the diagnosis and management of neuroendocrine tumors: well-differentiated neuroendocrine tumors of the jejunum, ileum, appendix, and cecum. Pancreas. 2010;39(6):753–766. | |
Kocha W, Maroun J, Kennecke H, et al. Consensus recommendations for the diagnosis and management of well-differentiated gastroenterohepatic neuroendocrine tumours: a revised statement from a Canadian National Expert Group. Curr Oncol. 2010;17(3):49–64. | |
Oberg K, Akerstrom G, Rindi G, Jelic S; ESMO Guidelines Working Group. Neuroendocrine gastroenteropancreatic tumours: ESMO clinical practice guidelines for diagnosis, treatment and follow-up. Ann Oncol. 2010;21 Suppl 5:v223–v227. | |
National Comprehensive Cancer Network. NCCN Clinical Practice Guidelines in Oncology.™ Neuroendocrine Tumors. Available from: http://www.nccn.org/professionals/physician_gls/f_guidelines.asp. 2012. Accessed January 30, 2014. |
 © 2014 The Author(s). This work is published and licensed by Dove Medical Press Limited. The full terms of this license are available at https://www.dovepress.com/terms.php and incorporate the Creative Commons Attribution - Non Commercial (unported, v3.0) License.
By accessing the work you hereby accept the Terms. Non-commercial uses of the work are permitted without any further permission from Dove Medical Press Limited, provided the work is properly attributed. For permission for commercial use of this work, please see paragraphs 4.2 and 5 of our Terms.
© 2014 The Author(s). This work is published and licensed by Dove Medical Press Limited. The full terms of this license are available at https://www.dovepress.com/terms.php and incorporate the Creative Commons Attribution - Non Commercial (unported, v3.0) License.
By accessing the work you hereby accept the Terms. Non-commercial uses of the work are permitted without any further permission from Dove Medical Press Limited, provided the work is properly attributed. For permission for commercial use of this work, please see paragraphs 4.2 and 5 of our Terms.