")
Back to Journals » Neuropsychiatric Disease and Treatment » Volume 11
Association between pain severity, depression severity, and use of health care services in Japan: results of a nationwide survey
Authors Vietri J , Otsubo T, Montgomery W, Tsuji T , Harada E
Received 25 July 2014
Accepted for publication 5 November 2014
Published 13 March 2015 Volume 2015:11 Pages 675—683
DOI https://doi.org/10.2147/NDT.S71768
Checked for plagiarism Yes
Review by Single anonymous peer review
Peer reviewer comments 3
Editor who approved publication: Dr Roger Pinder
Jeffrey Vietri,1 Tempei Otsubo,2 William Montgomery,3 Toshinaga Tsuji,4 Eiji Harada5
1Health Outcomes Practice, Kantar Health, Milan, Italy; 2Tokyo Shinjuku Medical Center, Tokyo, Japan; 3Eli Lilly Australia Pty Ltd., West Ryde, Australia; 4Medical Affairs, Shionogi & Co., Ltd., Osaka, Japan; 5Eli Lilly Japan KK, Kobe, Japan
Background: Depression is often associated with painful physical symptoms. Previous research has seldom assessed the relationship between the severity of physical symptoms and the severity of mental and emotional symptoms of depression or other health outcomes, and no such studies have been conducted previously among individuals with depression in Japan. The aim of this study was to assess the relationship between the severity of physical pain and depression and other outcomes among individuals in Japan diagnosed with depression.
Methods: Data for individuals aged 18 and older in Japan who reported being diagnosed with depression and also reported physical pain were obtained from the Japan National Health and Wellness Survey. These respondents were characterized on sociodemographics and health characteristics, and the relationship between ratings of severity on pain in the last week and health outcomes were assessed using bivariate correlations and generalized linear models. Measures included the Patient Health Questionnaire for depression severity, Medical Outcomes Study 12-Item Short Form Survey Instrument for health-related quality of life, the Work Productivity and Activity Impairment for work and activity impairment, and 6-month report of health care use.
Results: More severe physical pain in the past week was correlated with more severe depression, worse health-related quality of life, lower health utility, greater impairment at work, and more health care provider visits. These relationships remained significant after incorporating sociodemographics and health characteristics in the statistical models.
Conclusion: Individuals whose depression is accompanied by more severe physical pain have a higher burden of illness than those whose depression includes less severe pain, suggesting that even partially ameliorating painful physical symptoms may significantly benefit patients with depression. Clinicians should take the presence and severity of physical pain into account and consider treating both the physical and emotional symptoms of these patients.
Keywords: painful physical symptoms, quality of life, work impairment, health care use
Introduction
Major depressive disorder (MDD) is a severe recurring illness that is associated with depressed mood, loss of interest or pleasure, feelings of guilt or low self-worth, disturbed sleep or appetite, low energy, poor concentration, and risk of suicide. MDD is one of the most common mood disorders, and the impact of MDD and other forms of depression on the patient and society is considerable.1–3 The reported prevalence of mood disorders is far lower in Japan than in many Western countries; the 12-month prevalence of MDD is approximately 3% among Japanese adults according to the World Health Organization Composite International Diagnostic Interview.4 Cohort differences in susceptibility to mood disorders have been noted that may result in a higher lifetime prevalence in younger generations.5 Even with current prevalence rates, the disease imposes a considerable burden on Japanese society, with economic costs estimated at 11 billion US dollars in 2008.6
As is the case with depression, chronic pain conditions have also been found to lead to substantial disability.7–10 Chronic pain is associated with a higher risk of depression and may precede depressed mood.11 Conversely, the presence of depression is predictive of future physical complaints.12 Furthermore, previous research has shown that a high proportion of patients with depression experience a range of painful physical symptoms.13,14 The subset of depressed patients with pain symptoms appears to have a particularly high level of disability. Relative to depressed patients without pain, individuals with depression and comorbid pain have greater limitations in daily activities,13,14 have worse health-related quality of life (HRQoL),13–17 and are more likely to be unemployed due to disability.13,18
Accompanying the greater disability, this subgroup of depressed individuals with pain uses more inpatient and outpatient health care resources and are more expensive to treat.13,16,19–22 Indeed, it has been previously suggested that depressed patients with physical pain may represent a more difficult-to-treat subgroup of patients.23
The connection between painful physical symptoms in depression and greater depression severity, lower quality of life, and greater health care use was recently demonstrated in a multicountry prospective study of individuals presenting with an acute depressive episode in East Asia.24 In this study, painful physical symptoms were reported by approximately half of the patients enrolled, and painful physical symptoms were associated with clinically important decrements in quality of life at 3 months postbaseline,24 and the decrement was maintained after adjusting for covariates including baseline level of depression.25 Similarly, in this study population, worse pain symptoms were associated with lower rates of remission of depression.26 However, Japan was not included in the aforementioned prospective study.
At the moment, little real-world data regarding the incremental burden of physical pain on Japanese patients with depression has been reported, and likewise the associated burden on the Japanese health care system is not understood. The few studies that have explored the impact of painful physical symptoms on depression in Japan suggest an incremental burden over depression without such symptoms. A recent Japanese study demonstrated that more numerous pain symptoms are associated to some aspects of health status as measured by the Short Form 8-item health survey (SF-8) among individuals with depression.27 A link has also been reported between headaches and greater prevalence of severe depression in Japanese women.28 However, patient-reported health outcomes such as HRQoL and impairment to work and daily activities have not been well described in patients with depression and physical pain in Japan. As previous research has demonstrated the experience of painful physical symptoms of depression may vary significantly across countries in East Asia, an analysis of the impact of these symptoms specifically within Japan is warranted.29
Therefore the objective of this study was to assess the relationship between the severity of physical pain and the severity of depression and decrements on other health outcomes in real-world patients with depression in Japan.
Methods
Data were provided by the Japan National Health and Wellness Survey (NHWS; Kantar Health, NY, USA), an annual internet-based survey of the general population aged 18 and older in Japan. Potential respondents are selected from an opt-in survey panel through stratified random sampling, with strata by age and sex specified to match the Japanese population aged 18 years and older. Two years of NHWS data were included for this project, with 25,000 respondents collected in 2010 and 30,000 in 2011, which were combined to provide a more robust sample size for analysis. Respondents who participated in the survey more than once were identified using an anonymous code provided by the survey panel, and in these cases, only the more recent response was included in the analyses. In addition to membership in the survey panel, respondents were required to read and write Japanese, be at least 18 years old, and provide informed consent. No personally-identifiable information is stored in the NHWS database, and respondents were assured that the information they provided would be confidential and reported only in the aggregate. The protocol and questionnaire for the NHWS were reviewed and approved by Essex Institutional Review Board, Inc. (Lebanon, NJ, USA). Only those respondents who indicated both a diagnosis of depression and physical pain (explained in more detail below) were included in the analysis.
Measures
Sociodemographic characteristics
Sociodemographic characteristics collected included respondents’ age, sex, marital status, household income category, and university education.
General health characteristics
Information regarding body mass index category, current cigarette smoking, use of alcohol, and whether or not the individual exercised in the prior month were collected. Comorbidity burden was summarized using the Charlson comorbidity index.30
Depression
The NHWS is a general health survey that includes questions on experience, diagnosis, and treatment of a broad variety of health conditions, including depression. Respondents were asked to indicate whether they had experienced depression in the prior 12 months. Those who indicated yes were then asked if their depression had been diagnosed by a doctor. Respondents who indicated a diagnosis by a doctor were considered to have depression and provided additional details including the year of diagnosis with depression, the type of physician who gave the diagnosis, and whether they were currently using a prescription medication for depression. As the survey relied on the self-report of diagnosis, clinical information such as the diagnostic criteria used was not included.
Depression symptoms
Depression symptoms/severity of depression was assessed using the Patient Health Questionnaire (PHQ-9).31 This is a validated self-report scale used to screen for depression and to assess its severity. Respondents indicated how frequently they had been bothered over the prior 2 weeks by anhedonia, depressed mood, sleep disturbance, lack of energy, appetite disturbance, negative self-feelings, difficulty concentrating, psychomotor retardation or agitation, and thoughts of self-harm. A single-item measure of the interference of these symptoms is also included. The total scale score was calculated, and the severity of depression was assigned according to the standard cutoff scores: 5, 10, 15, and 20 points for mild, moderate, moderately severe, and severe depression, respectively. The PHQ-9 was not included in the 2010 Japan NHWS, and so comparisons of depression severity using this instrument had a reduced sample size relative to other measures. Both the 2010 and 2011 surveys included a self-rating of depression as mild, moderate, or severe; the meaning of each level was open to the interpretation of the respondent, with no description or criteria provided. PHQ-9 severity ratings and self-ratings of depression severity were analyzed separately.
Painful physical symptoms
The NHWS asks respondents to indicate whether they have experienced pain in the 12 months preceding the survey; those who indicated experiencing pain were considered to have painful physical symptoms. In order to avoid attributing pain from obvious physical causes to painful symptoms associated with depression, respondents who reported pain caused by broken bones, cancer, dental problems, menstrual cycle, postherpetic neuralgia, surgery or a medical procedure, or phantom limb pain (neuropathic pain following amputation) were excluded from the analyses.
Frequency of problems with pain
Respondents were asked to indicate how frequently they had problems with pain. Response options were: daily, four to six times a week, two to three times a week, once a week, two to three times a month, or once a month or less often.
Severity of physical pain
Respondents with pain indicated the severity of their pain during the past week, and currently (“right now”). Ratings were made on a 0–10 scale anchored by “none” and “as bad as you can imagine.”
Health-related quality of life
The revised Medical Outcomes Study 12-Item Short Form Survey Instrument (SF-12v2) was used to measure HRQoL.32 This is a multipurpose, generic HRQoL instrument comprising 12 questions developed from the widely used SF-36v2. Two summary scores calculated from this measure were used: the physical component summary (PCS), an index of overall physical functioning, and the mental component summary (MCS) scores, which is an index of mental and emotional health. Scores can be interpreted relative to the population average of 50, with a standard deviation of 10, with higher scores indicating better HRQoL.
Responses to the SF-12v2 were also used to generate health state utilities according to the SF-6D algorithm, a preference-based, single index measure for health using general population values.33 The SF-6D index has interval scoring properties and yields summary scores on a theoretical 0–1 scale (with an empirical floor of 0.3). Higher scores indicate better (more preferred) health status, with 1 being equivalent to perfect health.
Work productivity and activity impairment
Work productivity was assessed using the Work Productivity and Activity Impairment (WPAI) questionnaire, which assesses absenteeism (work time missed), presenteeism (impairment while at work), overall work productivity impairment (a combination of absenteeism and presenteeism), and activity impairment (impairment in daily activities) due to health problems over the prior 7 days.34 All are reported as percentages, with higher numbers indicating greater impairment. Only respondents who reported being full-time or part-time employed provided data for absenteeism, presenteeism, and overall work impairment. All respondents provided data for activity impairment.
Health care resource use
Health care resource use is assessed in the NHWS as all-cause health care provider (HCP) visits, emergency room visits, and hospitalizations in the 6 months prior to the survey. HCP visits were calculated by summing the self-reported number of visits to specific types of HCPs (eg, general internist, psychiatrist, allergist, dentist, nurse, etc).
Analysis
Bivariate Spearman correlations were used to measure the strength of the relationship between the severity of pain and other outcomes. Because of this high correlation between the two pain ratings (rs=0.80) and the consistency between the recall period for the “past week” severity item and WPAI, only analysis of pain severity during the past week are presented. These were followed by regression analysis predicting each outcome using the severity of pain in the past week as well as variables widely understood to be associated with the one or more of the health outcomes under investigation: age, sex, marital status, household income, university education, body mass index category, cigarette smoking, alcohol use, exercise, length of depression diagnosis, and Charlson comorbidity index. Because of the skewed distribution of the WPAI metrics and health care resource data, these outcomes were modeled using generalized linear models specifying a negative binomial distribution and a log-link function. In order to facilitate interpretation, regression-estimated means were calculated at the mean of the covariates at specified levels of pain, allowing the magnitude of the relationship to be more immediately apparent than with the regression coefficients. The levels chosen were the first quartile (25th percentile) to represent those with below-average severity of pain within the sample, median (50th percentile) to represent those with an average level of pain within the sample, and third quartile (75th percentile) to represent those with above-average pain severity. A significance value of 0.05 was adopted for all null hypothesis tests; no adjustment was made for multiple comparisons.
Results
Sample characteristics
A total of 54,977 respondents participated in the survey across 2010 and 2011 (total response rate 20.5%), and of these 2,147 respondents indicated experiencing depression in the prior 12 months. Of these, 1,964 indicated a diagnosis of depression by a doctor. Four-hundred forty-one of these individuals also reported pain, but 89 were excluded due to the type of pain experienced. Therefore, 352 respondents with depression and comorbid pain were included in the analysis. Sociodemographic and health characteristics are presented in Table 1. The sample was 57% female, the average respondent was 41 years old, 58% were employed, 43% had completed a 4-year college degree or greater, and 45% reported being married or living with a partner. Respondent characteristics related to depression are presented in Table 2. Most (78%) were currently taking a prescription medication for depression, with a large majority (79%) reporting a diagnosis of depression by a psychiatrist. Almost half rated their depression as “moderate,” with a similar proportion rated as “moderate” or “moderately severe” according to the PHQ-9. Average length of depression diagnosis was 7 years. Approximately a quarter of the sample indicated that they were experiencing daily problems with pain, and an additional quarter of the sample experienced pain more than once per week; 41% were currently using a prescription pain medication (Table 3). Ratings of pain severity in the past week for the first, second (median), and third quartiles were 1/10, 4/10, and 7/10, respectively.
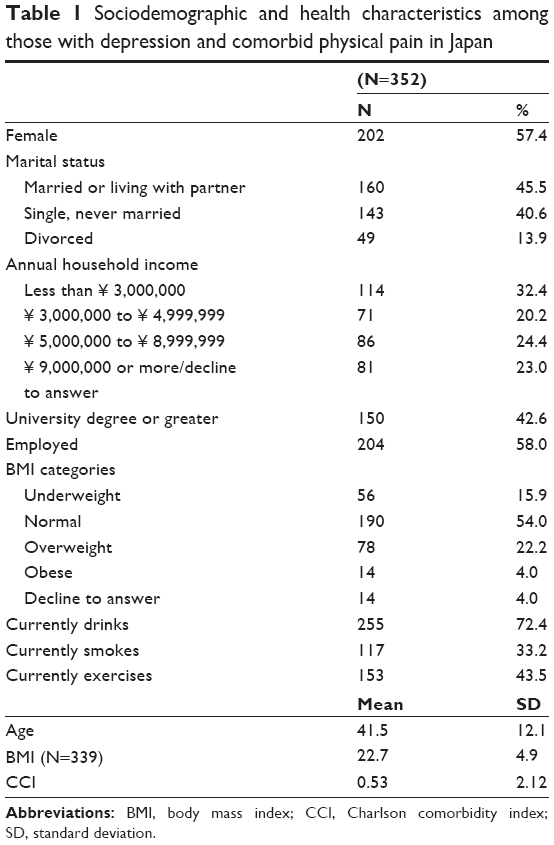 | Table 1 Sociodemographic and health characteristics among those with depression and comorbid physical pain in Japan |
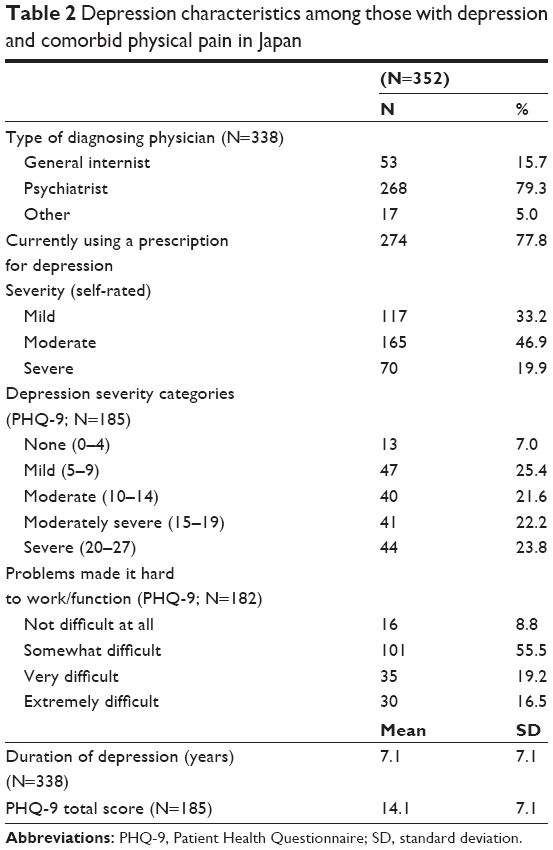 | Table 2 Depression characteristics among those with depression and comorbid physical pain in Japan |
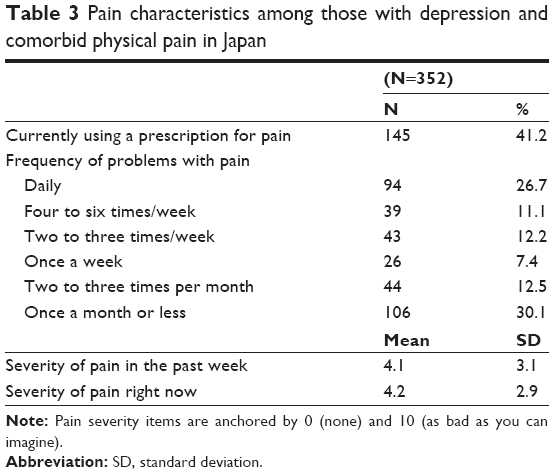 | Table 3 Pain characteristics among those with depression and comorbid physical pain in Japan |
Bivariate correlations
As noted above, the measures of severity for current pain and pain in the past week were highly correlated (rs=0.80, P<0.0001). Because of this high correlation and the consistency between the recall period for the WPAI and the “past week” severity item, only analysis of severity of pain during the past week are presented.
Spearman correlations between the respondents’ reported level of pain in the past week and HRQoL, PHQ-9 depression score, work and activity impairment, and health care resource use are presented in Table 4. More severe pain in the prior week was associated with worse outcomes for most of the assessments included in the NHWS, including HRQoL, work and activity impairment, and greater health care resource use, though correlations were small (all rs<0.30). Likewise, more severe physical pain was associated with more severe depression according to the PHQ-9 total score (rs=0.19, n=185, P<0.01).
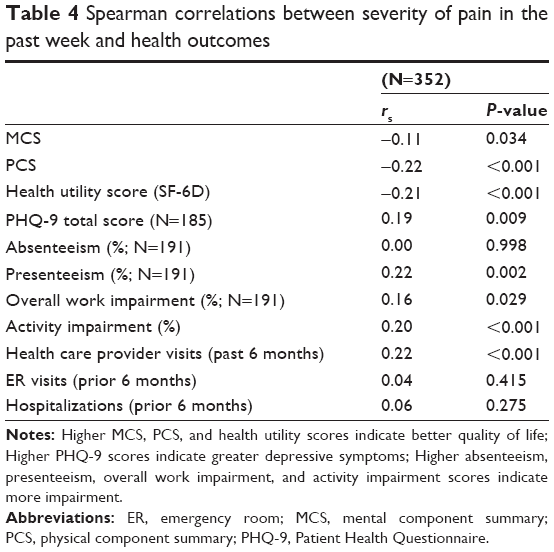 | Table 4 Spearman correlations between severity of pain in the past week and health outcomes |
Multivariable regression
The results indicate that greater severity of pain was associated with greater depression severity, lower HRQoL as measured by MCS, PCS, and health utility scores, greater presenteeism at work, more overall work impairment, greater activity impairment, more physician visits, more emergency room visits, and more hospitalizations. Regression-estimated means are presented in Table 5. The results indicate that, after accounting for covariates, those with higher levels of pain (75th percentile, 7 on a scale of 0–10) in the past week had 2.6-point lower MCS scores, 3.5-point lower PCS scores, and approximately 15% higher impairment while at work (presenteeism) and in daily activities relative to those with lower levels of pain (25th percentile, 1 on a scale of 0–10).
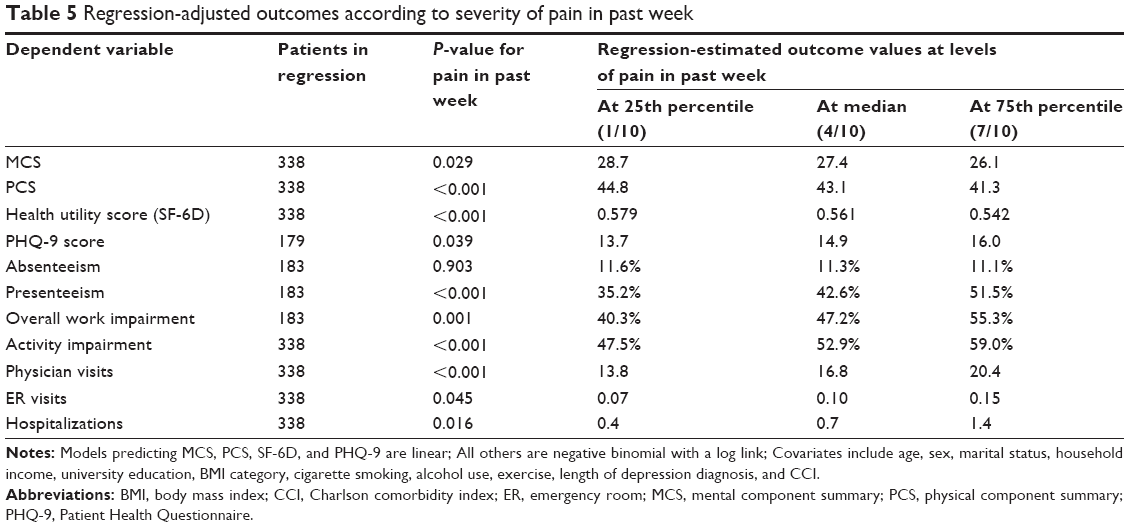 | Table 5 Regression-adjusted outcomes according to severity of pain in past week |
Discussion
The current study demonstrates that the severity of depression symptoms and other health outcomes are related to the severity of painful physical symptoms among individuals in Japan with diagnosed depression who report physical pain. While much of previous research has demonstrated a relationship between the presence of physical symptoms and worse outcomes, these analyses demonstrate that the extent of the burden is dependent upon the severity of the pain. A broad variety of health outcomes are impacted, including the depression itself, HRQoL, work productivity impairment, and health care resource use, and the present study is the first of which we are aware to report the impact on health utility and work productivity impairment among individuals with depression in Japan. The relationship between physical pain and outcomes remained significant after inclusion of a variety of potential confounds, including age, sex, education, level of income, length of diagnosis, and comorbidity burden.
Because the current study measured the relationship between a continuous measure of pain severity and outcomes, the magnitude of the differences in outcomes is not as straightforward to interpret as a comparison between groups. However, the difference in outcomes associated with the interquartile range provides some context beyond the significant P-values. These illustrate the difference in outcomes between those with below-average levels of pain (25th percentile) versus those with above-average pain (75th percentile) within the sample after taking into account potential confounds. The 2.6-point difference in MCS scores associated with the interquartile range of pain severity was slightly smaller than the 3-point threshold often considered the minimally important difference (MID).35 The 2.3-point difference in PHQ-9 depression severity scores equates to a Cohen’s d effect size of approximately 0.3, which has been put forward as one threshold for MID.36 Not surprisingly, the relationship between physical pain and PCS scores observed was clear, with the same difference in pain severity associated with a difference in PCS greater than the 3-point MID threshold. The 0.037-point difference observed in SF-6D utility scores is also significant, and similar to the 0.03 interval often considered the MID for that measure.37 Relative to those at the 25th percentile level of pain, those at the 75th percentile level of pain reported nearly 1.5 times the presenteeism according to the WPAI and 1.5 times the number of HCP visits.
Previous research in other East Asian countries exploring the relationship between painful physical symptoms and depression have found the prevalence of painful physical symptoms varied across countries, ranging from approximately 35% to 75% of patients depending on country.29 The lower proportion observed in this Japanese sample (22.5%) may or may not indicate a lower prevalence than other East Asian countries; respondents in the NHWS needed to indicate pain instead of meet a certain threshold on a pain scale, which may have resulted in omissions. Those studies focused on comparing individuals with depression with and without pain, and also employed different measures of depression severity and HRQoL.24,25,29,38 These differences make comparisons between the current analysis and previous studies difficult. Calculating Cohen’s d from results of the earlier studies indicates an effect size for the presence of painful physical symptoms in the range of 0.3 to 0.5 for both depression and health status, equal to or slightly stronger than the effect sizes reported above for the differences between those at the 25th and 75th percentile scores for pain severity. The consistent pattern of results across different measures for the same constructs demonstrates that the results are not dependent upon the specific measures of depression severity or HRQoL. The magnitude of the difference in outcomes associated with the interquartile range suggests that alleviating moderate painful physical symptoms may yield significant improvement across numerous outcomes, including depression symptoms, HRQoL, work impairment, and reduce use of health care services.
Like any study, the current analysis has important limitations. Details regarding the diagnosis of depression were not available; respondents included in this study indicated that they had been diagnosed by a doctor with depression, but neither the diagnosis nor the diagnostic criteria used could be confirmed. Though it was not possible to corroborate the reported diagnoses with medical records, the proportion of the sample reporting use of prescription medications for depression (78%) and the high prevalence of at least mild depression symptoms according to the PHQ-9 (93%) provide additional evidence that the vast majority of respondents included in the analysis suffer from depression. Likewise, the proportion of respondents reporting a diagnosis of depression in this sample (3.6%) is only slightly above that previously estimated for 12-month diagnosis of MDD, and within the 95% confidence interval.4 Nevertheless, it should be noted that depression as reported here does not necessarily indicate MDD. Similarly, the use of a validated pain scale may have provided for a more precise measurement of the severity of physical pain than the measure used in the NHWS. As measurement error tends to weaken the magnitude of relationships between variables, the correlation between severity of pain and outcomes may be stronger than reported here. The cross-sectional and correlational nature of the survey did not allow for assessment of the time course of the physical symptoms, and it is not clear whether individuals had painful physical symptoms at the onset of the emotional components of the depressive episode or whether the pain developed at another time. While the regression accounted for a number of measured potential confounders, it is possible that an unmeasured 3rd variable was responsible for some portion of the relationship observed between pain and outcomes. The lack of adjustment for multiple comparisons may have resulted in detection of spurious relationships. However, the relationships between pain severity and many of the outcomes investigated here are sufficiently strong that several would still be significant had a Bonferroni correction accounting for test of eleven outcomes been applied (critical P-value =0.0045).
In conclusion, greater severity of physical pain among depressed patients in Japan is associated with more severe depression, worse health outcomes, greater use of health care resources, and lower productivity. Therefore reducing the severity of pain in these patients, even if it is not entirely eliminated, may provide important benefits to those whose depression includes painful physical symptoms. Clinicians caring for these patients should take the presence and severity of physical pain into account and consider treating both the physical and emotional symptoms of depression.
Acknowledgments
The authors would like to acknowledge Tomomi Mori of Eli Lilly KK for her tireless administrative support throughout the duration of the project.
Author contributions
JV contributed to the design of the study, analyzed the data, participated in interpreting the results, and drafted the paper. TO participated in interpreting the results and revised the paper for intellectual content. WM contributed to the design of the study, participated in interpreting the results, and revised the paper for intellectual content. TT participated in interpreting the results and revised the paper for intellectual content. EH participated in interpreting the results, contributed to the design of the study, and revised the paper for intellectual content. All authors read and approved the final version of the manuscript for submission.
Disclosure
Eli Lilly KK and Shionogi & Co., Ltd., provided funds to Kantar Health for the analysis of the data and drafting of the manuscript. JV is an employee of Kantar Health. TO has received speaking fees from GlaxoSmithKline KK, Eli Lilly Japan KK, Pfizer Japan Inc., Otsuka Pharmaceutical Co., Ltd., Mochida Pharmaceutical Co., Ltd., and Mitsubishi Tanabe Pharma Corporation. WM and EH are employees of Eli Lilly and may own Eli Lilly stock. TT is an employee of Shionogi & Co., Ltd., and may own Shionogi & Co., Ltd., stock. The authors report no other conflicts of interest in this work.
References
Lépine JP, Briley M. The increasing burden of depression. Neuropsychiatr Dis Treat. 2011;7(Suppl 1):3–7. | ||
Regier DA, Shapiro S, Kessler LG, Taube CA. Epidemiology and health service resource allocation policy for alcohol, drug abuse, and mental disorders. Public Health Rep. 1984;99(5):483–492. | ||
Ustün TB, Ayuso-Mateos JL, Chatterji S, Mathers C, Murray CJ. Global burden of depressive disorders in the year 2000. Br J Psychiatry. 2004;184:386–392. | ||
Kawakami N, Takeshima T, Ono Y, et al. Twelve-month prevalence, severity, and treatment of common mental disorders in communities in Japan: preliminary finding from the World Mental Health Japan Survey 2002–2003. Psychiatry Clin Neurosci. 2005;59(4):441–452. | ||
Kessler RC, Angermeyer M, Anthony JC, et al. Lifetime prevalence and age-of-onset distributions of mental disorders in the World Health Organization’s World Mental Health Survey Initiative. World Psychiatry. 2007;6(3):168–176. | ||
Okumura Y, Higuchi T. Cost of depression among adults in Japan. Prim Care Companion CNS Disord. 2011:13(3). | ||
Reid KJ, Harker J, Bala MM, et al. Epidemiology of chronic non-cancer pain in Europe: narrative review of prevalence, pain treatments and pain impact. Curr Med Res Opin. 2011;27(2):449–462. | ||
Engel CC, von Korff M, Katon WJ. Back pain in primary care: predictors of high health-care costs. Pain. 1996;65(2–3):197–204. | ||
Von Korff M, Ormel J, Keefe FJ, Dworkin SF. Grading the severity of chronic pain. Pain. 1992;50(2):133–149. | ||
Holroyd KA, Stensland M, Lipchik GL, Hill KR, O’Donnell FS, Cordingley G. Psychosocial correlates and impact of chronic tension-type headaches. Headache. 2000;40(1):3–16. | ||
Ohayon MM, Schatzberg AF. Chronic pain and major depressive disorder in the general population. J Psychiatr Res. 2010;44(7):454–461. | ||
Arola HM, Nicholls E, Mallen C, Thomas E. Self-reported pain interference and symptoms of anxiety and depression in community-dwelling older adults: can a temporal relationship be determined? Eur J Pain. 2010;14(9):966–971. | ||
Emptage NP, Sturm R, Robinson RL. Depression and comorbid pain as predictors of disability, employment, insurance status, and health care costs. Psychiatr Serv. 2005;56(4):468–474. | ||
Robinson MJ, Edwards SE, Iyengar S, Bymaster F, Clark M, Katon W. Depression and pain. Front Biosci (Landmark Ed). 2009;14: 5031–5051. | ||
Arnow BA, Hunkeler EM, Blasey CM, et al. Comorbid depression, chronic pain, and disability in primary care. Psychosom Med. 2006; 68(2):262–268. | ||
Bao Y, Sturm R, Croghan TW. A national study of the effect of chronic pain on the use of health care by depressed persons. Psychiatr Serv. 2003;54(5):693–697. | ||
Chung KF, Tso KC, Yeung WF, Li WH. Quality of life in major depressive disorder: the role of pain and pain catastrophizing cognition. Compr Psychiatry. 2012;53(4):387–395. | ||
Kassam A, Patten SB. Major depression, fibromyalgia and labour force participation: a population-based cross-sectional study. BMC Musculoskelet Disord. 2006;7:4. | ||
Greenberg PE, Leong SA, Birnbaum HG, Robinson RL. The economic burden of depression with painful symptoms. J Clin Psychiatry. 2003;64(Suppl 7):17–23. | ||
Watson L, Baird J, Hösel V, Peveler R. The effect of concurrent pain on the management of patients with depression: an analysis of NHS healthcare resource utilisation using the GPRD database. Int J Clin Pract. 2009;63(5):698–706. | ||
Zhu B, Zhao Z, Ye W, Marciniak MD, Swindle R. The cost of comorbid depression and pain for individuals diagnosed with generalized anxiety disorder. J Nerv Ment Dis. 2009;197(2):136–139. | ||
Otsubo T, Nakahara N, Cai Z, et al. The comorbidity of depression and pain disorders: a retrospective claims study in Japan. Diagnosis and Treatment. 2012;100:171–178. Japanese. | ||
Kroenke K, Shen J, Oxman TE, Williams JW Jr, Dietrich AJ. Impact of pain on the outcomes of depression treatment: results from the RESPECT trial. Pain. 2008;134(1–2):209–215. | ||
Ang QQ, Wing YK, He Y, et al. Association between painful physical symptoms and clinical outcomes in East Asian patients with major depressive disorder: a 3-month prospective observational study. Int J Clin Pract. 2009;63(7):1041–1049. | ||
Novick D, Montgomery W, Kadziola Z, et al. Do concomitant pain symptoms in patients with major depression affect quality of life even when taking into account baseline depression severity? Patient Prefer Adherence. 2013;7:463–470. | ||
Novick D, Montgomery W, Aquado J, et al. Which somatic symptoms are associated with an unfavorable course in Asian patients with major depressive disorder? J Affect Disord. 2013;149(1–3):182–188. | ||
Kawamura A, Shimodera S, Furukawa TA, et al. Effect of depression-related somatic pain on treatment satisfaction and daily living functions. Int J Psychiatry Med. 2013;46(1):27–38. | ||
Terauchi M, Hiramitsu S, Akiyoshi M, et al. Associations among depression, anxiety and somatic symptoms in peri- and postmenopausal women. J Obstet Gynaecol Res. 2013;39(5):1007–1013. | ||
Lee P, Zhang M, Hong JP, et al. Frequency of painful physical symptoms with major depressive disorder in asia: relationship with disease severity and quality of life. J Clin Psychiatry. 2009;70(1):83–91. | ||
Charlson ME, Pompei P, Ales KL, MacKenzie CR. A new method of classifying prognostic comorbidity in longitudinal studies: development and validation. J Chronic Dis. 1987;40(5):373–383. | ||
Kroenke K, Spitzer RL, Williams JB. The PHQ-9: validity of a brief depression severity measure. J Gen Intern Med. 2001;16(9):606–613. | ||
Ware JE, Kosinski M, Turner-Bowker DM, Gandek B. How to Score Version 2 of the SF-12 Health Survey (with a Supplement Documenting version 1). 2002, Lincoln, RI: QualityMetric Inc. | ||
Brazier JE, Roberts J. The estimation of a preference-based measure of health from the SF-12. Med Care. 2004;42(9):851–859. | ||
Reilly MC, Zbrozek AS, Dukes EM. The validity and reproducibility of a work productivity and activity impairment instrument. Pharmacoeconomics. 1993;4:353–365. | ||
Maruish ME (Ed). User’s Manual for the SF-36v2® Health Survey. 3rd ed. Lincoln, RI: QualityMetric Incorporated; 2011. | ||
Farivar SS, Liu H, Hays RD. Half standard deviation estimate of the minimally important difference in HRQOL scores? Expert Rev of Pharmacoecon Outcomes Res. 2004;4(5):515–523. | ||
Walters SJ, Brazier JE. What is the relationship between the minimally important difference and health state utility values? The case of the SF-6D. Health Qual Life Outcomes. 2003;1:4. | ||
Li HC, Zhang MY, Wang G, et al. Association between painful physical symptoms and clinical outcomes in Chinese patients with major depressive disorder: a three-month observational study. Chin Med J (Engl). 2010;123(15):2063–2069. |
 © 2015 The Author(s). This work is published and licensed by Dove Medical Press Limited. The full terms of this license are available at https://www.dovepress.com/terms.php and incorporate the Creative Commons Attribution - Non Commercial (unported, v3.0) License.
By accessing the work you hereby accept the Terms. Non-commercial uses of the work are permitted without any further permission from Dove Medical Press Limited, provided the work is properly attributed. For permission for commercial use of this work, please see paragraphs 4.2 and 5 of our Terms.
© 2015 The Author(s). This work is published and licensed by Dove Medical Press Limited. The full terms of this license are available at https://www.dovepress.com/terms.php and incorporate the Creative Commons Attribution - Non Commercial (unported, v3.0) License.
By accessing the work you hereby accept the Terms. Non-commercial uses of the work are permitted without any further permission from Dove Medical Press Limited, provided the work is properly attributed. For permission for commercial use of this work, please see paragraphs 4.2 and 5 of our Terms.