")
Back to Journals » Clinical Ophthalmology » Volume 8
Assessment of β-zone peripapillary atrophy by optical coherence tomography and scanning laser ophthalmoscopy imaging in glaucoma patients
Authors Seidensticker F, Reznicek L, Mann T, Hübert I, Kampik A, Ulbig M, Hirneiss C, Neubauer A, Kernt M
Received 10 October 2013
Accepted for publication 20 November 2013
Published 27 June 2014 Volume 2014:8 Pages 1233—1239
DOI https://doi.org/10.2147/OPTH.S55751
Checked for plagiarism Yes
Review by Single anonymous peer review
Peer reviewer comments 3
Florian Seidensticker,1,* Lukas Reznicek,2,* Thomas Mann,2 Irene Hübert,2 Anselm Kampik,2 Michael Ulbig,2 Christoph Hirneiss,2 Aljoscha S Neubauer,2 Marcus Kernt2
1Department of Ophthalmology, Hannover Medical School, Hannover, Germany; 2Department of Ophthalmology, Ludwig-Maximilians-University, Munich, Germany
*These authors have contributed equally to this work
Purpose: To assess β-zone peripapillary atrophy (β-PPA) using spectral domain optical coherence tomography (SD-OCT), scanning laser ophthalmoscopy (SLO), and fundus autofluorescence (FAF) imaging in patients with primary open-angle glaucoma with advanced glaucomatous visual field defects.
Methods: A consecutive, prospective series of 82 study eyes with primary open-angle glaucoma were included in this study. All study participants underwent a full ophthalmic examination followed by SD-OCT, wide-field SLO, and FAF imaging of the optic nerve head and the peripapillary region.
Results: Eighty-four glaucomatous eyes were included in our prospective study. Correlation analyses for horizontally and vertically obtained β-PPA for all three imaging modalities (color SLO, FAF, and SD-OCT) revealed highest correlations between FAF and color SLO (Pearson correlation coefficient: 0.904 [P<0.001] for horizontal β-PPA and 0.786 [P<0.001] for vertical β-PPA). Bland–Altman plotting revealed highest agreements between color SLO and FAF, with −2.1 pixels ±1.96 standard deviation (SD) for horizontal β-PPA, SD: 10.5 pixels and 2.4 pixels ±1.96 SD for vertical β-PPA.
Conclusion: β-PPA can be assessed using en-face SLO and cross-sectional SD-OCT imaging. Correlation analyses revealed highest correlations between color SLO and FAF imaging, while correlations between SLO and SD-OCT were weak. A more precise structural definition of β-PPA is needed.
Keywords: fundus autofluorescence, FAF, OCT, SD-OCT, SLO, glaucomatous optic neuropathy
Introduction
Presence, size, and enlargement of β-zone peripapillary atrophy (β-PPA) assessed by color images of the fundus have been demonstrated to be associated with glaucomatous optic neuropathy and its progression.1,2 Features of β-PPA are marked atrophy of the retinal pigment epithelium (RPE) and the choriocapillaris, good visibility of the large choroidal vessels and the sclera, thinning of the chorioretinal tissues, and a round demarcation to its adjacent structures.3 In this context, a breakdown of the blood–optic nerve barrier together with reduced blood supply have been considered to contribute to optic nerve head (ONH) damage and glaucoma progression.4 This correlation appears even more conclusive, as the association between the presence of β-PPA and glaucoma progression have been demonstrated in ocular hypertension and open-angle glaucoma.5 Furthermore, eyes with β-PPA have been shown to have a more rapid visual field progression than eyes without it.5,6
Due to the efforts to diagnose and follow up diseases not only earlier but also in a more objective manner, various new computerized imaging technologies such as optical coherence tomography (OCT), fundus autofluorescence (FAF), and scanning laser ophthalmoscopy (SLO) have been developed over the past decade attempting to quantitatively analyze progressive structural changes in various diseases of the posterior fundus.
Recently, the non-mydriatic two-laser wavelength wide-field SLO Optomap (Optomap P200Tx; Optos PLC, Dunfermline, Fife, Scotland) has been developed using two scanning laser wavelengths, green (532 nm) and red (633 nm), obtaining wide-field semi-realistic composite color or FAF images.7–9 Previously published studies on patients with posterior uveitis have revealed a more precise and accurate depiction of chorioretinal alterations affecting the RPE.10
Recent development of high resolution, high speed spectral domain OCT (SD-OCT) enables the visualization of the RPE and optic nerve complex with a resolution almost comparable to that in histologic analyses.11 A considerable number of studies regarding the capability of SD-OCT for diagnosis and follow-up of glaucoma patients have been published.12–15
The aim of this study was to quantitatively analyze the β-PPA in glaucomatous eyes obtained with green-light FAF and SD-OCT and compare those findings to SLO-based en face color images.
Patients and methods
Patients
A consecutive, prospective series of 82 study eyes, mean age 64 years (range: 35–86 years), with primary open-angle glaucoma (POAG), advanced glaucomatous visual field defects, and a β-PPA with an extension of at least 200 μm were included in this study (47 female and 35 male, 42 right and 40 left eyes). POAG was defined as clinically glaucomatous excavation of the optic disc, with an open chamber angle, glaucomatous visual field defects, and elevated intraocular pressure.
All study participants underwent a full ophthalmic examination including best-corrected visual acuity in decimals obtained with a Snellen projection chart, objective and subjective refraction, slit-lamp biomicroscopy, intraocular pressure measurement with Goldmann applanation tonometry, gonioscopy, and fundus examination by indirect ophthalmoscopy.
Each included patient underwent visual field testing followed by SD-OCT for cross-sectional ONH scans, followed by wide-field color and FAF images (Optos PLC).
Only eyes suffering from POAG were included, defined by a documented history of elevated intraocular pressure, characteristic ONH damage, and/or characteristic visual field defects. Exclusion criteria were any evidence for ONH degeneration derived from any other subtype of glaucoma than POAG, optic neuropathy of any other reason, diabetic retinopathy, macular disease, posterior uveitis, or retinal surgery.
All research was conducted in accordance with institutional guidelines and board approval and conformed to the tenets of the World Medical Association Declaration of Helsinki.
SD-OCT measurements
Conventional 4 mm long predefined ONH cross-sectional horizontal and vertical scans covering the β-PPA were obtained from each included study eye with “Spectralis” SD-OCT (Heidelberg Engineering, Heidelberg, Germany), with an excitation wavelength of 870 nm running at a speed of 40,000 A-scans per second.
Optomap imaging
Optomap imaging was performed without pupil dilation. Optomap imaging consisted of taking several images and saving the best image of each included eye for grading. The device takes one image in approximately 0.25 seconds, thus avoiding motion artifacts. Total scanning time was about 3–5 minutes, which included patient positioning, and was performed by an experienced technician (TM). Basic operation of the Optomap for ultra wide-field composite color fundus images is a scanning laser ophthalmoscope with two laser wavelengths scanning at 532 nm (“green laser separation”) and 633 nm (“red laser separation”). The optical resolution was 3,900–3,072 pixels, resulting in approximately 17–20 pixels per degree. Additional wide-field FAF images were obtained with an excitation wave length of 532 nm, and autofluorescence was detected by a broad band detector at 540–800 nm as described in previously published works.8,10
Measurement and correlation of β-PPA
For further analysis, the horizontal and vertical diameter (in pixels) through the center of the ONH, including and excluding the β-PPA, of each study eye were measured with the built-in measurement software using the SLO color as well as FAF images and OCT cross-sectional scans (Figure 1).
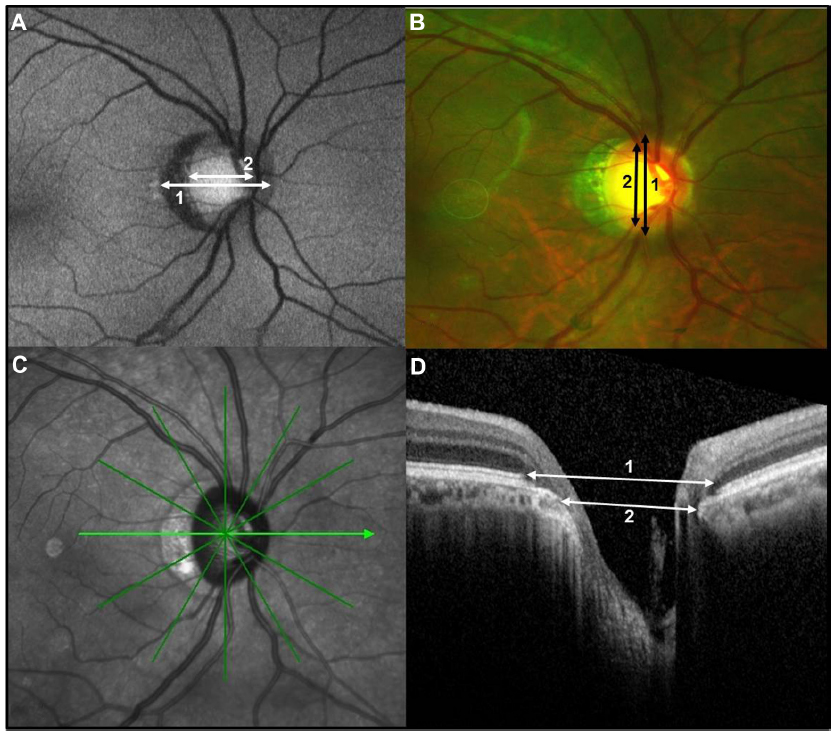 | Figure 1 FAF (A), color SLO (B), en-face infrared (C) image of and SD-OCT cross-sectional scan (D) through the ONH of the right eye of a 78-year-old male patient with primary open-angle glaucoma and β-PPA. For exemplary horizontal diameter 1 (ONH + β-PPA) and diameter 2 (ONH only) for FAF image (A) and SD-OCT cross-sectional scan (D) and vertical diameter 1 and 2 for color SLO image (B). |
For semi-quantification of the horizontal and vertical β-PPA, we calculated the difference in pixels between each horizontal as well as vertical diameter including the β-PPA (diameter 1, Figure 1) and the diameter at the corresponding location excluding the β-PPA (diameter 2, Figure 1) for each obtained imaging mode using a MATLAB-based standalone software (MATLAB 7.0 R14, Mathworks Inc., Natick, MA, USA). For SD-OCT cross-sectional scans, we measured the ONH (diameter 2) from/to Bruch’s membrane opening and ONH including β-PPA (diameter 1) from/to intact RPE and IS/OS (inner segment/outer segment) layer (Figure 1D).
Statistical analysis
Data were collected and analyzed using SPSS (IBM Corporation, Armonk, NY, USA) software, version 19.0. A P-value of <0.05 was considered as statistically significant. Univariate parametric analyses were applied.
Results
Eighty-four glaucomatous eyes were included in our prospective study. Patients’ characteristics are displayed in Table 1.
 | Table 1 Patients’ characteristics (n=84) |
Mean horizontal and vertical ONH diameter excluding the β-PPA and mean horizontal and vertical β-PPA for each imaging mode (color SLO, FAF, and SD-OCT) can be seen in Figure 2A and B.
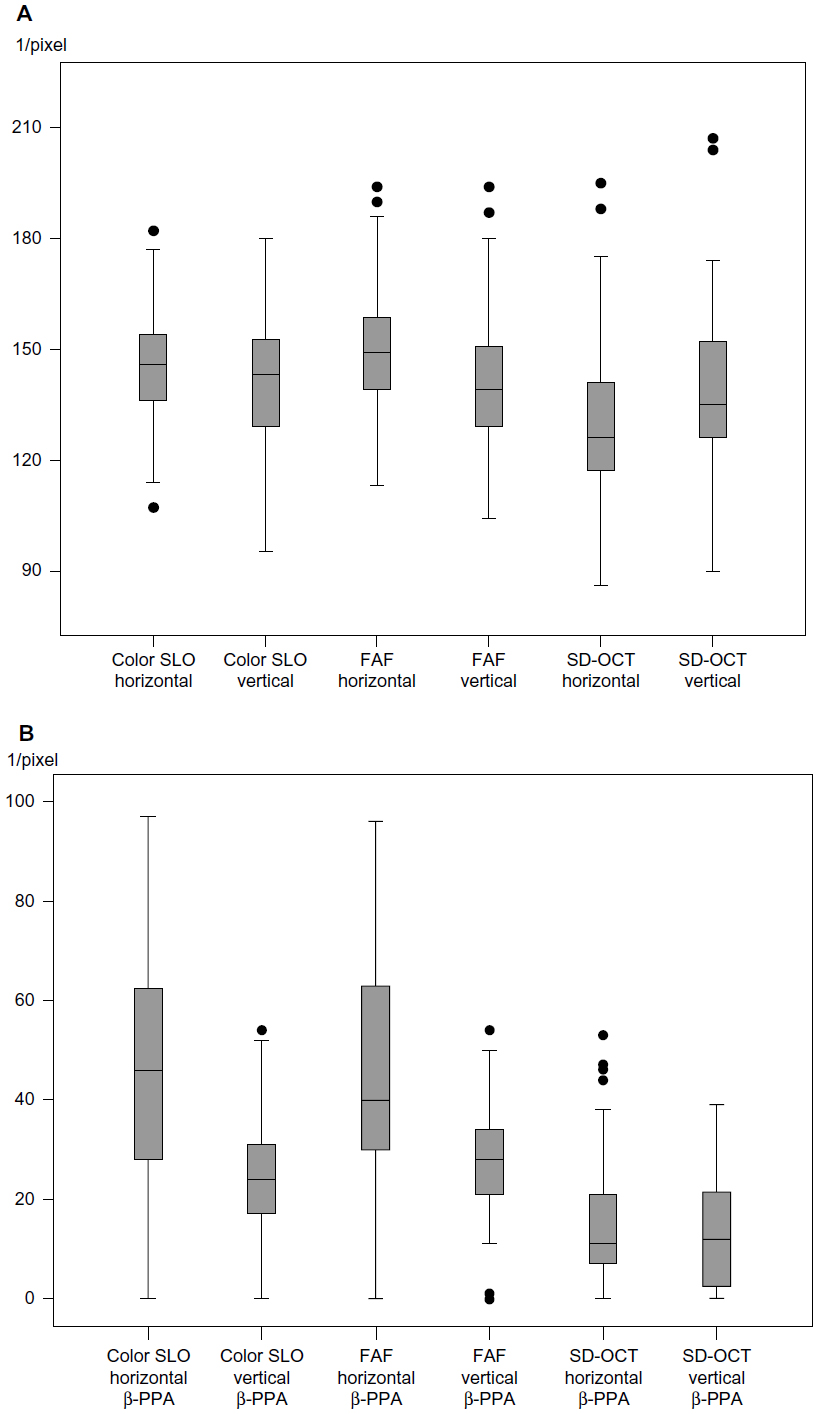 | Figure 2 Mean horizontal/vertical diameters of the optic nerve head (rim to rim) excluding the β-PPA (A) and of β-PPA (B) for color SLO and FAF images and SD-OCT cross-sectional scans. |
Correlation analyses for horizontally and vertically obtained β-PPA for all three imaging modalities (color SLO, FAF, and SD-OCT) can be seen in Table 2, revealing highest correlations between FAF and color SLO. A subgroup analysis revealed a significantly (P<0.001) larger vertical β-PPA in FAF compared with color SLO images (26.8 pixels ±12.55 standard deviation [SD] for FAF, and 24.4 pixels ±13.00 SD for color SLO).
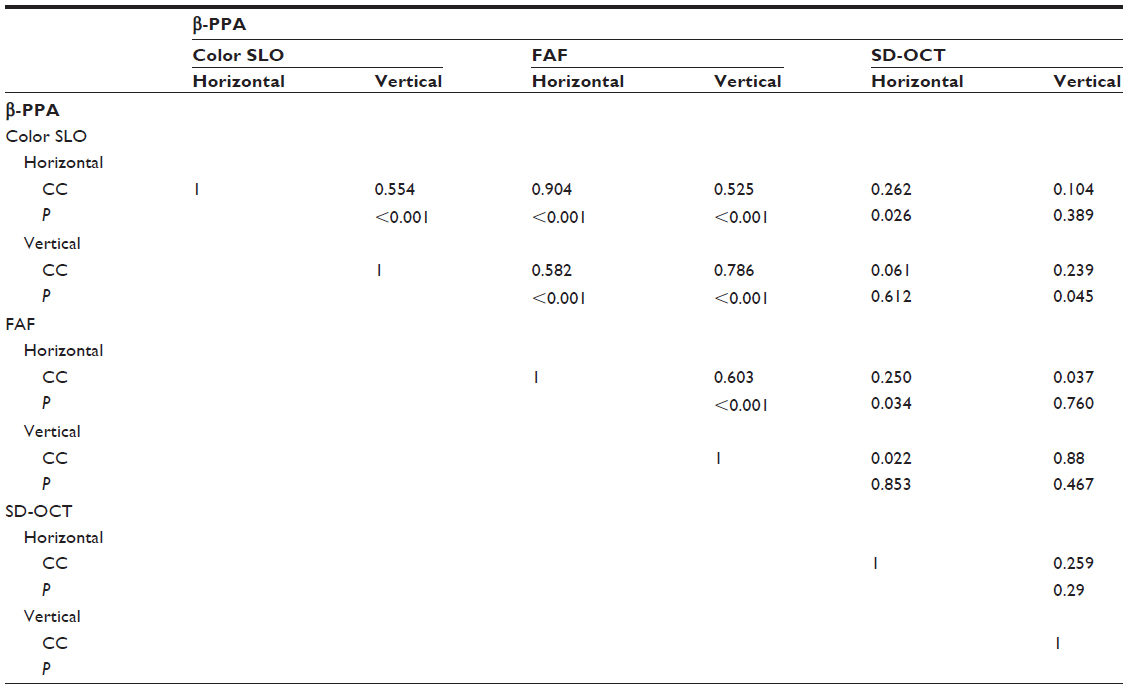 | Table 2 Correlation analyses (Pearson correlation) for horizontal and vertical β-PPA obtained with color SLO, FAF, and SD-OCT |
Bland–Altman plotting revealed highest agreements between color SLO and FAF (−2.1 pixels ±1.96 SD for horizontal β-PPA, SD: 10.5 pixels and 2.4 pixels ±1.96 SD for vertical β-PPA, SD: 8.4 pixels) (Figure 3A and B). Bland–Altman agreements between FAF and OCT were weaker (29.3 pixels ±1.96 SD for horizontal β-PPA, SD: 23.3 pixels, and 13.3 pixels ±1.96 SD for vertical β-PPA, SD: 15.7 pixels), and weakest between color SLO and OCT (30.3 pixels ±1.96 SD for horizontal β-PPA, SD: 23.9 pixels and 10.6 pixels ±1.96 SD for vertical β-PPA, SD: 15.1 pixels).
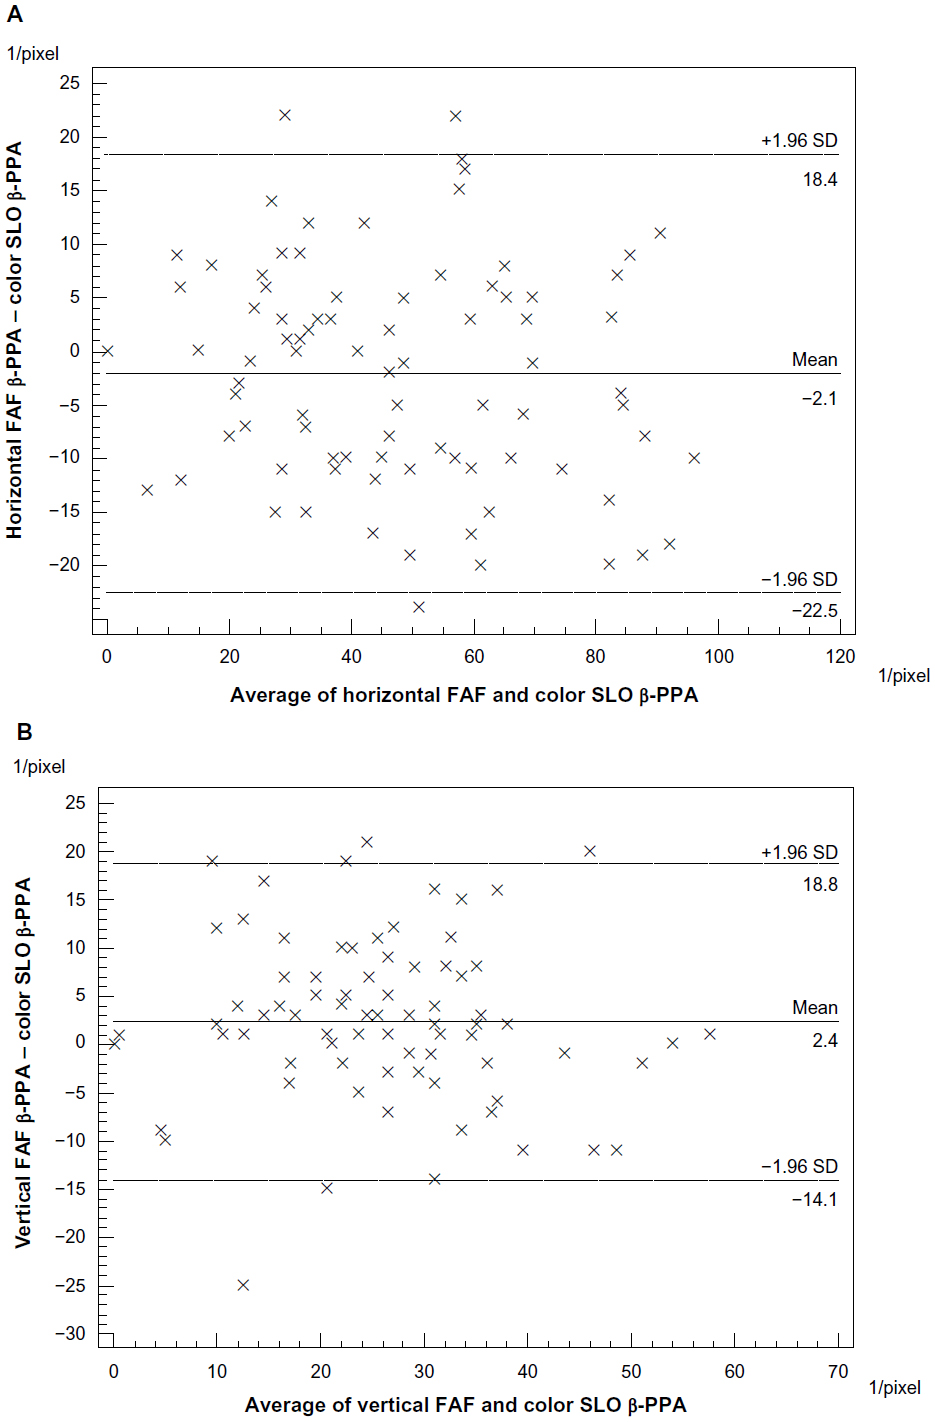 | Figure 3 Bland–Altman plots. (A) Horizontal FAF β-PPA to horizontal color SLO β-PPA, obtained with FAF and color SLO. The 95% CI (±1.96 SD) lies between 18.4 pixels and −22.5 pixels; mean difference is −2.1 pixels. (B) Vertical FAF β-PPA to vertical color SLO β-PPA, obtained with FAF and color SLO, the 95% CI (±1.96 SD) lies between 18.8 pixels and −14.1 pixels; mean difference is 2.4 pixels. |
Discussion
In this study, for the first time, a quantitative evaluation of β-PPA extension detected by “green” (532 nm) FAF imaging has been conducted. We found that the size of β-PPA as measured by FAF correlated well with SLO color imaging. Both en-face visualizations seem to reliably depict the margins of peripapillary RPE atrophy and may serve as additional follow-up parameters in glaucoma patients over time. This observation supports the results of a previously published work on patients with posterior uveitis, suggesting “green” FAF to be a suitable imaging tool to precisely depict RPE alterations in uveitis patients, since “green” FAF is supposed to be more sensitive in detecting RPE alterations or atrophy such as chorioretinal uveitic alterations of peripapillary atrophy in glaucomatous eyes.10,16–18 Interestingly, measurements obtained by OCT – a high resolution imaging technique providing a more accurate description of the peripapillary micro-structural anatomy19,20 – showed only a weak correlation with SLO color imaging and FAF. These data indicate that FAF may provide valuable properties for evaluation of PPA in glaucoma patients. The discrepancy between the imaging of β-PPA using cross-sectional SD-OCT scans and the clinical/SLO based en-face visualization of β-PPA margins might be due to the highly variable SD-OCT-based measurements of formations of the photoreceptor degeneration or atrophy peripheral and adjacent to clinically visible β-PPA in eyes with glaucoma. On the other hand, in the presented data, the RPE border did not always correspond to the clinical β-PPA margin, which might indicate that the clinical en-face visualized β-PPA was not completely denuded of RPE. Therefore, in the context of glaucoma and β-PPA, the anatomy of the peripapillary retina including β-PPA should probably be redefined – especially for high resolution cross-sectional SD-OCT scans – to include more precise definitions and landmarks.
A limit of our study is the fact that due to its cross-sectional character, we do not have longitudinal data from over the course of β-PPA development and are not able to predict any developments in glaucoma patients with β-PPA.
In summary, we were able to measure β-PPA using color SLO, FAF, and SD-OCT imaging. Correlation analyses revealed high correlations between SLO color and FAF imaging with larger vertical β-PPA in FAF images, while correlations between SLO and SD-OCT were weak. FAF seems to be a precise measurement tool for RPE alterations seen in β-PPA. A more precise structural definition of β-PPA is needed.
Disclosure
The authors do not have any commercial interest in any of the materials and methods used in this study.
References
Jonas JB. Clinical implications of peripapillary atrophy in glaucoma. Curr Opin Ophthalmol. 2005;16:84–88. | |
Wilensky JT, Kolker AE. Peripapillary changes in glaucoma. Am J Ophthalmol. 1976;81:341–345. | |
Jonas JB, Fernandez MC, Naumann GO. Glaucomatous parapapillary atrophy. Occurrence and correlations. Arch Ophthalmol. 1992;110946214–222. | |
Jonas JB, Naumann GO. Parapapillary chorioretinal atrophy in normal and glaucoma eyes. II. Correlations. Invest Ophthalmol Vis Sci. 1989;30946919–926. | |
Rockwood EJ, Anderson DR. Acquired peripapillary changes and progression in glaucoma. Graefes Arch Clin Exp Ophthalmol. 1988;226946510–515. | |
Teng CC, De Moraes CG, Prata TS, Tello C, Ritch R, Liebmann JM. Beta-zone parapapillary atrophy and the velocity of glaucoma progression. Ophthalmology. 2010;117:909–915. | |
Kernt M, Cserhati S, Seidensticker F, et al. Improvement of diabetic retinopathy with intravitreal ranibizumab. Diabetes Res Clin Pract. 2013;100:e11–e13. | |
Reznicek L, Dabov S, Haritoglou C, Kampik A, Kernt M, Neubauer AS. Green-light fundus autofluorescence in diabetic macular edema. Int J Ophthalmol. 2013;6:75–80. | |
Reznicek L, Wasfy T, Stumpf C, et al. Peripheral fundus autofluorescence is increased in age-related macular degeneration. Invest Ophthalmol Vis Sci. 2012;53:2193–2198. | |
Reznicek L, Kernt M, Seidensticker F, et al. Autofluorescence in posterior uveitis. Ophthalmology. 2012;119:1712–1713. e1713. | |
Hu Z, Abramoff MD, Kwon YH, Lee K, Garvin MK. Automated segmentation of neural canal opening and optic cup in 3D spectral optical coherence tomography volumes of the optic nerve head. Invest Ophthalmol Vis Sci. 2010;51:5708–5717. | |
Savini G, Carbonelli M, Barboni P. Spectral-domain optical coherence tomography for the diagnosis and follow-up of glaucoma. Curr Opin Ophthalmol. 2011;22:115–123. | |
Garvin MK, Lee K, Burns TL, Abramoff MD, Sonka M, Kwon YH. Reproducibility of SD-OCT-based ganglion-cell-layer thickness in glaucoma using two different segmentation algorithms. Invest Ophthalmol Vis Sci. 2013;54(10):6998–7004. | |
Shin JW, Uhm KB, Seo S. Quantitative analysis of localized retinal nerve fiber layer defects using spectral domain optical coherence tomography. J Glaucoma. Epub August 21, 2013. | |
Mayama C, Saito H, Hirasawa H, et al. Circle- and grid-wise analyses of peripapillary nerve fiber layers by spectral domain optical coherence tomography in early-stage glaucoma. Invest Ophthalmol Vis Sci. 2013;54:4519–4526. | |
Hammer M, Konigsdorffer E, Liebermann C, et al. Ocular fundus auto-fluorescence observations at different wavelengths in patients with age-related macular degeneration and diabetic retinopathy. Graefes Arch Clin Exp Ophthalmol. 2008;246:105–114. | |
Schweitzer D, Hammer M, Schweitzer F, et al. In vivo measurement of time-resolved autofluorescence at the human fundus. J Biomed Opt. 2004;9:1214–1222. | |
Reznicek L, Seidensticker F, Stumpf C, et al. Systematic analysis of wide-field fundus autofluorescence (FAF) imaging in posterior uveitis. Curr Eye Res. Epub October 21, 2013. | |
Sigler EJ, Mascarenhas KG, Tsai JC, Loewen NA. Clinicopathologic correlation of disc and peripapillary region using SD-OCT. Optom Vis Sci. 2013;90:84–93. | |
Hayashi K, Tomidokoro A, Lee KY, et al. Spectral-domain optical coherence tomography of beta-zone peripapillary atrophy: influence of myopia and glaucoma. Invest Ophthalmol Vis Sci. 2012;53:1499–1505. |
 © 2014 The Author(s). This work is published and licensed by Dove Medical Press Limited. The full terms of this license are available at https://www.dovepress.com/terms.php and incorporate the Creative Commons Attribution - Non Commercial (unported, v3.0) License.
By accessing the work you hereby accept the Terms. Non-commercial uses of the work are permitted without any further permission from Dove Medical Press Limited, provided the work is properly attributed. For permission for commercial use of this work, please see paragraphs 4.2 and 5 of our Terms.
© 2014 The Author(s). This work is published and licensed by Dove Medical Press Limited. The full terms of this license are available at https://www.dovepress.com/terms.php and incorporate the Creative Commons Attribution - Non Commercial (unported, v3.0) License.
By accessing the work you hereby accept the Terms. Non-commercial uses of the work are permitted without any further permission from Dove Medical Press Limited, provided the work is properly attributed. For permission for commercial use of this work, please see paragraphs 4.2 and 5 of our Terms.