")
Back to Archived Journals » International Journal of Wine Research » Volume 7
Assessing the adaptive capacity of the Ontario wine industry for climate change adaptation
Authors Pickering K, Plummer R, Shaw T, Pickering G
Received 6 September 2014
Accepted for publication 7 November 2014
Published 5 March 2015 Volume 2015:7 Pages 13—27
DOI https://doi.org/10.2147/IJWR.S73861
Checked for plagiarism Yes
Review by Single anonymous peer review
Peer reviewer comments 3
Editor who approved publication: Dr Roger Pinder
Video abstract presented by Kerrie Pickering
Views: 322
Kerrie Pickering,1 Ryan Plummer,1,2 Tony Shaw,3,4 Gary Pickering1,4,5
1Environmental Sustainability Research Centre, Brock University, St Catharines, ON, Canada; 2Stockholm Resilience Centre, Stockholm University, Stockholm, Sweden; 3Department of Geography, 4Cool Climate Oenology and Viticulture Institute, 5Department of Psychology, Brock University, St Catharines, ON, Canada
Background: Wine regions throughout the world are experiencing climate change characterized by the gradual alterations in growing seasons, temperature, precipitation, and the occurrences of extreme weather events that have significant consequences for quality wine production. Adapting to these new challenges depends largely on the present and future adaptive capacity of the grape growers, winemakers, and supporting institutions in order to minimize the impacts of climate change on grape yield and wine quality. Accordingly, the objective of this study was to develop a conceptual framework for assessing the adaptive capacity of a grape or wine region and apply it in the context of the Ontario wine industry. The framework consists of a three tiered structure, comprising eight operational and strategic determinants (financial, institutional, technological, political, knowledge, perception, social capital, and diversity). A comprehensive questionnaire was created from this framework consisting of 26 statements to which participants indicated their level of agreement. A total of 42 Ontario wine industry members completed the questionnaire via an on line survey.
Results: The determinants related to perception, diversity, and knowledge have the highest degree of capacity, while political and technological determinants show the least. Overall, stakeholders are aware of both negative and positive impacts climate change could have on wine production. Results are discussed to explore opportunities to enhance adaptive capacity in the grape/wine community. Many stakeholders have already incorporated new adaptive technologies into present practices and are interested in learning new skills to assist in future adaptation.
Keywords: climate change, adaptation, wine, Ontario
Introduction
Climate change is impacting the international wine industry.1–4 Adapting to present and future climatic challenges and opportunities are dependent upon a wine region’s adaptive capacity (ability to adapt). Adaptive capacity encompasses multiple elements necessary for adaptation to occur, including financial resources, institutional support, political support, new technologies, knowledge, diversification, beliefs, and social capital.5–7 The access a wine region has to these resources can strengthen or undermine its overall capacity to adapt to climate change. Developing a baseline assessment of a wine region’s present adaptive capacity can illuminate areas of strength and vulnerability. Insights gained from such an assessment create a platform for discussing and developing solutions to build the adaptive capacity of a wine region.
At present there are limited strategies available to grape growers and winemakers for managing many of the extreme weather events associated with climate change (Table 1). Future climatic predictions indicate a greater frequency and intensity of these weather events along with the movement of optimal wine production areas pole ward, costal, and to higher elevations.16 The adaptive capacity of many wine regions is still not fully understood. Even though adaptation to climate change is occurring in many of the global wine regions, a comprehensive assessment of the factors affecting the adaptive measures is yet to be conducted. To date, studies of climate change adaptation in the wine industry have been dominated by the vulnerability approach, which focuses on assessing the sensitivity of a wine region when exposed to various climatic events.17–20 Adaptive capacity can moderate both the exposure and sensitivity of a region, thereby reducing vulnerability.21 Recognizing the importance of adaptive capacity within the wider adaptation process, Holland and Smit22 and Kenny23 both acknowledge the need to better understand the adaptive capacity of the wine sector. These considerations inform the basis for the current study which seeks to provide a systematic assessment of the adaptive capacity of the Ontario wine industry (OWI).
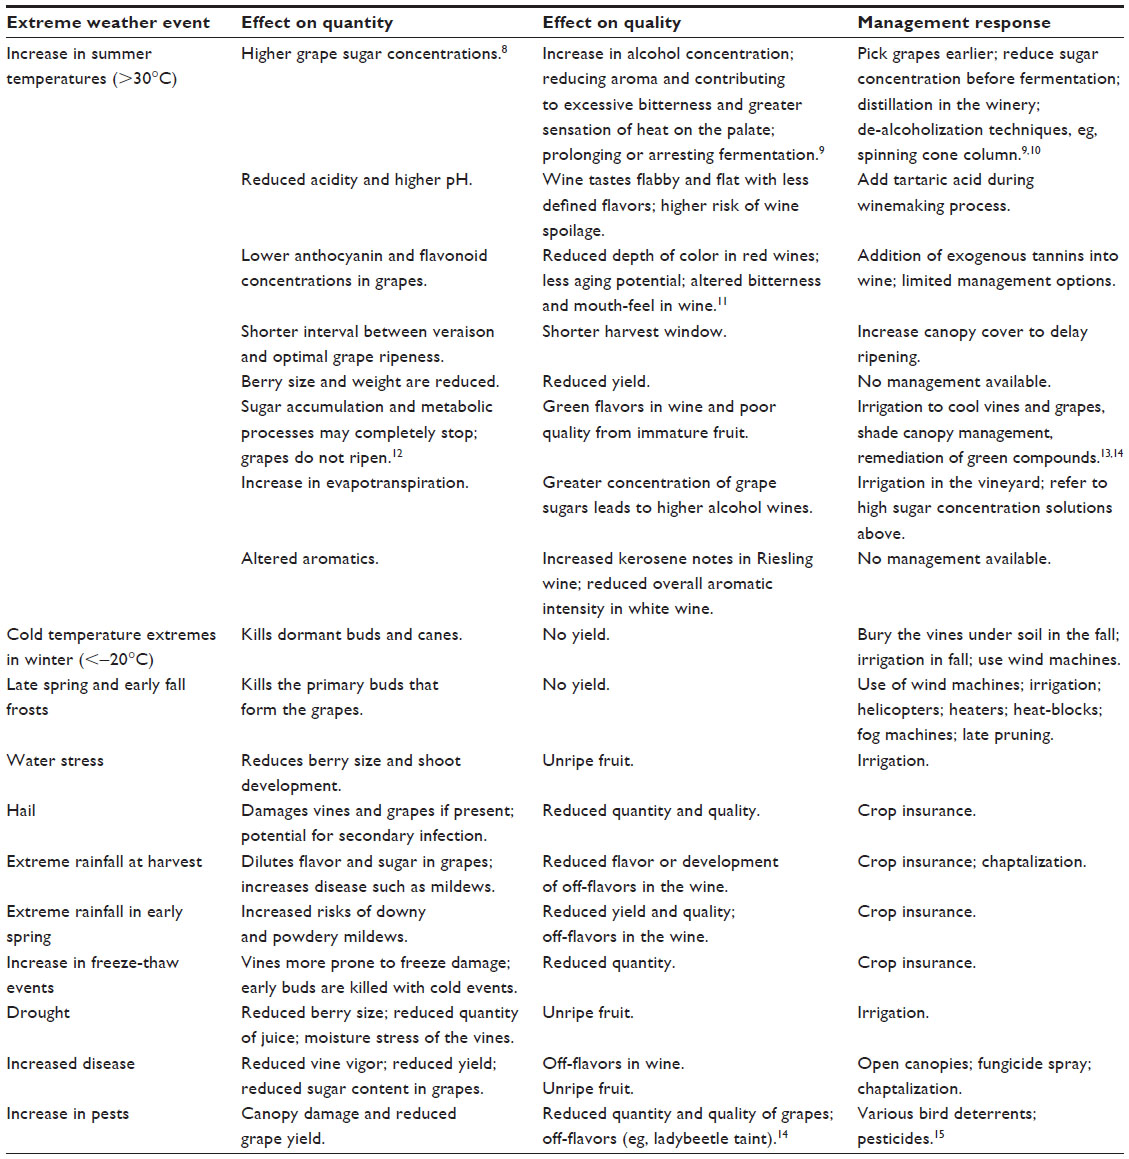 | Table 1 Impacts of extreme weather events on grapes and wine quality |
The OWI
Canada’s wine regions, with their short growing seasons and cold winters, sit on the edge of the climatic suitability zone for wine production. The Canadian wine industry has an economic value of CAD $6.8 billion and continues to grow.24 Ontario produces over 70% of Canadian wine with the Okanagan Valley in British Columbia as the second major production area.25 The Ontario industry comprises approximately 17,000 acres of vineyards located in three major appellations: Lake Erie North Shore, Prince Edward County, and Niagara Peninsula (Figure 1).26
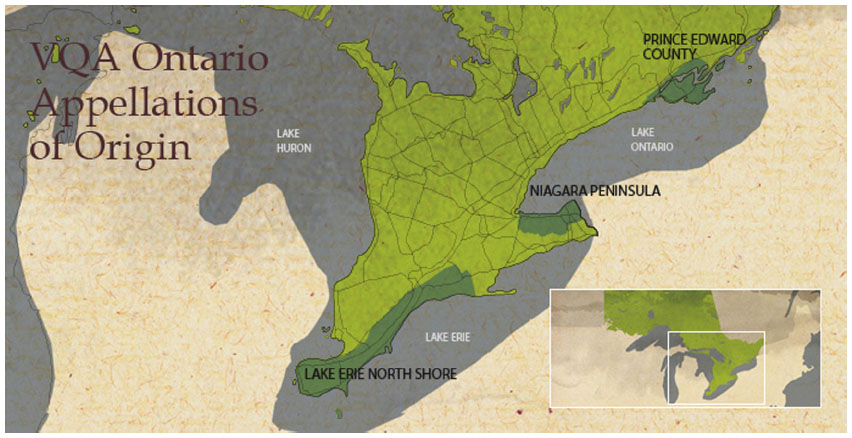 | Figure 1 Map of the wine appellations in Ontario. |
The Niagara Peninsula is the main producer, and consists of ten sub-appellations. Its proximity to the Great Lakes provides a moderating influence on the climate, allowing for the production of high quality cool climate varieties. The main Vitis vinifera cultivars are Chardonnay, Riesling, Gewürztraminer, Pinot gris, Sauvignon blanc, Pinot noir, Cabernet franc, Cabernet sauvignon, Merlot, and Gamay noir. A smaller portion of table wines are produced from French-American hybrid grape varieties, particularly Baco noir, Vidal, and Maréchal Foch. In 2013, 21.9 million liters (2.4 million cases) of wine was produced for local and international markets.27 The industry is recognized internationally for its excellent ice wines, of which it is the world’s biggest producer; ice wine contributes 50% of the $40 million revenue from wine exports.27 There are approximately 540 grape growers and 140 wineries in Ontario. Vineyard operations range from small family-owned businesses, where winemakers also grow the grapes, to mid-sized winery estates with separate wine makers and growers, up to large international corporations. Overall, the industry employs 14,000 people and has an annual economic impact of $3.3 billion for the province.25 Tourism is a strong component of this income, with over 1.8 million people visiting the province’s wineries annually.27 The OWI has four main supporting bodies: the Grape Growers of Ontario, Wine Council of Ontario, Winery and Growers Alliance of Ontario, and the Vintners Quality Alliance.
Frequent cold winters and short growing seasons in Ontario are the most limiting factors affecting where successful wine production can occur; vine mortality rates can be high in Canadian winters. Conversely, dependable cold temperatures create the optimal environment for ice wine production. However, shorter and warmer winters associated with climate change are challenging ice wine production, advancing growing seasons, and increasing the risk of freeze damage to vines.28 Harvesting and processing of grapes for ice wine are regulated by the Vintners Quality Alliance of Ontario. Ideal harvesting temperatures should occur between −8°C and −12°C; however, warming trends in December and January are delaying and reducing this harvest window.28 As winter temperatures continue to rise gradually over the next 30–50 years, the viability of ice wine production in present locations could be jeopardized.
As the winter warms gradually, the vines deacclimate to the cold temperatures becoming more prone to freeze damage at warmer temperatures and consequently, less able to survive extreme cold events.29 Most recently, the winter of 2014 was the coldest in over 30 years in Ontario, killing up to 80% of less cold-resistant vines in some appellations and resulted in a 50%–75% reduction in overall yield for some varieties.30
On the positive side, warmer winters are creating the potential for new areas for wine production further north, such as Huron County – 200 km north of the Niagara appellation. Indeed, climate modeling, soil analysis, and grape growing information sessions have already begun in Huron County, paving the way for further expansion of the OWI.31 The identification of suitable, more northerly areas within Ontario offers the opportunity to maintain current ice wine production levels and also establish some quality cool climate for V. vinifera varieties such as Pinot noir and Riesling. Moreover, a warming climate in Ontario could allow full ripening potentials for mid- and late-season red varieties, such as Cabernet Sauvignon and Cabernet Franc.
In some years, climate change has also created higher summer temperatures, which have affected fruit quality of cooler-climate varieties such as Pinot noir and Chardonnay, in addition to creating heat stress to the vines.32 Greater summer humidity levels and temperatures are also increasing the occurrences of fungal diseases, such as powdery mildew, downy mildew, and black rot that reduce wine quality.32 The OWI is actively seeking to develop and adapt new technologies and practices to address these and other impacts.33 Nonetheless, a comprehensive assessment of its present adaptive capacity to climate change is identified as an important strategy in order to prepare the industry to deal with future challenges.
Materials and methods
Assessment framework
An adaptive capacity assessment framework was developed by first conducting a review of the climate change adaptive capacity literature. This enabled the identification of adaptive capacity determinants from previous scholarly publications. Next, we reviewed the viticulture and oenology literature on the impacts being experienced related to climate change. We identified present adaptive measures, challenges, and opportunities for various wine regions. Both literature reviews were then integrated allowing for the identification of resources that wine regions need in order to adapt to climate change. For example, extreme weather events reduce crop yield, but having crop insurance can reduce the negative financial impact this can have for the grower; hence crop insurance is an important resource for wine regions and is included under financial resources. The assessment framework comprises eight determinants: financial, institutional, political, technological, diversity, social capital, knowledge, and perception (Figure 2). The determinants are further categorized as operational (those over which the industry has limited control, such as crop insurance and government policies) or strategic (those over which the industry has greater control, such as the sharing of local knowledge, and diversity of income). A description of each category, determinant and the associated measures are summarized in Table 2.
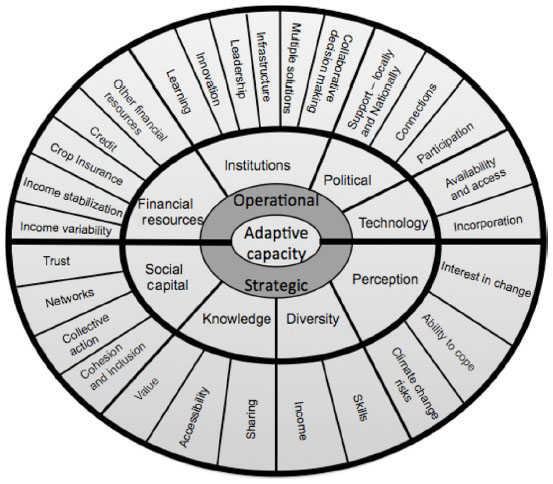 | Figure 2 Adaptive capacity assessment framework. |
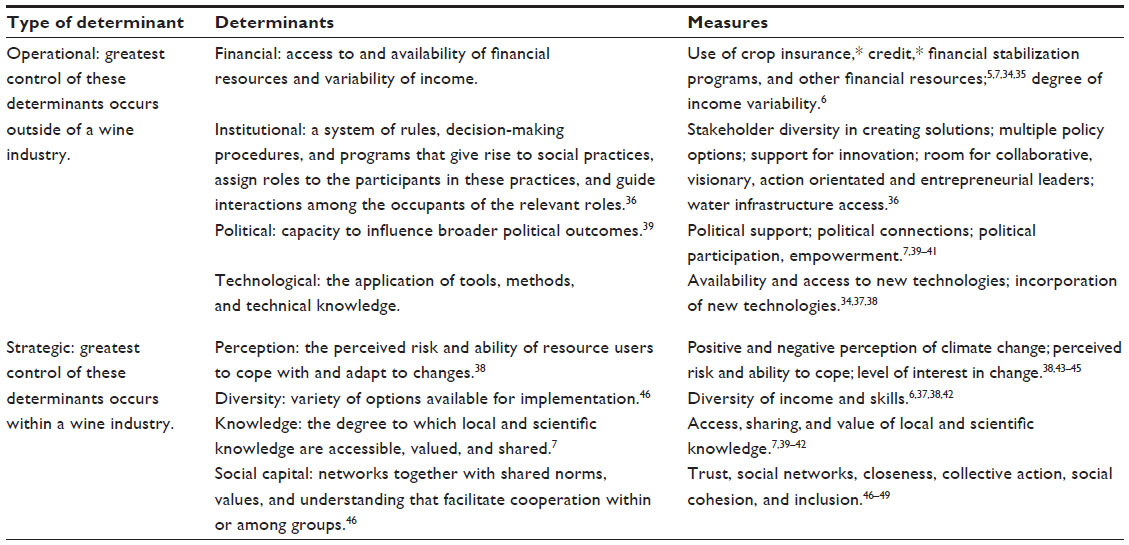 | Table 2 Adaptive capacity determinants for a wine industry |
Questionnaire and participants
The questionnaire template consisted of a statement for each of the indicators (Table 2) to which participants rated their level of agreement on a five-point Likert scale. Likert scales indicate the direction (“agree”/“disagree”) and intensity (“strongly”) of participants’ perceptions.50 Apart from two statements, which were later reversed for analysis, all statements were positively phrased, with agreement indicating the presence of adaptive capacity. Three questionnaire versions were then created, tailored for grape growers, winemakers, and supporting organizations, respectively. While some grape growers are also winemakers, participants selected from which perspective they were answering the survey by clicking on the most appropriate classification. Grape growers had two additional statements that were not relevant to the other groups: “I use crop insurance to get me through bad years” and “I use credit to get me through bad years” (see asterisks in Table 2). Questionnaires were piloted with a small group of grape growers, winemakers, and local wine educators to ensure the questions were readable and unambiguous.
Questionnaires were administered and completed online using Selectsurvey. Net software on a Brock University secure server. Grape growers and winemakers in Ontario belong to at least one of the following organizations: Grape Growers of Ontario, Wine Council of Ontario and Winery and Growers Alliance of Ontario. To reach as many stakeholders as possible, each of the organizations sent up to three emails to its members between July–August 2012 with an embedded link that directed participants to the questionnaire. A total of 42 questionnaires were completed out of 630 members contacted corresponding to a response rate of 6.6%. Within the 42 questionnaires 32 were completed by growers, eight by winemakers, and two by organizational representatives. The responses received were representative of the proportion of grape growers, winemakers, and institutional workers in Ontario.
Data treatment and analysis
Responses were coded numerically (5-strongly agree, 4-agree, 3-neither agree nor disagree, 2-disagree, 1-strongly disagree), with the two negatively phrased statements reversed. Given the low response rate, and to gain a better understanding of the overall directional trend, the five-point Likert responses were collapsed to three points (agree, neither agree nor disagree, disagree) for the frequency tables only. Unless otherwise stated, analysis is based on the combined dataset of 42 responses. XLSTAT version 7.5.2, (Addinsoft, Paris, France) was used for all statistical analyses. A Shapiro–Wilk test for normality for all determinants was first conducted. To test statistical reliability between statements within each determinant, Cronbach’s alpha values (coefficient of reliability) were calculated. Frequency of response tables based on the collapsed Likert categories were created in MS Excel (Microsoft Corporation, Redmond, WA, USA) for each measure.
To examine differences in average scores between the eight determinants, five-point Likert scale responses were averaged across each indicator for each determinant, one-way analysis of variance (ANOVA) followed by Fisher’s least significant difference (LSD) was performed. To assess differences between operational and strategic determinants, the five-point Likert scale responses were averaged across each indicator for each determinant. Determinants were then grouped into “strategic” or “operational”, and a one-way ANOVA, followed by Fisher’s LSD, was performed. To determine whether growers and winemakers differed in their responses, the five-point Likert scale responses were averaged across each indicator for each determinant (institutional data were excluded from this analysis). A one-way ANOVA for each determinant was then completed. To examine whether growers and winemakers differ in their scores for operational and strategic determinants, the five-point Likert scale responses were averaged across each indicator for each determinant. Determinants were then grouped into “strategic” or “operational”, and a two-way ANOVA (including interaction), followed by Fisher’s LSD, was performed. A principal component analysis (PCA) was conducted of the eight determinants and three participating groups (growers, winemakers, institutions) to give an overall visualization of the results, and aid in understanding the inter-relationships among the individual determinants.
Results
Reliability of measures
The Cronbach’s alpha values for each determinant were: financial (0.637), institutional (0.752), political (0.788), technological (0.620), perception (0.886), diversity (0.669) knowledge (0.941), and social capital (0.92). An alpha of greater than 0.6 indicates acceptable reliability, and 0.8 or higher indicates good reliability.51 All values calculated were 0.62 or greater, indicating acceptable to good reliability between statements within each determinant.
Frequency of Likert responses
Figure 3 summarizes the financial determinant results. Approximately 45% of growers rely on crop insurance to help them through a “bad” year, and 40% of respondents have “access to financial resources to keep going”. Income variability is experienced by 45% of stakeholders monthly and 60% annually, while 37% use stabilization programs. Figure 4 shows the results for the institutional determinant. Almost half of participants felt the OWI institutions encouraged new and improved best practices. Over 55% agreed there was room in the OWI for “visionary”, “action orientated”, “collaborative”, and “entrepreneurial” leadership. Water infrastructure is accessible to 50% of participants. The political determinant results are given in Figure 5. Participants indicated there is greatest political support for the OWI provincially and 70% indicate they are politically active on OWI issues. Figure 6 presents the technology results. Forty-two percent of participants felt they had access to new technologies while 58% of respondents are incorporating new technology into their practice. Results for the determinant of perception are shown in Figure 7. More respondents believe climate change will have positive impacts for the OWI than negative. Over 90% agreed they wanted to learn “how to better prepare for extreme weather events” and “climate change”, with 73% of participants expressing interest in learning new skills outside the OWI to manage the impacts. The results for diversity are presented in Figure 8. Household income from sources other than grapes and wine was reported by 64% of participants, with 42% indicating they rely on income sources outside the OWI. Figure 9 presents the results for the knowledge determinant. The majority of participants indicate there is access to and availability of local and scientific knowledge which is valued and shared. Results for the social capital determinant are shown in Figure 10. Over 80% of participants believe stakeholders within the industry are willing to or are presently helping each other. The majority of respondents felt they were not excluded from industry events and agreed “people within the industry could be trusted”.
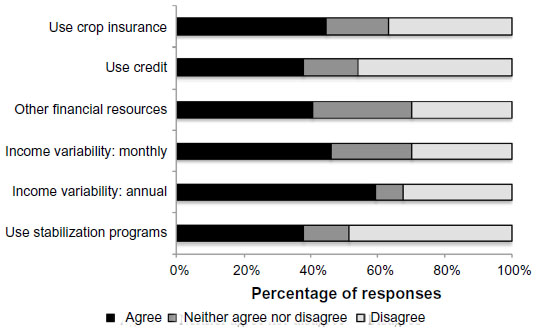 | Figure 3 Financial determinant responses. |
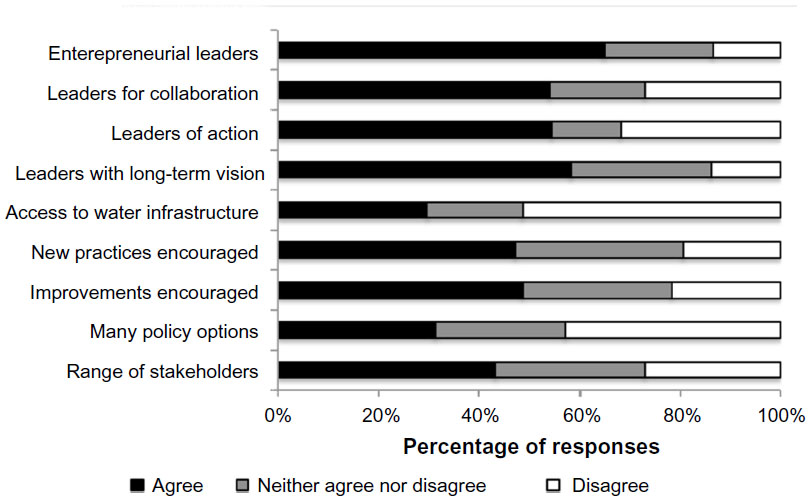 | Figure 4 Institutional determinant responses. |
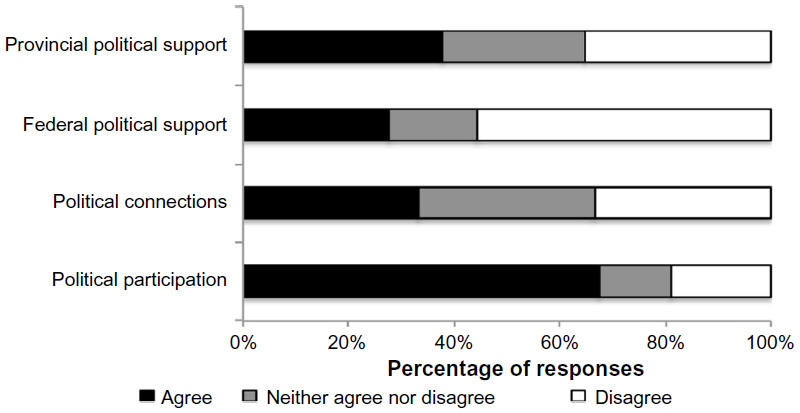 | Figure 5 Political determinant responses. |
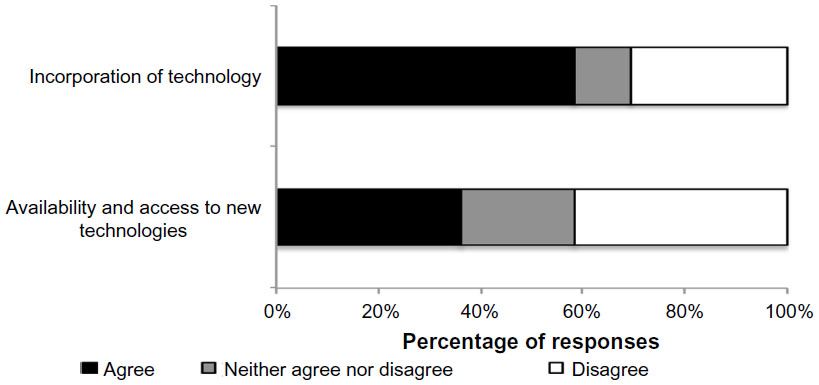 | Figure 6 Technological determinant responses. |
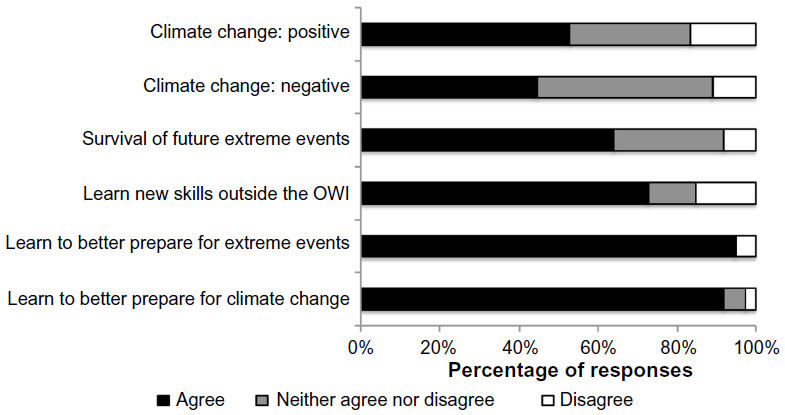 | Figure 7 Perception determinant responses. |
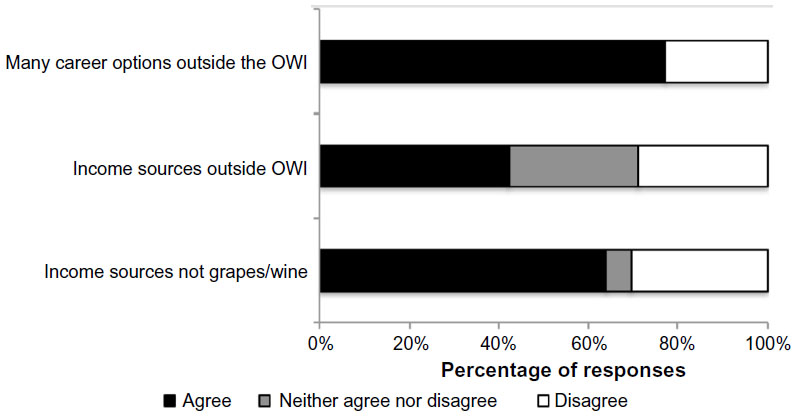 | Figure 8 Diversity determinant responses. |
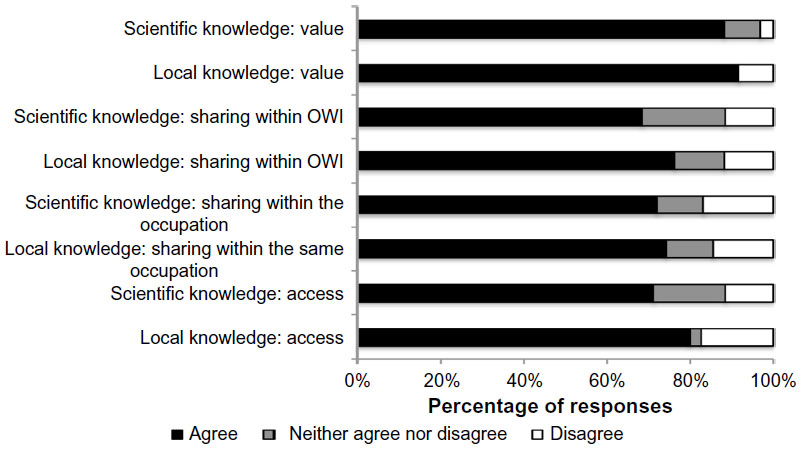 | Figure 9 Knowledge determinant responses. |
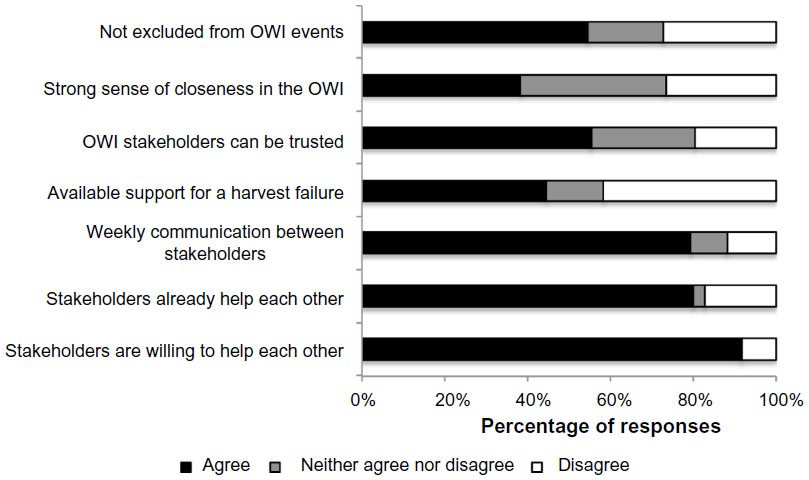 | Figure 10 Social capital determinant responses. |
ANOVA
The Shapiro–Wilk test statistic confirmed that the data were normally distributed for all determinants (P>0.05) except for perception, where P (observed value) was 0.01. The eight determinants differed significantly in their average Likert response scores (F: 5.47, P[F]: <0.0001) (Table 3).
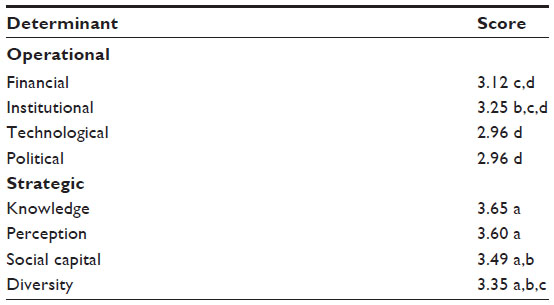 | Table 3 Results of analysis of variance for the eight determinants |
ANOVA showed a significant difference in average scores between growers and winemakers for knowledge (df: 1,35; F: 19.29, P[F] <0.0001) and social capital (df: 1,35; F: 16.19, P[F] <0.0001), while perception approached significance (df: 1,38; F: 3.36, P[F]: 0.075). In all cases, winemakers scored higher than growers. The other determinants did not differ between these two groups (P[F]>0.05).
ANOVA showed there is a difference between the average scores for the operational and strategic determinants (df: 1,334; t: 29.80, P[F]: <0.0001), with the strategic score (3.52) significantly higher than the operational score (3.07). Two-way ANOVA showed that growers and winemakers did not differ in their average responses for operational determinants (df: 1,305; P[F]:>0.05), while winemakers (3.82) scored significantly higher than growers (3.42) for the strategic determinant grouping. Closer examination suggests that knowledge, perception, and social capital appear to be driving this latter result (data not shown).
The PCA offers a visualization of the eight determinants, the three groups, and their relationship to each other (Figure 11). The horizontal axis is defined primarily by the political and perception determinants while the vertical axis is defined by technology. The three groups are differentiated from each other by their relative position within the PCA space. Institutions show a closer positioning to the political determinants, which is perhaps expected as institutions act as a political liaison between growers, winemakers, and different government departments. The low “n” for institutions (2) limit drawing conclusions on this data. Figure 11 also shows some interesting associations between the eight determinants. The strongest positive correlation (as evidenced by the angle of their eigenvectors) is between social capital and knowledge; this may be due to both determinants encompassing values and sharing. Diversity and finances are also strongly associated; diversity includes an assessment of income related to financial resources. Unexpectedly, there was no association found between technology and perception, although it has previously been shown that Spanish winegrowers’ perception of climate change influences their incorporation of new technologies.52
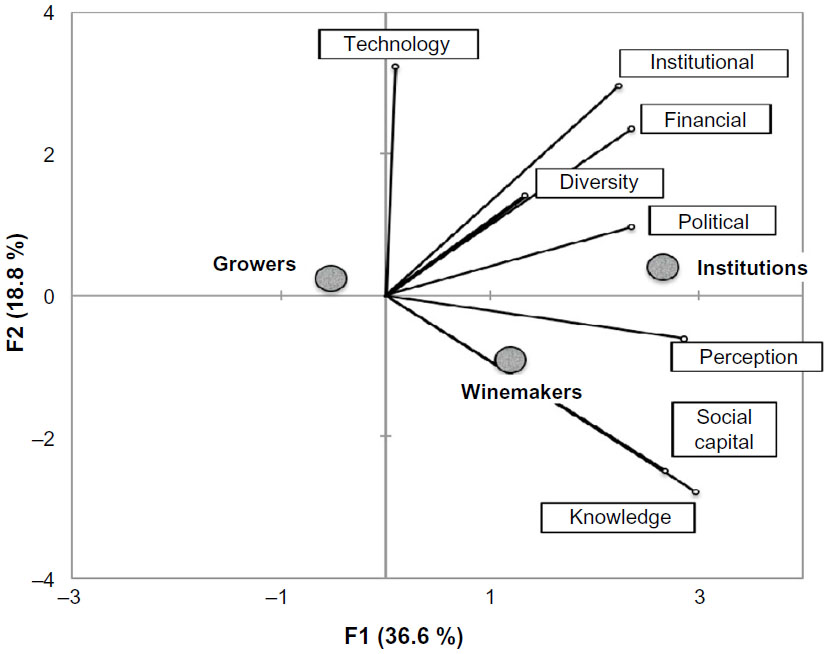 | Figure 11 Principal components analysis of determinant scores. |
Discussion
The OWI is facing challenges and opportunities from climate change. Adaption is dependent upon its present and future adaptive capacity. We assessed eight climate change adaptive capacity determinants within the OWI: financial resources, institutions, political, technological, perception, diversity, knowledge, and social capital. These determinants were divided into two categories – operational and strategic. The main insights gained are shown in Table 4.
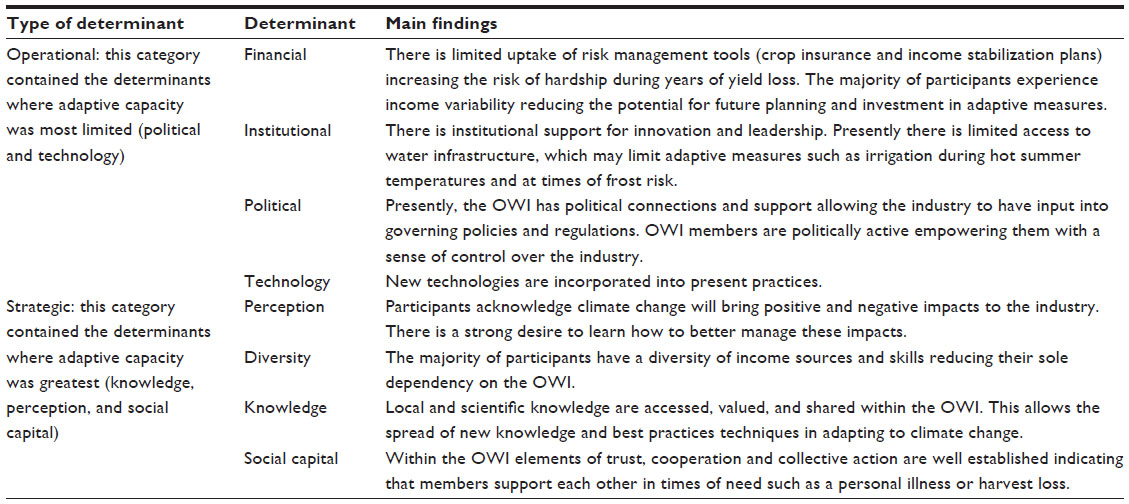 | Table 4 Summary of main findings for each determinant |
These determinants affect the adaptive capacity of the OWI separately and collectively. Exploring the financial determinant illuminates the many interdependencies amongst the determinants.
Financial resources – crop insurance
Adaptation measures cost money and therefore require access to financial resources.34 Individuals and organizations with available financial resources are more likely to invest in adaptive strategies, such as new technologies.34 Having access to financial resources is affected by many factors including institutions, political support, diversity in skills and income, knowledge, and social capital.53–55 In the OWI, financial resources such as crop insurance are designed to reduce financial hardship following major crop loss and allow for reinvestment, such as replanting and purchasing new technologies. In the winter of 2014 severe cold temperatures killed vines and caused an overall yield loss between 50%–75%.56 Only 51% of growers had purchased crop insurance for 2013–2014.57 It is not unreasonable to expect this crop loss will place a greater financial hardship on those growers without crop insurance. From our study, 30% of participants indicated they did not have the financial resources to keep going, combined with the income loss and costs associated with the winter damages, continuing in grape growing may be beyond some growers.
Purchasing crop insurance for many growers is a condition required by lending institutions such as banks. The provincial and federal governments who subsidize crop insurance develop the rules around its implementation. Policies and regulations can constrain or enhance adaptive capacity.36 For example, politicians in France changed regulations prohibiting the irrigation of grapevines to allow growers to better manage the impacts of higher temperatures associated with climate change.58 Having political connections and support, better ensures members’ interests are represented in policy decisions. Given that only 50% of growers purchase crop insurance and that the frequency and intensity of extreme weather events will increase, the conditions around the purchasing of crop insurance may require evaluation to ensure they address members’ needs.
Financial resources are also required for the purchasing and development of new adaptive technologies such as wind machines to manage climate change impacts. The cost of a wind machine varies from $7,500 refurbished to $30,000 new. The number of machines required is dependent upon the size, shape, location, and geography of the vineyard. To invest in this technology to prevent freeze injury in Ontario vineyards requires growers to either have savings or access to credit and loans. Growers without the financial resources and unable to purchase this technology become increasingly vulnerable to crop loss during freeze events.
Primary resource users such as grape growers and wine makers have a high financial dependency on natural resources and greater financial susceptibility to extreme weather events.59 Multiple income sources and transferrable skills have been shown to reduce dependency on natural resources as individuals have more options to adapt to change.59 Greater diversity of skills provides greater opportunities for developing creative and novel solutions.60 Within the OWI, many grape growers also grow other crops and many of the wineries offer culinary and craft products to customers adding additional onsite income sources reducing their dependency on grapes and wine.
Freeze injury – technological adaptation
Another new technology supporting the optimum use of the wind machines is Vine Alert™ (Brock University, St Catharines, ON, Canada), a notification system that alerts growers to what temperatures each varietal is most susceptible to freeze damage so they can activate the wind machines. The development of this and other new technologies require funding. The provincial government demonstrated political support for the OWI in 2010 with a 2.5 million dollar grant to Ontario researchers to develop new technologies to assist the OWI in adapting to climate change. One of these strategies was the Vine Alert™ system. The success of this system was dependent upon institutions providing structures through which resources could be mobilized and shared.55,61 Previous to the cold temperatures of 2014, the Grape Growers of Ontario had been educating its members on the new Vine Alert™ system and how it could assist them during cold temperatures. During the 2014 winter, the Grape Growers of Ontario gathered additional information from local research institutions on ways to reduce freeze damage, such as burying the vines, and distributed this to members via newsletters, “eblasts”, and their website. Information on best practices for spring pruning to increase the yield was also given to members using these methods. The recommended changes in pruning are credited with a greater yield in the 2014 harvest than expected.62
Irrigation and water conflicts
Another adaptive measure to reduce freeze injury is the use of irrigation sprinklers. Water coats and freezes on the vines and buds creating a layer of ice which insulates against the cold temperatures.63 This form of irrigation can also be used during high summer temperatures to reduce heat stress on vines.63 For vineyards experiencing an increased incidence of disease associated with higher humidity during the warmer summer, irrigation is not recommended. In older growing regions of Europe water infrastructure does not exist and there are regulations and a lack of space restricting the development of water access for vineyards.52 In New World vineyards in Australia and California infrastructure is present but there is conflict around water rights as other agricultural crops, urban areas, industry, and hydroelectric power generation needs increasingly compete for a diminishing supply of water.64 Crop and income loss for farmers has already occurred as a result of these tensions.65 The OWI sits along Lake Erie and Lake Ontario, two of the five Great Lakes and presently has unregulated access to ground and surface water. Niagara is home to world-renowned Niagara Falls, which draws over 13 million tourists every year. The Great Lakes create a natural border between Canada and the United States. Tension surrounding water withdrawal and quality has been present since the 1800s.66 These tensions are increasing in response to greater water demand from each country to satisfy growing urban areas, industry, agriculture, tourism, and hydroelectric demands.67 Coupled with this are lake changes related to climate change, including greater evaporation rates decreasing lake levels, changing precipitation pattern causing flooding, and nutrient dumping and increasing blue-green algae blooms affecting water quality.67 Our study showed 50% of participants presently have access to water infrastructure. Further research is needed to establish if this is presently a limiting factor for growers in managing freeze damage and heat stress. As the OWI looks to expand northward, access to water infrastructure and water rights are issues that need to be discussed and planned.
Beliefs and perceptions
A pivotal aspect of adaptive capacity for climate change is the beliefs and perceptions of individuals. The continual debate on the plausibility of climate change is impacting on the choice of grape growers and winemakers to adopt adaptive strategies. Battaglini et al42 assessed winemakers’ perception of climate change, and found that both threats and opportunities associated with climate change were recognized by European winemakers and growers, in agreement with our findings. Alonso and O’Neil52 and Raymond and Spoeher68 concluded that when, respectively, Spanish and South Australian growers and wine makers perceived the impacts of climate change, they altered operations enhancing their adaptive capacity. Conversely, those who did not perceive the impacts refused to change or modify current practices, potentially reducing their adaptive capacity and making themselves more susceptible to impacts. Participants in our study were aware of the positive and negative impacts of climate change and 90% indicated a willingness to learn better management practices.
Knowledge
Local and scientific knowledge are both important in building capacity for adaptation to climate change. Local knowledge provides information on the local scale and place-specific adaptations. Scientific knowledge is largely responsible for the development of new technologies required for adaptation, such as wind machines and Vine Alert™. Friction between these knowledge types is well documented, yet when used together they provide a unique range of place-specific adaptations, as shown by Reed et al.69–72 The increasing successful use of wind machines in the OWI further illustrates this relationship. Scientific knowledge led to the development of the wind machines, while local knowledge assists in their location and development of best management practices. Through their communication strategies institutions are able to ensure members of the OWI have access to knowledge, as shown with the information sharing that occurred with the best spring pruning practices in 2014.
Social capital
Social capital has been described as the social glue for adaptive capacity; it is the social connections and relationships that occur between people.7 Cooperation, trust, cohesion, networks, collective action, and inclusion are its main attributes.45,48 Social capital is most visible during times of disaster where those with little social capital can be isolated, reducing their access to resources and therefore their ability to cope with extreme events. For the OWI, social capital occurs in undocumented ways when members support each other, such as sharing harvesting equipment, staff, and expertise. Gatherings for educational workshops by institutions, at institutional annual general meetings, wine shows, and collaborations on wine events such as “Graze the Bench” build elements of trust, cooperation, collective action, and networks within the OWI.
Other considerations
Few studies within the agricultural sector have attempted to determine adaptive capacity across such a comprehensive range of determinants, and none, to our knowledge, within the wine industry. Previous studies have suggested that adaptive capacity between growers and winemakers is uneven, consistent with our findings, which generally showed greater capacity reported by winemaker respondents.35,73 The reasons for this difference were not explored in this study. Winemakers have several options available to them to reduce the impact of events such as the low yield in 2014. These include blending wine from previous vintages and sourcing juice or wine from other regions. Wine is a value-added product; wine making adds value to the original grapes, giving greater resale value. As wines are not released for sale until at least a year after the harvest, there is a delay in winemakers experiencing the impact of lower yield, giving them more time to limit the financial impact. Tol and Yohe show how uneven adaptive capacity can undermine the overall capacity of a group to adapt.74 They conclude adaptive capacity is only as strong as the most vulnerable within a group. If grape growers within the OWI do not have the capacity to adapt to climate change, local grape production will decrease changing the structure and potential viability of the wine industry as it exists today.
Overall, these findings indicate the OWI has adaptive capacity in all of the determinants measured. This assessment provides a baseline from which future efforts can be compared. The adaptive capacity assessment framework applied to the OWI can be transferred to other wine regions wishing to assess their adaptive capacity. The framework offers wine regions insight into the diverse range of factors that affect their adaptive capacity to climate change. Other industries within the agricultural sector may also benefit from using this framework to assess their adaptive capacity, but will need to tailor some of the indicators to their own industry.
Conclusion
The international wine industry is experiencing the impacts of climate change and needs to build adaptive capacity for adaptation to succeed. An adaptive capacity framework and questionnaire were developed and implemented in the OWI. The main findings indicate the OWI has adaptive capacity in all of the major determinants tested, although capacity differs between growers and winemakers for some measures. The desire by members to learn how to better adapt to climate change and an interest in learning skills outside the OWI suggest it is an opportunistic time to develop a wider strategic plan for building adaptive capacity to assist climate change adaptation. Although the sample size for this study was small, it represents a fair assessment of the present state of adaptive capacity for the industry. Future study could incorporate interviews with winemakers and grape growers to further explore differences between their adaptive capacity and potential impacts for the industry. A comparative assessment between the OWI and other international wine regions would be of value in identifying areas of shared capacity and those unique to a region.
Acknowledgments
Funding for this research was provided by the Ontario Research Fund: Research Excellence Funding (Round 5). The authors acknowledge The Ontario Grapevine and Wine Research Network for their support with this research. In particular, assistance of the Wine Council of Ontario, Grape Growers of Ontario, and Winery and Growers Alliance of Ontario is appreciated. Finally, the authors acknowledge the valuable insights and suggestions provided by the reviewers.
Disclosure
The authors report no conflicts of interest in this work.
References
Jones G, White M, Cooper O, Storchmann K. Climate change and global wine quality. Climatic Change. 2005;73(3):319–343. | |
Webb L, Whetton P, Barlow E. Modelled impacts of future climate change on the phenology of wine grapes in Australia. Aust J Grape Wine Res. 2007;13(3):165–175. | |
Schultz HR, Stoll M. Some critical issues in environmental physiology of grapevines: future challenges and current limitations. Aust J Grape Wine Res. 2010;16:4–24. | |
Dunchene E, Schneider C. Grapevine and climate changes: a glance at the situation in Alsace. Agron Sustain Dev. 2005;25(1):93–99. | |
Engle N, Lemos M. Unpacking governance: Building adaptive capacity to climate change of river basins in Brazil. Global Environmental Change. 2007;20:4–13. | |
Australian Government Grains Research and Development Corporation. Crimp S. A Capital Concept of Adaptive Capacity. Climate: Ground Cover. Available from: http://www.grdc.com.au/Media-Centre/Ground-Cover-Supplements/~/media/7DFFD3C49C034C5F90611A95826D5432.pdf. Accessed November 26, 2014. | |
Armitage D. Adaptive capacity and community-based natural resource management. Environ Manage. 2005;35(6):703–715. | |
Wollan D. Membrane and other techniques for the management of wine composition. In: Reynolds A, editor. Managing Wine Quality, Vol 2. Cambridge: Woodhead Publishing Limited; 2010:133–163. | |
Pickering GJ, Heatherbell DA, Barnes MF. The production of reduced-alcohol wine using glucose oxidase-treated juice. Part III. Sensory. Am J Enol Vitic. 1999;50(3):307–316. | |
Mira de Orduña R. Climate change associated effects on grape and wine quality and production. Food Research International. 2010;43(7):1844–1855. | |
Coombe B. Influence of temperature on composition and quality of grapes. In: Kliewer WM, editor. Symposium on Grapewine Canopy and Vigour Management. California: ISHS Acta Horticulturae; 1987;206:23–35. | |
Creasy GL, Lombard PB. Vine water stress and peduncle girdling effects on pre-and post-veraison grape berry growth and deformability. Am J Enol Vitic. 1993;44(2):193–197. | |
Galvan TL, Kells S, Hutchison WD. Determination of 3-alkyl-2-methoxypyrazines in lady beetle-infested wine by solid-phase microextraction headspace sampling. J Agric Food Chem. 2008;56(3):1065–1071. | |
Pickering GJ, Lin JY, Riesen R, Reynolds A, Brindle I, Soleas G. Influence of harmoniaaxyridis on the sensory properties of white and red wine. Am J Enol Vitic. 2004;55(2):153–159. | |
Weaver R. Grape Growing. New York: Wiley and Sons; 1976. | |
Rosenzweig CG, Casassa CJ, Karoly A, et al. Assessment of observed changes and responses in natural and managed systems. In: Parry ML, Canziani OF, Palutikof JP, van der Linden PJ, Hanson CE, editors. Climate Change 2007: Impacts, Adaptation and Vulnerability. Contribution of Working Group II to the Fourth Assessment Report of the Intergovernmental Panel on Climate Change. Cambridge, UK: Cambridge University Press; 2007:79–131. | |
Hadarits M, Smit B, Diaz H. Adaptation in viticulture: a case study of producers in the Maule Region of Chile. J Wine Res. 2010;21(2–3):167–178. | |
Fraga H, Malheiro AC, Moutinho-Pereira J, Santos JA. An overview of climate change impacts on European viticulture. Food Energy Security. 2012;1(2):94–110. | |
Whalen P. Whither terroir in the twenty-first century: burgundy’s climats? J Wine Res. 2010:21(2/3):117–121. | |
Wine Economics and Policy [homepage on the Internet]. Mozell MR, Thach L. The impact of climate change on the global wine industry: challenges and solutions; 2014 [cited August 9, 2014]. Available from http://dx.doi.org/10.1016/j.wep.2014.08.001. Accessed October 20, 2014. | |
Smit B, Wandel J. Adaptation, adaptive capacity and vulnerability. Glob Environ Change. 2006;16:282–292. | |
Holland T, Smit B. Climate change and the wine industry: current research themes and new directions. J Wine Res. 2010;21(2–3):125–136. | |
Kenny GJ. Are we doing relevant research on climate change? Reflections from a review of ‘climate variability, climate change and wine production in the Western US’. J Wine Res. 2010;21(2–3):123–124. | |
engage.gov.bc.ca [homepage on the Internet]. Rimerman AF. The economic impact of the wine and grape industry in Canada 2011. Available from http://engage.gov.bc.ca/liquorpolicyreview/files/2013/11/Canadian-Vintners-Association.pdf. Accessed July 6, 2014. | |
Grape Growers of Ontario [homepage on the Internet]. Industry facts. Available from http://www.grapegrowersofontario.com/ontarios-grape-and-wine-industry. Accessed July 6, 2014. | |
VQA Ontario [homepage on the Internet]. Ontario wine map. Available from http://www.vqaontario.com/Appellations. Accessed July 6, 2014. | |
Wine Country Ontario [homepage on the Internet]. Vintners Quality Alliance. Wine facts and statistics [updated January 2014]. Available from: http://winecountryontario.ca/media-centre/industry-statistics. Accessed July 6, 2014. | |
terroir2010.entecra.it [homepage on the Internet]. Cyr D, Shaw T. The impact of global warming on Ontario’s wine industry. VIII International Terroir Congress. Proceeding 3. Available from: http://terroir2010.entecra.it/atti/index.html. Accessed July 6, 2014. | |
Fennell A. Freezing tolerance and injury in grapevines. Journal of Crop Improvement. 2004;10:201–235. | |
Grape Growers of Ontario [homepage on the Internet]. Ontario vineyards escape total disaster. Available from: http://www.grapegrowersofontario.com/789. Accessed October 20, 2014. | |
issuu.com [homepage on the Internet. Viticulture in Huron County: An introduction for investors. Huron County economic development services and Huron Business development corporation, 2012. Available from: http://issuu.com/huroncounty/docs/huron_county_viticulture_investor_guide. Accessed November 26, 2014. | |
Globe and Mail [homepage on the Internet]. Trichur R. Climate change threatens to spoil Ontario’s signature wines, 2011. Available from: http://www.theglobeandmail.com/report-on-business/small-business/climate-change-threatens-to-spoil-ontarios-signature-wines/article587828/. Accessed October 15, 2014. | |
Pickering K, Pickering G, Inglis D, Shaw T, Plummer R. Innovation and adaptation in the Ontario grape and wine industry: An integrated, transdisciplinary response to climate change. Environmental Sustainability Research Centre. Working Paper series. 2012 Available from: https://dr.library.brocku.ca/bitstream/handle/10464/4149/Working%20paper%20-%20ESRC-2012-002.pdf?sequence=1. Accessed November 26, 2014. | |
Yohe G, Tol R. Indicators for social and economic coping capacity – moving toward a working definition of adaptive capacity. Glob Environ Change. 2002;12(1):25–40. | |
Belliveau S, Smit B, Bradshaw B. Multiple exposures and dynamic vulnerability: evidence from the grape industry in the Okanagan Valley, Canada. Glob Environ Change. 2006;16(4):364–378. | |
Gupta J, Termeer C, Klostermann J, et al. The adaptive capacity wheel: a method to assess the inherent characteristics of institutions to enable the adaptive capacity of society. Environ Sci Policy. 2010;13:459–471. | |
Prairie Climate Resilience Project. Swanson D, Hiley J, Venema HD, Grosshas R. Indicators of adaptive capacity to climate change for agriculture in the Prairie region of Canada: Comparison with field observations; 2009. Available from: http://www.iisd.org/pdf/2009/pcr_adaptive_cap_ag.pdf. Accessed November 27, 2014. | |
Marshall NA. Understanding social resilience to climate variability in primary enterprises and industries. Glob Environ Change. 2010;20:36–43. | |
Grootaert C, Narayan D, Nyhan Jones V, Woolcock M. Measuring social capital: an integrated questionnaire. In: World Bank Working Papers. Washington, DC: The World Bank; 2004;1–53. | |
Eakin H, Lemos M. Adaptation and the state: Latin America and the challenge of capacity-building under globalization. Glob Environ Change. 2006;16:7–18. | |
Wall E, Marzall K. Adaptive capacity for climate change in Canadian rural communities. Local Environment. 2006;1(4):373–397. | |
Battaglini A, Barbeau G, Bindi M, Badeck FW. European winegrowers’ perceptions of climate change impact and options for adaptation. Reg Environ Change. 2009;9(2):61–73. | |
Marshall N, Marshall P. Conceptualizing and operationalizing social resilience within commercial fisheries in Northern Australia. Ecol Soc. 2007;12(1):1. | |
Blennow K, Persson J. Climate change: motivation for taking measure to adapt. Glob Environ Change. 2009;100–104. | |
Adger WN, Vincent K. Uncertainty in adaptive capacity. External Geophysics, Climate and Environment. 2004;337:399–410. | |
Armitage D, Plummer R. Adapting and transforming: Governance for navigating change. In: Armitage D, Plummer R, editors. Adaptive Capacity and Environmental Governance. Germany: Springer; 2010; 287–302. | |
Pelling M, High C. Understanding adaptation: what can social capital offer assessments of adaptive capacity? Glob Environ Change. 2005;15(4):308–319. | |
worldbank.org [homepage on the Internet]. Dudwick N, Kuehnast K, Nyhan Jones V, Woolcock M. Analyzing social capital in context: A guide to using qualitative methods and data. The International Bank for Reconstruction and Development: The World Bank, 2006. Available from: http://siteresources.worldbank.org/WBI/Resources/Analyzing_Social_Capital_in_Context-FINAL.pdf. Accessed November 27, 2014. | |
Plummer R, FitzGibbon J. Connecting adaptive co-management, social learning, and social capital through theory and practice. In: Armitage D, Berkes F, Doubleday N, editors. Adaptive Co-Management: Collaboration, Learning and Multilevel Governance. Vancouver BC: UBC Press; 2007;38–61. | |
Croasmun J, Ostrom L. Using Likert-type scales in the social sciences. J Adult Ed. 2011;40(1):19–23. | |
Walker J, Almond P. Interpreting Statistical Findings: A Guide for Health Professionals and Students: a Guide for Health Professionals and Students. Open University Press. McGraw-Hill International; 2010. | |
Alonso A, O’Neill M. Climate change from the perspective of Spanish wine growers: a three-region study. Br Food J. 2011;113(2):205–221. | |
Brooks N, Adger WN, Kelly PM. The determinants of vulnerability and adaptive capacity at the national level and the implications for adaptation. Glob Environ Change. 2005;(15):151–163. | |
Gallopin G. Linkages between vulnerability, resilience, and adaptive capacity. Glob Environ Change. 2006;16:293–303. | |
Engle NL. Adaptive capacity and its assessment. Global Environmental Change. 2011;21(2):647–656. | |
St Catharines Standard [homepage on the Internet]. Fraser D. Non-hardy vines take a beating this winter; 2014. Available from: http://www.stcatharinesstandard.ca/2014/03/03/non-hardy-vines-take-a-beating-this-winter. Accessed October 20, 2014. | |
Grape Growers of Ontario [homepage on the Internet]. Grape Growers of Ontario Annual Report 2013–2014. Available from: http://www.grapegrowersofontario.com/annual-reports. Accessed October 25, 2014. | |
Jancis Robinson [homepage on the Internet]. Irrigation now official in France; 2007. Available from: http://www.jancisrobinson.com/articles/irrigation-now-official-in-france. Accessed October 15, 2014. | |
Marshall NA, Fenton DM, Marshall PA, Sutton SG. How resource dependency can influence social resilience within a primary resource industry. Rural Sociology. 2007;72(3):359–390. | |
Folke C, Colding J, Berkes F. Synthesis: building resilience and adaptive capacity in social-ecological systems. In: Berkes F, Colding J, Folke C, editors. Navigating Social-Ecological Systems: Building Resilience for Complexity and Change. Cambridge, NY: Cambridge University Press; 2003:376–407. | |
Nelson D, Adger N, Brown B. Adaptation to environmental change: Contributions of a resilience framework. Ann Rev Environ Resour. 2007;(32):395–419. | |
CBC News [homepage on the Internet]. Huang S. Ontario wine: good quality but smaller crop after cold winter. [updated July 28, 2014]. Available from: http://www.cbc.ca/news/canada/hamilton/news/ontario-wine-good-quality-but-smaller-crop-after-cold-winter-1.2716099. Accessed October 10, 2014. | |
Oregon State University [homepage on the Internet]. Olen B, Wu JJ. How do extreme climate events affect speciality crops and irrigation management? Center for Agricultural and Environmental Policy at Oregon State University. OreCal Issues Brief No 012, 2014. Available from: http://oregonstate.edu/caep/sites/default/files/orecal_issues_brief_012.pdf. Accessed July 15, 2014. | |
Wei Y, Langford J, Willet I. Snow B. Lyle C. Is irrigated agriculture in the Murray Darling Basin well prepared to deal with reductions in water availability? Glob Environ Change. 2011;21(3):906–916. | |
Webb L, Whiting J, Watt A, et al. Managing grapevines through severe heat: a survey of growers after the 2009 summer heatwave in South-eastern Australia. J Wine Res. 2010;21(2–3):147–165. | |
International Joint Commission [homepage on the Internet]. Origins of the boundary water treaty. Available from: http://www.ijc.org/en_/Origins_of_the_Treaty. Accessed October 16, 2014. | |
Niagara Region [homepage on the Internet]. Dupont D, Renzetti S, Plummer R, Heinmiller T, Baird J. Liquid Assets: assessing water’s contribution to Niagara. Niagara Region, 2013. Available from: http://www.niagararegion.ca/living/water/pdf/NR-Liquid-Assets-Paper-2013-FINAL.pdf. Accessed November 27, 2014. | |
The University of Adelaide [homepage on the Internet]. Raymond C, Spoher J. Rural landholder attitudes toward climate change in South Australia: acceptability, vulnerabilities and responses. A comparison of coastal, mid-north and riverland grain and grape growers. Adelaide: Australia Workplace Innovation and Social Research Centre, The University of Adelaide, 2012. Available from: http://www.adelaide.edu.au/wiser/docs/PSRF_-_ClimateChange_revised_031012_.pdf. Accessed November 27, 2014. | |
Argrawal A. Dismantling the divide between indigenous and scientific knowledge. Development and Change. 1995;26(3):413–439. | |
Beckford C, Barjker D. The role and value of local knowledge in Jamaican agriculture: adaptation and change in small-scale farming. Geographical Journal. 2007;173(2):118–128. | |
Gadgil M, Olsson P, Berkes F, Folke C. Exploring the role of local ecological knowledge in ecosystem management: three case studies. In: Berkes F, Colding J, Folke C, editors. Navigating Social-Ecological Systems: Building Resilience for Complexity and Change. Cambridge, NY: University Press; 2003;213–233. | |
Reed MS, Dougill AJ, Taylor MJ. Integrating local and scientific knowledge for adaptation to land degradation: Kalahari rangeland management options. Land Degradation and Development. 2007;18(3):249–268. | |
Matheson L. The Grape Debate: Adapting to Climate Change in the Niagara Grape and Wine Industry [master’s thesis]. Ontario: University of Guelph; 2008. | |
Tol RS, Yohe GW. The weakest link hypothesis for adaptive capacity: an empirical test. Global Environmental Change. 2007;17:218–227. |
 © 2015 The Author(s). This work is published and licensed by Dove Medical Press Limited. The full terms of this license are available at https://www.dovepress.com/terms.php and incorporate the Creative Commons Attribution - Non Commercial (unported, v3.0) License.
By accessing the work you hereby accept the Terms. Non-commercial uses of the work are permitted without any further permission from Dove Medical Press Limited, provided the work is properly attributed. For permission for commercial use of this work, please see paragraphs 4.2 and 5 of our Terms.
© 2015 The Author(s). This work is published and licensed by Dove Medical Press Limited. The full terms of this license are available at https://www.dovepress.com/terms.php and incorporate the Creative Commons Attribution - Non Commercial (unported, v3.0) License.
By accessing the work you hereby accept the Terms. Non-commercial uses of the work are permitted without any further permission from Dove Medical Press Limited, provided the work is properly attributed. For permission for commercial use of this work, please see paragraphs 4.2 and 5 of our Terms.