")
Back to Journals » Clinical Ophthalmology » Volume 11
Evaluation of the effect of corneal collagen cross-linking for keratoconus on the ocular higher-order aberrations
Authors El-Massry AA , Dowidar AM, Massoud TH, Tadros BG
Received 19 May 2017
Accepted for publication 27 June 2017
Published 9 August 2017 Volume 2017:11 Pages 1461—1469
DOI https://doi.org/10.2147/OPTH.S142167
Checked for plagiarism Yes
Review by Single anonymous peer review
Peer reviewer comments 3
Editor who approved publication: Dr Scott Fraser
Ahmed Abdel-Karim El-Massry, Amgad Mostafa Dowidar, Tamer Hamdy Massoud, Baher Guirguis Daoud Tadros
Department of Ophthalmology, Faculty of Medicine, Alexandria University, Alexandria Governorate, Egypt
Background: Corneal collagen cross-linking (CXL) is the only treatment currently available to arrest the progression of keratoconus. The procedure consists of photopolymerization of stromal collagen fibers induced by combined action of a photosensitizing substance (riboflavin or vitamin B2) and ultraviolet-A light.
Purpose: To determine changes in the ocular higher-order aberrations (HOAs) after CXL and its correlation with changes in visual acuity.
Design: Prospective interventional study.
Subjects and methods: This study was conducted on 30 eyes of 16 patients with progressive keratoconus documented between 2012 and 2014. Patients were treated with epithelium-off CXL and followed for a minimum of 6 months. The following ocular HOAs were measured and analyzed using I-Tracey Aberrometer: coma, trefoil, spherical aberration, astigmatism, and total HOAs.
Results: There was statistically significant improvement in uncorrected visual acuity and best-corrected visual acuity between the preoperative and 6-month evaluations (P<0.001). Total HOAs and total coma were statistically significantly reduced at 6 months by 25% and 18%, respectively. Significant improvement was seen in spherical aberration by 8.71% (P<0.001), while no significant change was observed in trefoil and high order astigmatism (P=0.405 and 0.329, respectively). There was a statistically significant change in the average (K) value at the apex between the preoperative values and the 6-month values (P<0.05).
Conclusion: Total HOAs, total coma, and spherical aberrations decreased after CXL. Coma has a direct relationship with the improvement of visual function.
Keywords: collagen cross-linking, progressive keratoconus, ultraviolet irradiation, wavefront aberrations
Introduction
Keratoconus (KC) is non-inflammatory progressive central or paracentral corneal thinning, leading to irregular astigmatism, progressive myopia, and increased higher-order aberrations (HOAs), with consequent impaired visual function.1
The incidence of KC in general population is ~1 per 2,000, and the estimated prevalence is reported to be 54.5 per 100,000.2 Decrease in keratocyte density, reduction in the number of lamellae, and a degradation of fibroblasts in KC corneal stroma lead to the reduction in the corneal thickness and biomechanical strength.3
The diagnosis of KC is typically made on the basis of a combination of clinical signs, corneal topographic and tomographic signs. The KC topographic patterns differ qualitatively and quantitatively from that of normal corneas.4 Combination of topography and wavefront analysis may help define keratoconic subtypes and increase the sensitivity and specificity for early detection of subclinical KC.
Corneal collagen cross-linking (CXL) has emerged as a promising management option for KC. In CXL, the interaction of ultraviolet-A (UVA, 365 nm) and riboflavin 0.1% in 20% dextran solution (Ricrolin, Sooft Italia S.p.A., Montegirorgio, Italy), which acts as a photomediator that increases UVA light absorption within the corneal stroma, leads to cross-linking within the collagen and intracellular matrix of the stroma and results in an increase in the formation of covalent intrafibrillar and interfibrillar bonds by photosensitized oxidation, most predominantly in the anterior 300 mm, resulting in the strengthening of the cornea.5
The iTrace (Tracey Technology, Houston, TX, USA) measures aberrations using a position-sensitive detector to measure the displacement of a laser beam relative to the fovea. This process uses 64 laser beams to be projected through the entrance pupil 4 times each (256 points) at high speed (~250 ms).6
Zernike polynomials are useful for describing the shape of an aberrated wavefront in the pupil of a complex optical system.7 Each Zernike polynomial coefficient term is arranged and recognized by two features – angular frequency and its radial order. The coefficient values have both a magnitude and a sign which describe how that particular term makes up a certain proportion of the total wave aberration. Aberrations are defined by either a negative or a positive sign as well as a magnitude. The Zernike aberrations may be additive or they offset each other.8
HOAs can be a valuable diagnostic tool in detecting subtle disorders of the cornea or lens and for grading the severity of KC. The magnitude of total HOA, vertical coma, is significantly higher in KC than in normal eyes.9 The combination of cone sizes, location, and an irregular shape results in the occurrence of worst, visually significant HOAs.10
Gobbe and Guillon11 were the first to use the aberration values of vertical coma as a diagnostic tool for KC with a high level of sensitivity. The average total coma root mean square (RMS) value for a 6-mm corneal aperture was 0.28±0.15 μm in normal eyes and 3.10±2.28 μm in keratoconic eyes. Maeda et al12 also found that, compared to normals, keratoconic patients had significantly higher levels of third-order RMS error in both corneal (0.26 μm in normals vs 1.99 μm in keratoconics) and ocular aberration measurements (0.25 μm in normals vs 1.83 μm in keratoconics). Barbero et al13 reported that coma aberration was 3.74 times higher in eyes with KC than in normal controls. Similar results found by Jafri et al9 reported that higher vertical coma and higher RMS values were found in patients with suspected and early KC. Also Alio and Shabayek14 reported that there was a significant increase in total corneal wavefront HOAs at a 6-mm optical zone in keratoconic eyes. Alio mentioned the role of coma in limiting the visual quality.
Increased corneal HOAs and ocular HOAs are sequelae of KC that contribute to the diminished visual function. The most common and potentially disruptive HOAs are spherical aberration and coma. As KC progresses, the cone bulges anteriorly and the cornea thins and steepens and becomes more prolate, which explain why the spherical aberration becomes more negative. Spherical aberration creates halos around points of light while coma makes points of light appear like a comet.15
Rationalization
Some studies report improved uncorrected visual acuity (UCVA) and best-corrected visual acuity (BCVA) following CXL. Since HOAs constitute a major component of aberrations in keratoconic eye, evaluation after such a procedure is essential to detect changes induced by the procedure.
Aim of the work
The aim of this work is to determine changes in the corneal and ocular HOAs after CXL, as measured by the I-Tracey Aberrometer, and to correlate these changes with changes in visual acuity (VA).
Subjects and methods
This study was a prospective interventional study. It was conducted between March 2012 and November 2014 comprising 30 keratoconic eyes in Alex Eye Center. The ethics committee of the Faculty of Medicine in Alexandria University, Egypt, approved this study.
Inclusion criteria were: progressive KC (one or more of the following changes over 12 months: an increase of 1.00 diopter (D) or more in the steepest K value, an increase of 1.00 D or more in manifest cylinder, or an increase of 0.50 D or more in manifest refraction spherical equivalent (SE) or decrease in thickness >30 μ. Patients under the age of 20 years were considered progressive solely on the basis of their age)16 in first, second, or third stage according to Amsler-Krumeich’s classification1 with clear corneas, minimal corneal thickness not <400 μ after removal of the epithelium, and abstinence of rigid contact lenses wearing for 1 month before initial evaluation.
Exclusion criteria included pregnancy, patients with central or paracentral corneal opacities or scars, a clinical history of herpetic keratitis, evidence of active ophthalmic inflammation, autoimmune diseases, severe dry eye, and patients with previous ocular surgeries.
Preoperative evaluation
This study was performed in ethical considerations under the principles of the Helsinki Declaration and informed consent was obtained from all patients and written consent from the parents or guardians of those under the legal age for consent.
- A baseline ophthalmic examination was performed on all eyes, which included slit lamp biomicroscopy, ultrasonic corneal pachymetry, and simultaneous measurement of corneal tomography, Scheimpflug camera-based corneal topography (Pentacam ALLEGRO oculyzer version 1074, WaveLight AG, Erlangen, Germany), and wavefront aberrometry.
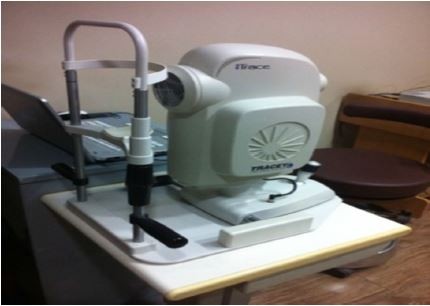
The iTrace (Figure 1) was used to evaluate HOA and refractions. VA was determined using Snellen charts. For the purpose of statistical analysis, the Snellen VA was converted to the corresponding logarithm of the minimum angle of resolution (log MAR) value using standard conversion tables.
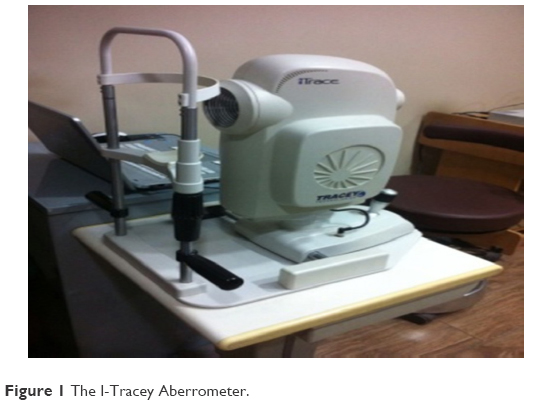 | Figure 1 The I-Tracey Aberrometer. |
All measurements were obtained by an experienced operator using the same machines and procedures.
Cross-linking procedure
- CXL was performed under topical anesthesia (Benoxinate HCL drops 0.4%) instilled twice for 2 min before the procedure;
- routine sterile conditions in OR;
- povidone iodine 10% was used for skin disinfection;
- with lid speculum inserted;
- epithelium-off technique, under operating microscope, the central 8–9 mm of the corneal epithelium was debrided with a hockey knife to enable adequate stromal riboflavin absorption;
- instillation of riboflavin (0.1% solution 10 mg riboflavin-5-phosphate in 10 mL dextran-T-500 20% solution) every 5 min for 30 min until the stroma was completely penetrated and a yellow coloration was seen in the anterior chamber on slit lamp biomicroscopy;
- the central 8–9 mm of the cornea irradiated with UVA (370 nm), at 3 mW/cm2 for 30 min;
- irrigation of the ocular surface with balanced salt solution was performed;
- at the end of the procedure, a bandage soft contact lens was kept in place until full corneal re-epithelialization occurred.
The postoperative treatments were as follows:
- Topical steroid (prednisolone acetate 1% eye drops) and antibiotic (moxifloxacin 0.5% eye drops) four times daily for 1 week; then antibiotic drops stopped. Steroid tapered to three times/day for the next week and then two times/day for the next 2 weeks.
- Lacrimal substitutes (preservative-free artificial tears) were administered four times daily for 4–6 weeks.
Statistical analysis of data
Data were fed to the computer and analyzed using IBM SPSS software package version 20.0 (IBM Corporation, Armonk, NY, USA). Qualitative data were described using number and percent. The Kolmogorov–Smirnov test was used to verify the normality of distribution. Quantitative data were described using range (minimum and maximum), mean, SD, and median. Significance of the obtained results was judged at the 5% level.
After that, the comparison between the measurements made pre-CXL and 6 months post-CXL were analyzed applying the parametric paired sample Student’s t-test. Analysis of variance (ANOVA) with repeated measures was used for normally quantitative variables, to compare between more than two periods, and post hoc test (Bonferroni) was used for pairwise comparisons. Wilcoxon-signed rank test was used for abnormally quantitative variables and to compare between two periods. Spearman’s coefficient in order to determine correlation between two abnormally quantitative variables were also carried out. The percentage of changes means the sum of average of postminus premeasurements over premeasurement multiplied by 100%.
Results
Thirty eyes of 16 patients were included in the study with 7 males and 9 females; mean age of the patients was 24.5±5.29 years (range: 17–32 years).
Corneal thickness
Table 1 shows that significant corneal thinning was found between pre-CXL and (1, 3, and 6 months) post-CXL (P<0.05). Pachymetric data did not reach the pre-CXL thickness by the end of 6 months (Figure 2).
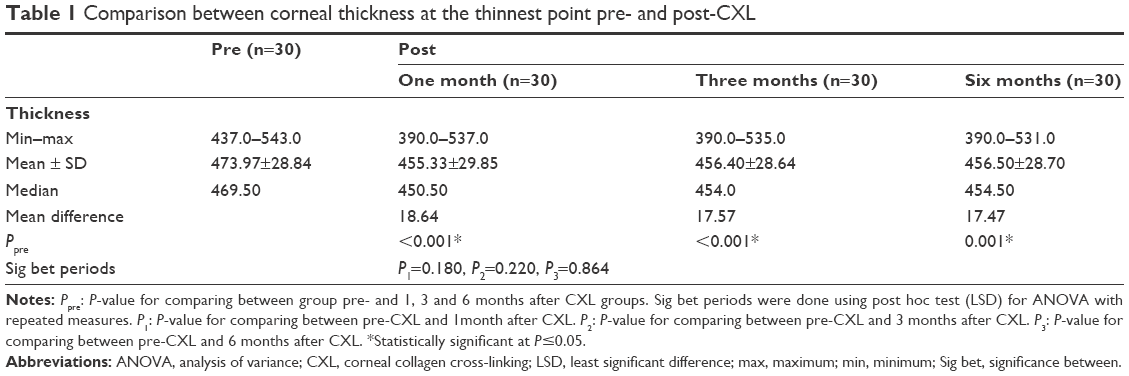 | Table 1 Comparison between corneal thickness at the thinnest point pre- and post-CXL |
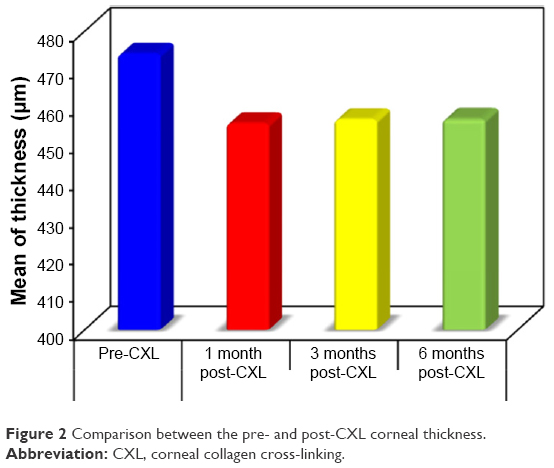 | Figure 2 Comparison between the pre- and post-CXL corneal thickness. |
UCVA and CDVA (in log MAR)
The mean preoperative UCVA was 1.15±0.44 log MAR. Postoperative UCVA at 6 months was 0.85±0.43 log MAR. Pre- and postoperative UCVA differences were statistically significant (P<0.001) (Table 2; Figure 3).
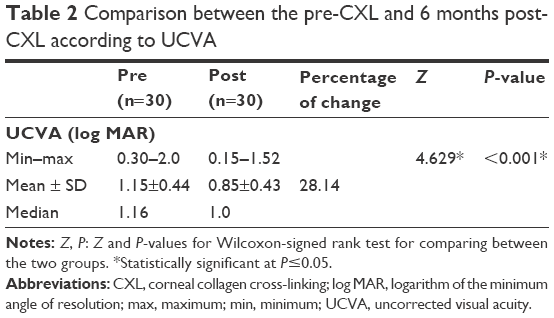 | Table 2 Comparison between the pre-CXL and 6 months post-CXL according to UCVA |
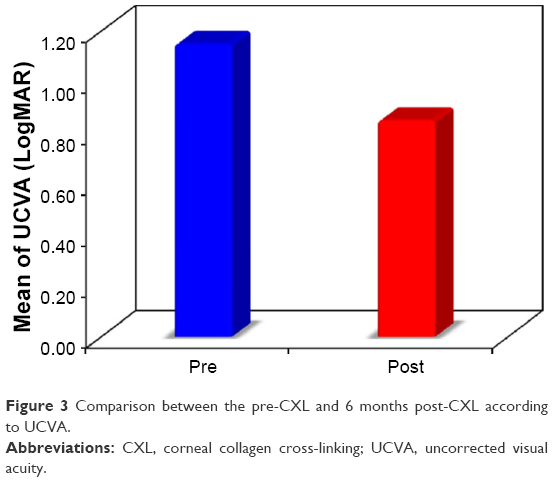 | Figure 3 Comparison between the pre-CXL and 6 months post-CXL according to UCVA. |
Mean 6 months corrected distant visual acuity (CDVA) significantly improved by about 1 Snellen line, from log MAR 0.25±0.17 to 0.17±0.15 (Table 3; Figure 4).
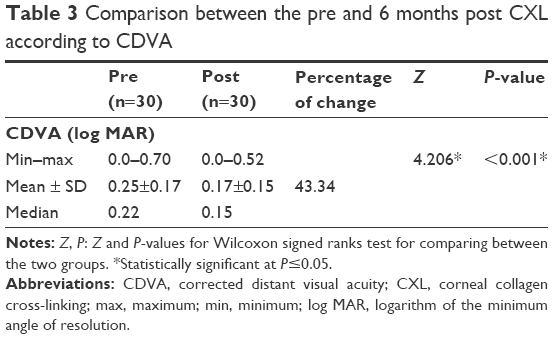 | Table 3 Comparison between the pre and 6 months post CXL according to CDVA |
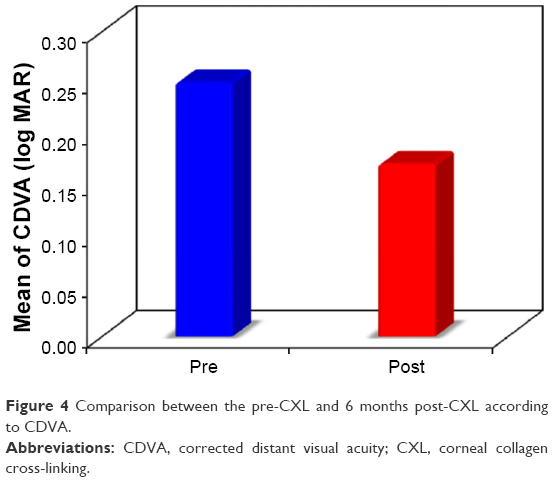 | Figure 4 Comparison between the pre-CXL and 6 months post-CXL according to CDVA. |
Keratometry
There was a statistically significant decrease in the average K readings from the preoperative values (P<0.05). The preoperative average K was 47.21±3.18 D (range 41.95–55.49) and changed to 44.14±2.09 D (range 41.55–51.05) (Table 4).
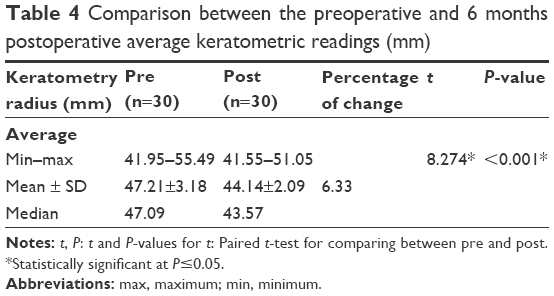 | Table 4 Comparison between the preoperative and 6 months postoperative average keratometric readings (mm) |
Progression of corneal steepening from the preoperative value was not observed in any of the treated eyes.
Aberrometric outcomes
Higher-order aberrations
HOAs were reported for a 6 mm diameter. Preoperatively, the total HOAs RMS was 2.05±1.55 μm (range 0.06–6.21, median 1.79). At 6 months, it had significantly reduced to 1.36±1.25 μm (P<0.001, range 0.03–4.72, median 0.94) (Table 5; Figure 5).
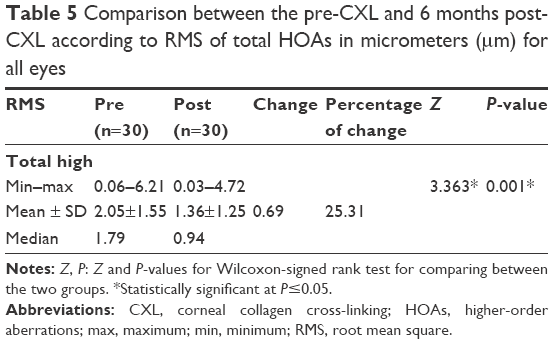 | Table 5 Comparison between the pre-CXL and 6 months post-CXL according to RMS of total HOAs in micrometers (μm) for all eyes |
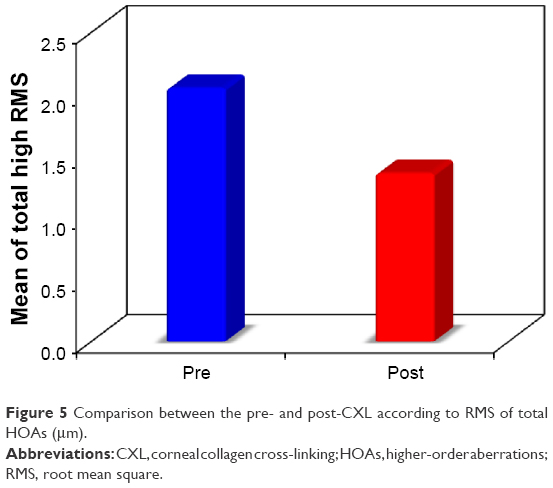 | Figure 5 Comparison between the pre- and post-CXL according to RMS of total HOAs (μm). |
Coma aberration
Preoperatively, the mean total coma aberrations coefficient was 1.72±1.38 μm (range 0.02–5.70, median 1.35). At 6 months, it had significantly reduced to 1.11±1.01 μm (P<0.001, range 0.01–3.86, median 2.03) (Table 6; Figure 6).
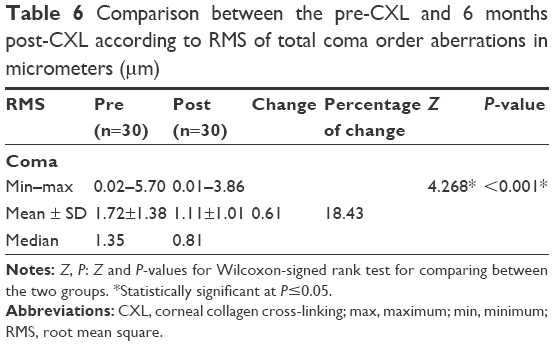 | Table 6 Comparison between the pre-CXL and 6 months post-CXL according to RMS of total coma order aberrations in micrometers (μm) |
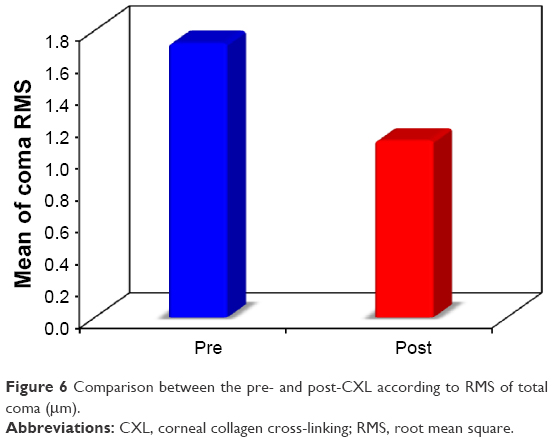 | Figure 6 Comparison between the pre- and post-CXL according to RMS of total coma (μm). |
Spherical aberration
Preoperatively, the mean spherical aberrations coefficient was 0.50±0.58 μm (range 0.01–2.64, median 0.29). At 6 months, it had reduced to 0.48±0.57 μm (P<0.001, range 0.01–2.60, median 0.27) which was statistically significant (P<0.001) (Table 7).
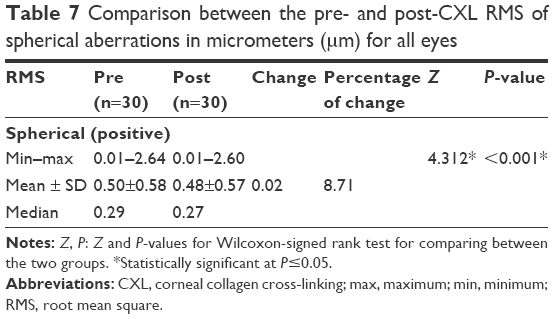 | Table 7 Comparison between the pre- and post-CXL RMS of spherical aberrations in micrometers (μm) for all eyes |
Trefoil aberration
Preoperatively, the trefoil aberrations RMS was 0.41±0.28 μm (range 0.03–1.33, median 0.42). At 6 months, it had reduced to 0.40±0.32 μm (range 0.01–1.24, median 0.34) which was not statistically significant (P=0.405) (Table 8).
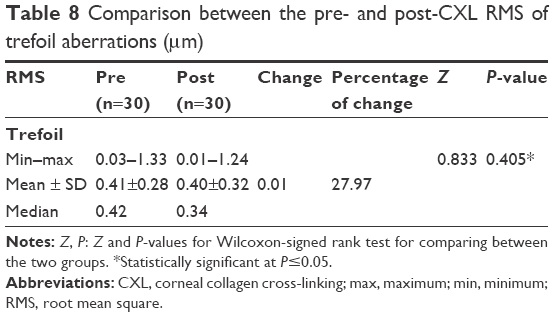 | Table 8 Comparison between the pre- and post-CXL RMS of trefoil aberrations (μm) |
Secondary astigmatism aberration
Preoperatively, the secondary astigmatism RMS was 0.25±0.27 μm (range 0.03–1.26, median 0.19). At 6 months, it had reduced to 0.22±0.25 μm (P<0.001, range 0.01–1.09, median 0.15) which was not statistically significant (P=0.329) (Table 9).
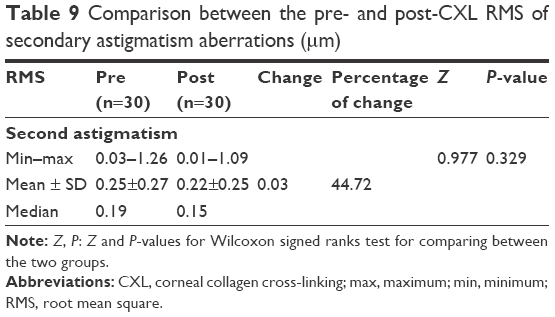 | Table 9 Comparison between the pre- and post-CXL RMS of secondary astigmatism aberrations (μm) |
Correlation between percentage of change of CDVA to percentage of change of total aberrations, total low order aberrations, total high order aberrations, spherical equivalent, and coma aberrations
There was a reduction in percentage of change of CDVA in relation to percentage of change of total aberrations (P=0.579, rs=−0.108), total low order aberrations (P=0.444, rs=−0.148), total high order aberrations (P=0.105, rs=−0.307), SE (P=0.587, rs=0.105), and coma aberrations (P=0.005, rs=−0.508) which was only statistically significant (P<0.05) (Table 10; Figure 7).
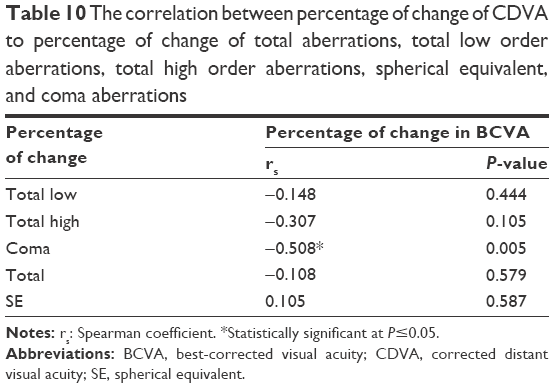 | Table 10 The correlation between percentage of change of CDVA to percentage of change of total aberrations, total low order aberrations, total high order aberrations, spherical equivalent, and coma aberrations |
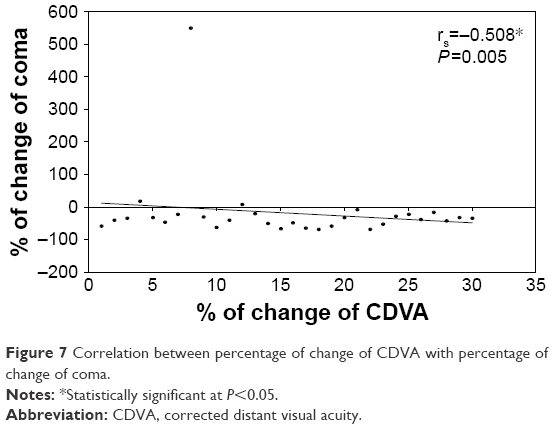 | Figure 7 Correlation between percentage of change of CDVA with percentage of change of coma. |
Spearman coefficient (rs) shows the strong correlation between the percentage of changes in CDVA and percentage of changes in comparing pre-CXL and 6 months post-CXL (Table 10).
The present study revealed that the adverse events were minimal and transient. Pain and decrease of VA in few postoperative days were due to epithelial removal. All treated eyes exhibited some degree of anterior corneal haze in the early postoperative period which disappeared in 6 months. No eyes lost any line of BCVA.
Discussion
CXL is a minimally invasive procedure. It was introduced by Wollensak et al as a promising treatment to stabilize progressive KC. It is indicated only in early-to-moderate KC.17 Numerous publications confirm the clinical efficacy and safety of the procedure.18,19 The only CXL treatment approved by the Food and Drug Administration (FDA) is the epithelium-off method.
The current study was aimed to determine changes in the corneal and ocular HOA after CXL as measured by the I-Tracey Aberrometer. In addition, changes in HOAs were correlated with changes in VA. The results of the present work were obtained from the same patients before and 6 months after surgery.
In keratoconic eyes, VA was used clinically for assessing the impact of HOAs. Increased levels of HOAs introduced by KC lead to reduced VA. Conversely, correcting HOAs by CXL can improve VA.8 MAR varied linearly with the magnitude (RMS) of all modes of aberration. Not all HOAs have the same ability to degrade vision; the impact of individual Zernike lower and HOAs varied significantly with mode.8,20 By using wavefront technology, the correlation between the quality of the image on the retina and HOA can be tested through examination of the point spread function (PSF), which affects the patient’s visual quality outcome. Large, degradated and blurred PSF means decrease in the quality of the image as in a patient with KC, whereas in the normal eyes, the PSF found is small and round.21
As RMS error increases by >0.05 μm, high- and low-contrast acuity decreases and is well described by a linear function across Zernike modes.21 Modes that are 2 radial orders apart in the Zernike expansion and have the same angular frequency can be combined to improve VA. Modes within the fourth Zernike radial order generally combine to decrease acuity.8
The present study revealed that there was a statistically significant improvement in the UCVA and CDVA postoperatively. The mean preoperative UCVA was 1.15±0.44 log MAR, whereas the mean postoperative UCVA at the last visit (after 6 months) was 0.85±0.43 log MAR. Also the improvement in the CDVA was significant where the mean preoperative CDVA was 0.25±0.17, whereas the mean postoperative CDVA after 6 months was 0.17±0.15 (P<0.001).
Postoperative improvement of VA has been noted in numerous other CXL studies as well. Derakhshan et al22 have published their observational study on the effect of cross-linking as primary treatment for patients with early KC, with mean follow-up of 6 months. Their results show significant improvement in UCVA and BCVA, and reduction in SE and keratometric readings. Visual improvement in most patients began after the first month, slightly increased by the third month, and remained stable until 6 months. Similarly, Vinciguerra et al23 found that in patients with KC, mean best-corrected vision (log MAR) improved from 0.28 to 0.14 at 12 months postoperatively. Also Raiskup-Wolf et al24 and Caporossi et al25 reported significant improvements in CDVA, with continued improvement after 1-year follow-up. They noticed a trend toward a more regular cornea.
In the present study, there was a statistically significant reduction in mean K reading. The preoperative mean K was 47.21±3.18 D (range 41.95–55.49) and changed to 44.14±2.09 D (range 41.55–51.05). This finding was also addressed by Caporossi et al,21 who recorded topographic mean reduction in dioptric power of 2.1±0.13 D. In addition, Raiskup-Wolf et al24 reported that the improvement in vision after cross-linking is caused by a decrease in corneal curvature and by topographical homogenization of the cornea as a result of the increased rigidity in the cross-linked cornea.
Initial worsening of keratometric readings observed by Caporossi et al25 in the first month may be due to transient haze and corneal edema. Doors et al26 postulated that it may be due to corneal remodeling. In contrast, Vinciguerra et al23 suggested that it may be, in part, due to the epithelial layer being thickest around the cone and thinnest at its apex, masking the underlying steepness. Immediately after the removal of epithelium, they found that the steepest K reading changed from a mean of 58.82–61.05 D.
The iTrace is also an auto refractometer based on the Zernike coefficients. Different refractive values, depending on the size of the pupil area analyzed (multi-zone refraction analysis), are obtained. In the present study, there was a statistically significant reduction in the mean spherical error (3.75±2.60 D changed to 2.36±1.57 D); the preoperative mean cylindrical error was 4.43±2.47D and changed to 2.89±1.54D and the preoperative mean SE error was 5.97±2.88 D and changed to 3.80±1.80 D. Improvements in refractive error following collagen cross-linking have been highlighted in several published reports. The mean improvements of 1.03–2.25 D SE during 6 to 23 months have been reported.
Patients’ pachymetry was recorded throughout the study which reveals that initially there was a statistically significant corneal thinning. These initial changes may be attributed to the corneal deepithelialization that was performed during the CXL procedure, postoperative keratocyte apoptosis, and structural changes in corneal collagen fibrils and extracellular matrix in the anterior stroma (250–300 mm). Reduced corneal thickness may also be explained by the increase in endothelial pump activity or density induced by the treatment. The corneal thickness gradually increased after the first month of treatment and this increasing value did not reach the preoperative reading by the end of 6 months follow-up.
Almost all keratoconic aberrations in this work were from the cornea as seen from the total refractive map in I-Tracey Aberrometer. These results go hand in hand with several investigators,13,14 who found a similarity between whole eye aberrations and the corneal aberrations measured by the corneal videokeratographer, as most – but not all – of the HOAs in keratoconic eyes arise from the anterior corneal surface.
In the present study, total HOAs and total coma were statistically significantly reduced at 6 months by 25% and 18%, respectively. The RMS of total HOAs was 2.05±1.55 μm, and 6 months later, it had reduced to 1.36±1.25 μm (P<0.001), while the RMS of total coma aberrations was 1.72±1.38 μm, and 6 months later, it had reduced to 1.11±1.01 μm (P<0.001). Significant improvement was seen in spherical aberration (P<0.001), while no significant change was observed in trefoil and astigmatism (P=0.405 and 0.329, respectively).
Previous reports mentioned significant improvement in total and corneal aberrations such as total coma and spherical aberration. Vinciguerra et al23 reported a significant decrease in total aberrations, a reduction in all corneal aberrations up to the seventh order, and a significant decrease in coma which are the dominant HOAs in KC after CXL. It is believed that the cornea assumes a more regular shape after CXL. Similar observations were reported by Caporossi et al25 who found a statistically significant reduction in the total corneal HOA and coma aberration, starting early after treatment and increasing for up to 24 months in 44 eyes. However, our results were not consistent with Greenstein et al27 who reported that the changes in HOAs were not statistically correlated with improvements in VA, despite significant improvements in vision, topography, and wavefront measures after CXL, as there is a high variability in objective measurements in the KC, as well as differing lengths of follow-up.
The findings of this study reinforce what was previously known regarding improvements in total HOA and total coma measures using the I-Tracey Aberrometer. Multivariable analysis found changes in coma were significantly and strongly associated with the postoperative changes in CDVA. Improvement in HOA profile is one mechanism by which CXL enhances visual function in keratoconic corneas.
Conclusions
- Total HOAs, total coma, and spherical aberrations significantly decreased after CXL.
- Ocular aberrations play a key role in influencing retinal image quality. Correcting HOAs in patients with KC is likely to improve the quality of vision significantly. The predominant defect is the coma aberration.
Further studies with larger samples and longer follow-up period are recommended to confirm the presented study.
Disclosure
The authors report no conflicts of interest in this work.
References
Krachmer JH, Feder RS, Belin MW. Keratoconus and related non inflammatory corneal thinning disorders. Surv Ophthalmol. 1984;28(4):293–322. | ||
Gomes JA, Rapuano CJ, Belin MW, Ambrósio Jr R, Group of Panelists for the Global Delphi Panel of Keratoconus and Ectatic Diseases. Global consensus on keratoconus diagnosis. Cornea. 2015;34(12):38–39. | ||
Georgiou T, Funnell CL, Cassels-Brown A, O’Conor R. Influence of ethnic origin on the incidence of keratoconus and associated atopic disease in Asians and white patients. Eye (Lond). 2004;18(4):379–383. | ||
Orucoglu F, Toker E. Comparative analysis of anterior segment parameters in normal and keratoconus eyes generated by scheimpflug tomography. J Ophthalmol. 2015;2015:925414. | ||
Romero Jimenez M, Santodomingo-Rubido J, Wolffsohn JS. Keratoconus: a review. Cont Lens Anterior Eye. 2010;33(4):157–166. | ||
Molebny VV, Panagopoulou SI, Molebny SV, Wakil YS, Pallikaris IG. Principles of ray tracing aberrometry. J Refract Surg. 2000;16(5):S572–S575. | ||
Klyce SD, Karon MD, Smolek MK. Advantages and disadvantages of the Zernike expansion for representing wave aberration of the normal and aberrated eye. J Refract Surg. 2004;20(5):S537–S541. | ||
Applegate RA, Marsack JD, Ramos R, Sarver EJ. Interaction between aberrations to improve or reduce visual performance. J Cataract Refract Surg. 2003;29(8):1487–1495. | ||
Jafri B, Li X, Yang H, Rabinowitz YS. Higher order wavefront aberrations and topography in early and suspected keratoconus. J Refract Surg. 2007;23(8):774–781. | ||
Schwiegerling J. Cone dimensions in keratoconus using Zernike polynomials. Optom Vis Sci. 1997;74(11):963–969. | ||
Gobbe M, Guillon M. Corneal wavefront aberration measurements to detect keratoconus patients. Cont Lens Anterior Eye. 2005;28(2):57–66. | ||
Maeda N, Fujikado T, Kuroda T, et al. Wavefront aberrations measured with hartmann-shack sensor in patients with keratoconus. Ophthalmology. 2002;109(11):1996–2003. | ||
Barbero S, Marcos S, Merayo-Lioves J, Moreno Barriuso E. Validation of the estimation of corneal aberrations from videokeratography in keratoconus. J Refract Surg. 2002;18(3):263–270. | ||
Alio JL, Shabayek MH. Corneal higher order aberrations: a method to grade keratoconus. J Refract Surg. 2006;22(6):539–545. | ||
Hagar Hefner-Shahar, Nir Erdinest. High-order Aberrations in Keratoconus. Int J Kerat Ect Cor Dis. 2016;5(3):128–131. | ||
Reeves SW, Stinnett S, Adelman RA, Afshari NA. Risk factors for progression to penetrating keratoplasty in patients with keratoconus. Am J Ophthalmol. 2005;140(4):607–611. | ||
Wollensak G, Spoerl E, Seiler T. Riboflavin/ultraviolet-a-induced collagen crosslinking for the treatment of keratoconus. Am J Ophthalmol. 2003;135(5):620–627. | ||
Raiskup F, Theuring A, Pillunat LE, Spoerl E. Corneal collagen crosslinking with riboflavin and ultraviolet-A light in progressive keratoconus: ten-year results. J Cataract Refract Surg. 2015;41(1):41–46. | ||
Meiri Z, Keren S, Rosenblatt A, Sarig T, Shenhav L, Varssano D. Efficacy of corneal collagen cross-linking for the treatment of keratoconus: a systematic review and meta-analysis. Cornea. 2016;35(3):417–428. | ||
Applegate RA, Sarver EJ, Khemsara V. Are all aberrations equal? J Refract Surg. 2002;18(5):S556–S562. | ||
Mihaltz K, Kovacs I, Kranitz K, Erdei G, Nemeth J, Nagy ZZ. Mechanism of aberration balance and the effect on retinal image quality in keratoconus: optical and visual characteristics of keratoconus. J Cataract Refract Surg. 2011;37(5):914–922. | ||
Derakhshan A, Heravian Shandiz J, Ahadi M, Daneshvar R, Esmaily H. Short-term outcomes of collagen crosslinking for early keratoconus. J Ophthalmic Vis Res. 2011;6(3):155–159. | ||
Vinciguerra P, Albè E, Trazza S, et al. Refractive, topographic, tomographic, and aberrometric analysis of keratoconic eyes undergoing corneal cross-linking. Ophthalmol. 2009;116(3):369–378. | ||
Raiskup-Wolf F, Hoyer A, Spoerl E, Pillunat LE. Collagen crosslinking with riboflavin and ultraviolet-A light in keratoconus: long-term results. J Cataract Refract Surg. 2008;34(5):796–801. | ||
Caporossi A, Baiocchi S, Mazzotta C, Traversi C, Caporossi T. Parasurgical therapy for keratoconus by riboflavin ultraviolet type A rays induced cross-linking of corneal collagen: preliminary refractive results in an Italian study. J Cataract Refract Surg. 2006;32(5):837–845. | ||
Doors M, Tahzib NG, Eggink FA, Berendschot TT, Webers CA, Nuijts RM. Use of anterior segment optical coherence tomography to study corneal changes after collagen cross-linking. Am J Ophthalmol. 2009;148(6):844–851. | ||
Greenstein SA, Fry KL, Hersh MJ, Hersh PS. Higher-order aberrations after corneal collagen crosslinking for keratoconus and corneal ectasia. J Cataract Refract Surg. 2012;38(2):292–302. |
 © 2017 The Author(s). This work is published and licensed by Dove Medical Press Limited. The full terms of this license are available at https://www.dovepress.com/terms.php and incorporate the Creative Commons Attribution - Non Commercial (unported, v3.0) License.
By accessing the work you hereby accept the Terms. Non-commercial uses of the work are permitted without any further permission from Dove Medical Press Limited, provided the work is properly attributed. For permission for commercial use of this work, please see paragraphs 4.2 and 5 of our Terms.
© 2017 The Author(s). This work is published and licensed by Dove Medical Press Limited. The full terms of this license are available at https://www.dovepress.com/terms.php and incorporate the Creative Commons Attribution - Non Commercial (unported, v3.0) License.
By accessing the work you hereby accept the Terms. Non-commercial uses of the work are permitted without any further permission from Dove Medical Press Limited, provided the work is properly attributed. For permission for commercial use of this work, please see paragraphs 4.2 and 5 of our Terms.